
Abstract
Background
A recent study used simulated internal quality control data (4 specimens × 40 replicates) to investigate the use of variance functions in estimating limit of blank and limit of detection, as per ISO definitions. Small systematic negative biases were found (typically <1%), but subsequent investigation has shown that these estimates had unacceptably large uncertainties because of an inadequate simulation size.
Methods
The previous data generation and variance function estimations were repeated 25 times using a different random number generator seed on each occasion. The study was further extended by increasing data quantities 100-fold and by reducing the number of replicates per specimen (40 through 20, 10, 5 and 2).
Results
The previously reported negative biases were shown to be an artefact, and this was confirmed by simulations using 100-fold more data. Biases were <|0.1%| throughout with replication ≥20, but positive biases were found at lower replication; up to + 1.23% in the case of duplicates and large variances (e.g. some immunoassays) and up to + 0.2% in the case of duplicates and small variances.
Conclusions
The variance function provides essentially unbiased estimates of limit of blank and limit of detection at data replication ≥20 (bias: <1 part in 1000) and minimal biases at lower replication when measurement errors are small.
Introduction
A recent study 1 used simulations to evaluate the use of variance functions in estimating limit of blank (LoB), limit of detection (LoD) and their 95% confidence intervals (CIs). The basic data set consisted of 40 randomly drawn replicates at each of four target concentrations, aimed at mimicking internal quality control data over a two-month period. Ten thousand such data sets were drawn for each of several design factors to evaluate the accuracy of recovery of the known underlying LoB and LoD values.
On average, the variance functions systematically underestimated the true underlying variances at the lowest target concentrations, and this translated into small negative biases in the recovered estimates of LoB and LoD (typically < 1%). In consequence, CI coverage was slightly lower than the expected 95% (typically 92–95%). Furthermore, the entire study was performed twice; firstly to establish correlations between the LoB and LoD constituent variables (required for CI calculations), while the second run produced the reported results. 1 Different random number generator seeds were used for the two runs (1 and 66, respectively). Very similar negative biases were found in both runs which reinforced the legitimacy of the study. Regrettably, subsequent investigation has shown that the simulation size was too small to yield reliable bias estimates.
Methods
The previous study
1
suggested that variance function estimation may not be reliable over narrow data ranges when relative error is large (inevitable near the detection limit of any measurement system). Re-evaluation was therefore restricted to moderate and wide range data and the variance functions


Results
Figure 1 shows the bias estimates relevant to the earlier study.
1
The large variation produced by the 25 separate runs of data demonstrate that a run length of 1.6 × 10⁶ was clearly inadequate for producing definitive low-end bias estimates. The similarity of results produced by seed numbers 1 and 66 gave no hint that the study design might be deficient.
Biases, measured as the difference between the mean predicted variance from 10,000 variance functions and the true underlying value, at the lowest target concentration, expressed as a percentage. M and W denote moderate and wide data ranges, respectively. L and S denote large and small variances, respectively. Variance functions (1), (2) and (3) are represented by circles, hexagons and diamonds, respectively. Each of the 25 data points on each row represents a separate group of 10,000 variance functions where the data were randomly drawn using a different random number generator seed (1, 7, 10, 15, 18, 23, 26, 31, 34, 39, 42, 47, 50, 55, 58, 63, 66, 71, 74, 79, 82, 87, 90, 95 and 99). Results for seeds 1 and 66 (used in the previous study
1
) are indicated by grey and black shading, respectively.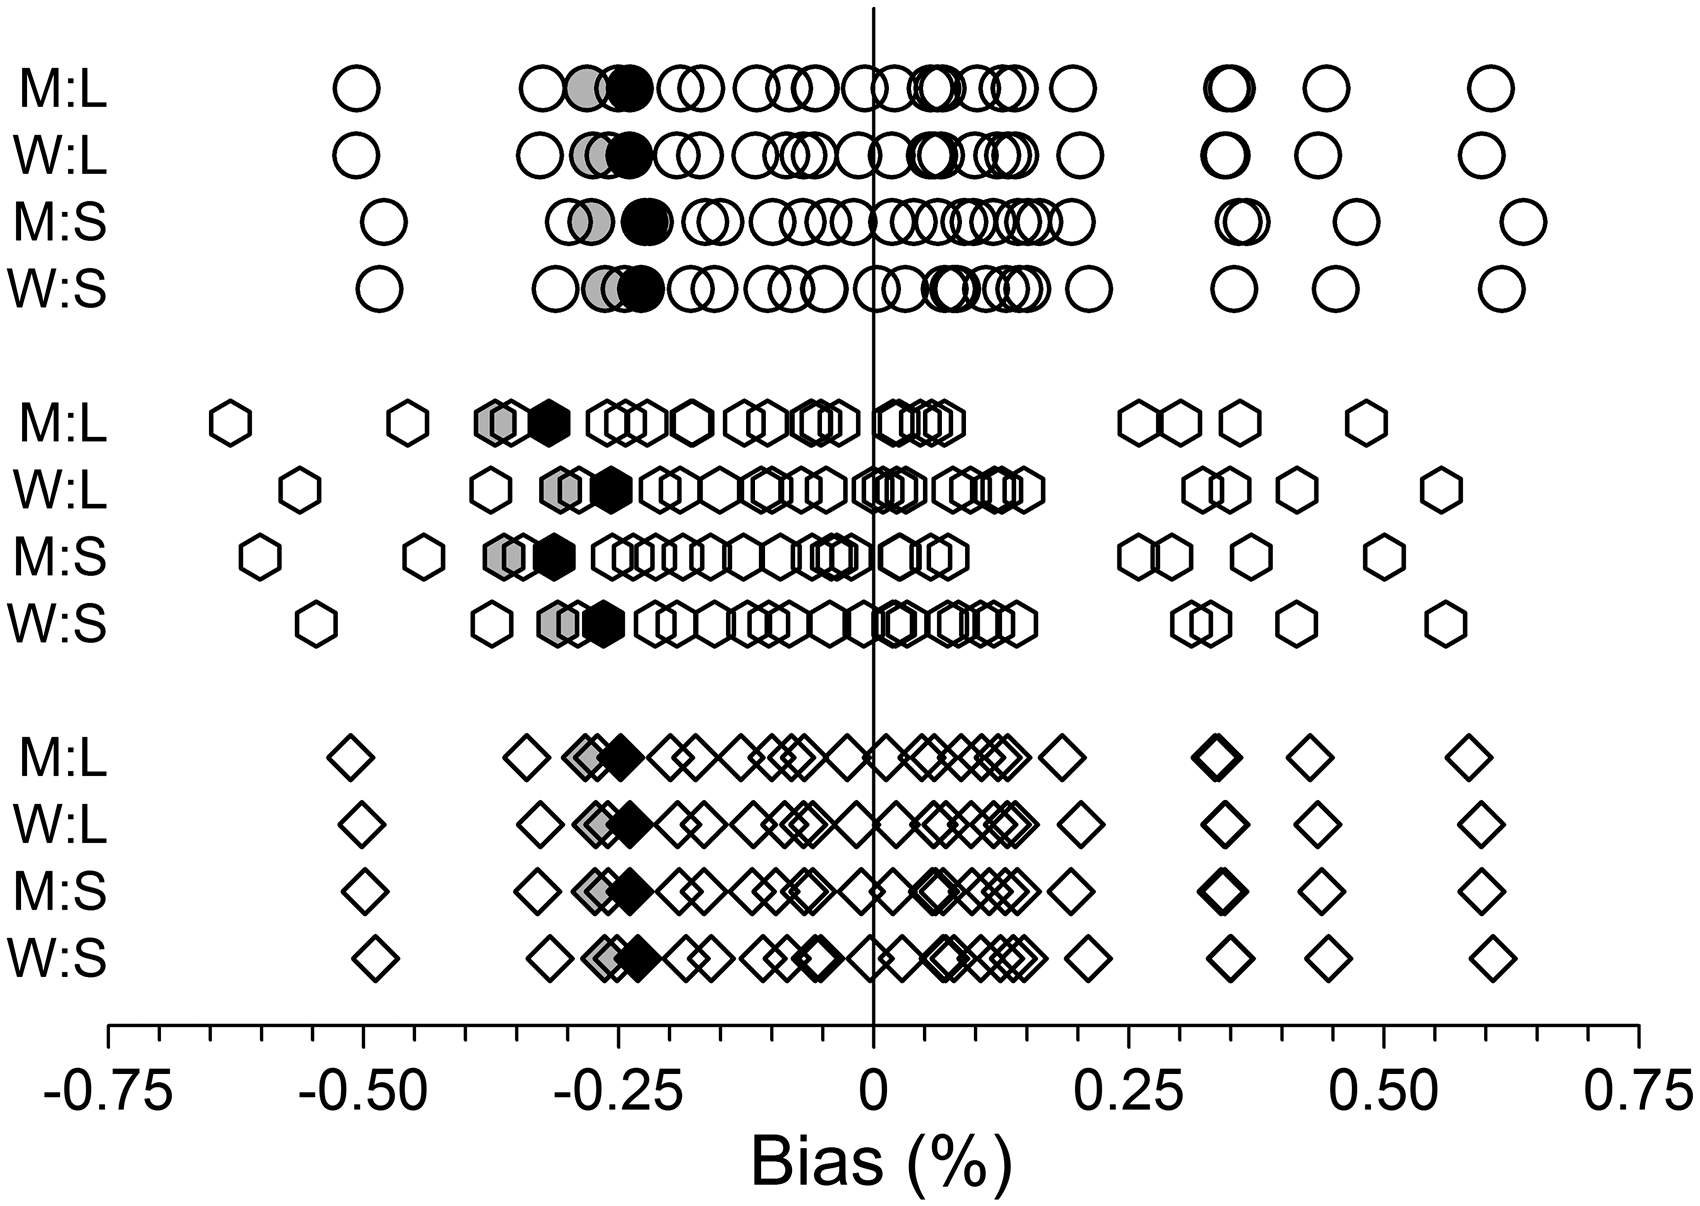
The online supplementary file provides additional results, based on 100-fold more data, which show minimal bias with replication 40 and 20 (bias < |0.1%| throughout) but incontrovertible evidence of small biases with replication 10, 5 and 2 (up to +0.26%, +0.64% and +1.23%, respectively, with the large variance data but <|0.1%|, <+0.1% and <+0.2%, respectively, with the small variance data).
Discussion
Variance function estimation (i.e. regressing variances on mean values) has the particular complication that the mean values (the X-variate) are not error free. At least two approaches have been used to account for uncertainty in the mean values3,4 and both involve considerable computational complexity. However, it is readily shown by analytical argument 5 that even in the case of duplicates (i.e. greatest uncertainty in the mean values) estimation bias should be minimal when measurement errors are small (arguably a prerequisite for any meaningful measurement process). This was independently confirmed with sets of real and simulated duplicates data. 4 High replication data should ensure negligible biases as a matter of course.
Assuming that uncertainty in the mean values is ignored,2,5 the two important factors, degree of replication and size of measurement errors, have not been systematically studied near the detection limit of a measurement system where absolute errors are small, but relative errors are large (coefficient of variation ∼30% by definition). This study provides strong evidence of negligible low-end biases (hence LoB, LoD biases) with data replication ≥20, but, as expected, a marked dependence on measurement error size at lower replication. Biases could reasonably be ignored with small errors and replication as low as five (arguably as low as duplicates). The combination of larger errors (e.g. some immunoassays) and low replication requires either accepting biases of up to +1.25% or evaluating an alternative method.3,4
Footnotes
Declaration of conflicting interests
The author declared no potential conflicts of interest with respect to the research, authorship, and/or publication of this article.
Funding
The author received no financial support for the research, authorship, and/or publication of this article.
Ethical approval
Not applicable.
Guarantor
WAS.
Contributorship
WAS sole author.