
Abstract
Objective:
Circulating tumor DNA is a promising noninvasive tool for cancer monitoring. One of the challenges in applying this tool is the detection of low-frequency mutations. The detection limit of these mutations varies between different molecular methods. The aim of this study is to characterize the factors affecting the limit of detection for epidermal growth factor receptor p.T790M mutation in circulating tumor DNA of patients with lung adenocarcinoma.
Methods:
DNA was extracted from plasma samples of 102 patients. For sequencing the DNA, we used 2 different next-generation sequencing–based platforms: Ion Torrent Personal Genome Machine (56 cases) and Roche/454 (46 cases). Serially diluted synthetic DNA samples carrying the p.T790M mutation were sequenced using the Ion Torrent Personal Genome Machine for validation. Limit of detection was determined through the analysis of non-hot-spot nonreference reads, which were regarded as sequencing artifacts.
Results:
The frequency of the non-hot-spot nonreference reads was higher in Ion Torrent Personal Genome Machine compared to Roche/454 (0.07% ± 0.08% and 0.03% ± 0.06%, respectively, P < .001). We found that different base type substitutions occur with different frequency. Since the base substitution leading to p.T790M mutation is C>T transition, its frequency was used to determine the limit of detection for the assay. Based on the C>T non-hot-spot nonreference allele frequency, we found that the limit of detection is 0.18% in Ion Torrent Personal Genome Machine and 0.1% in Roche/454. Based on these values, 48% and 56% of the cases were positive for T790M mutation in Ion Torrent Personal Genome Machine and Roche/454 groups, respectively. Agreement between duplicates was 76% in Ion Torrent Personal Genome Machine and 72% in Roche/454. Using serially diluted synthetic DNA samples carrying the p.T790M mutation, we could identify mutations with allele frequency of 0.18% or more using the Ion Torrent Personal Genome Machine, supporting our approach to determine the detection limit.
Conclusion:
Both the sequencing platform and the specific nucleotide change affect the limit of detection and should therefore be determined in the validation process of new assays.
Introduction
Adenocarcinoma is the most common type of lung cancer, the leading cause of cancer mortality worldwide. 1 Oncogenic driver mutations in the epidermal growth factor receptor (EGFR) tyrosine kinase are found in 10% to 35% of non-small cell lung cancer. 2 Over 90% of the mutations are located in exon 19 (in-frame deletions) and exon 21 (p.L858R point mutation) of the EGFR gene. 3 Tumors carrying these mutations show good response rates to targeted therapy of first- and second-generation EGFR tyrosine kinase inhibitors (TKIs). 4 Unfortunately, most patients treated with these medications develop resistance, usually within a year of treatment. 5 -7 Several mechanisms of this acquired resistance have been reported, including secondary mutations occurring in the adenosine triphosphate (ATP) binding domain of EGFR, activation of alternative pathways (MET amplification), and activating mutations in the downstream pathways (phosphoinositide 3-kinase, AKT, RAF). 8 The most common resistance mutation involves a cytosine to thymine (C>T) transition within exon 20. The consequence of this mutation is an amino acid substitution in the ATP-binding domain of EGFR at position 790. The small polar amino acid threonine is substituted by methionine, a large nonpolar amino acid (p.T790M). This change causes steric hindrance that reduces the ability of the TKI to bind to the tyrosine kinase domain of EGFR. 9 The p.T790M mutation is found in approximately 60% of patients with acquired resistance to EGFR-TKI. 10 A recent breakthrough in the treatment of EGFR p.T790M mutant cancers was achieved with the development of third-generation EGFR-TKIs. These selective irreversible blockers have shown potent antitumor effects in p.T790M mutation-positive patients with lung cancer who had disease progression during treatment with the first- and second-generation TKIs. 11
The reference standard for assessment of the mutational profile of patients with lung adenocarcinoma, including the p.T790M status, is tissue-based genotyping. Biopsy of tumor tissue provides essential details on the histology and subtype of the tumor, but when it comes to tumor dynamics, it has several limitations. This procedure is highly invasive with potential complications, making serial or multiple biopsies impractical. In addition, the information acquired from a single biopsy does not necessarily reflect the full spatial and temporal complexity of the tumor. 12,13 Hence, tissue biopsies are of limited value for monitoring response, resistance, or recurrence of disease, and alternative tools are needed. A promising method for the assessment of tumor evolution is the analysis of circulating tumor DNA (ctDNA) derived from the blood (“liquid biopsy”). Genotyping of ctDNA provides a broad profile of tumor heterogeneity from different areas of the primary tumor and distant metastasis and also provides noninvasive access to cancer-derived DNA. Additionally, liquid biopsy can be performed multiple times to give multidimensional data regarding recurrence of disease and development of resistance to therapy. 14 Circulating tumor DNA molecules are found at very low concentrations in the blood, making their detection a challenge. Technological advances have overcome this obstacle, and several methods are being used today to identify ctDNA in the plasma. Polymerase chain reaction (PCR)-based techniques, including real-time PCR, droplet digital PCR, and the beads, emulsion, amplification, and magnetics system are relatively easy and inexpensive and enable short turnaround times. 15 However, they can only detect mutations in a limited number of loci, usually within a single gene. Next-generation sequencing (NGS) can overcome this limitation. Next-generation sequencing is a catch-all term used to describe several different massive parallel sequencing technologies. 16 One of the major challenges in applying NGS on ctDNA is to determine the limit of detection, as there is fundamental difficulty in distinguishing the intrinsic background noise (errors) of deep sequencing, caused by PCR and sequencing artifacts, from true low-frequency tumor-associated mutations. 17,18 Despite the obvious benefit for detecting a broad range of mutations, there is a need for accurate determination of the limit of detection for different NGS-based technologies. In the present study, we performed a methodological analysis to characterize the factors that affect the detection limit of the EGFR p.T790M mutation using 2 different NGS-based platforms: Ion Torrent Personal Genome Machine (PGM) and Roche/454.
Materials and Methods
Patients and Plasma Samples
The study cohort included 102 patients with lung adenocarcinoma. All these patients showed evidence of disease progression under treatment with EGFR-TKI therapy. Blood samples were collected as a part of the routine clinical follow-up of these patients. Blood samples were taken in EDTA tubes. Immediately following blood extraction, samples underwent centrifugation for 30 minutes at a speed of 6000g to separate the plasma, in order to avoid lysis of blood cells and sample “contamination” with wild-type (WT) DNA that can hamper diagnosis of low-frequency mutations. This study was approved by the institutional ethical committee.
DNA Extraction From Plasma
For subsequent ion torrent, Ion-Torrent PGM sequencing DNA was extracted from the 1 to 3 mL of plasma using the MagMax Cell Free DNA isolation kit (Life Technologies, St Austin, Texas), according to the manufacturer’s instructions; samples were incubated with magnetic beads for DNA binding, and following several washing and rebinding cycles, cell-free DNA was eluted. DNA concentration was measured using the Qubit Fluorometer (Invitrogen, Carlsbad, California).
For subsequent 454 sequencing, DNA was extracted from 5 mL of plasma using the QIAamp Circulating Nucleic Acid Kit (Qiagen, Hilden, Germany), according to the manufacturer’s instructions. DNA was measured using nanodrop spectrophotometer (Thermo Fisher Scientific, Waltham, Massachusetts).
Mutation Analysis
Mutation analysis was performed using deep sequencing on the ION-TORRENT PGM sequencer platform (Life Technologies, Australia) or the Roche/454 platform (Life Sciences, Branford, Connecticut).
Ion Torrent PGM Sequencing
Cell-free DNA (cfDNA) was PCR amplified using EGFR exon 20-specific primers: forward 5′-CGCCTGCTGGGCATCTGCC-3′ and reverse 5′-TTCCCGGACATAGTCCAGG-3′. Each primer pair was supplemented with Ion-Torrent adapters P1 and A, to allow binding to the ion sphere particles. Additionally, 20 to 30 different forward primers, each with a different barcode, were used for amplification to allow analysis of multiple samples in a single reaction. Amplicons were purified using the Qiagen PCR purification kit (Qiagen) and then sequenced using an Ion 314 chip on the Ion-torrent PGM for 65 cycles. We aimed for ×10 000 to 20 000 ultra-deep coverage to allow identification of low-frequency mutations. Data from the Ion-torrent PGM runs were initially processed using the Ion Torrent platform-specific pipeline software Torrent Suite v1.3.1 to generate sequence reads, trim adapter sequences, filter, and remove poor signal-profile reads. Generated sequence files were aligned to the genomic sequence of EGFR exon 20 and we determined the fraction of reference and nonreference sequences of the gene at the T790 position in each sample using the Integrative Genomic Viewer (IGV 2.3) free software. 19,20
Mutation Analysis on Roche/454 Platform
cfDNA was PCR amplified using EGFR exon 20-specific primers: forward 5′-CCCTCCTTCTGGCCACC-3′ and reverse 5′-CTCTTGCTATCCCAGGAGCGCAGACCGC-3′, using FastStart Taq Polymerase (Roche Diagnostics, Mannheim, Germany). The tails of the primers were the 10 bp multiplex identifiers (MID) (different barcodes), which allow to run different samples together and to analyze multiple samples run together. Amplicons were purified using the Ampure Beads Purification Kit (Beckman Coulter Genomics, Indianapolis, IN). Purified PCR products were run using Bioanalyzer DNA1000 chip (Agilent Technologies, Waldbronn, Germany) to ensure absence of primer dimers and a correct quantification of the molecules taken to the pool for subsequent 454 pyrosequencing. The desired coverage for each amplicon was ×10 000 to 20 000 (for each duplicate) to allow identification of low-frequency mutations. Emulsion PCR was set up and then sequenced using 454 Junior platform (Roche/454 Life Sciences) according to Roche’s protocols. Each sample was run twice, each duplicate was run with a different set of barcode tags, as if it were 2 different samples. Raw data were processed using the 454 AVA software that allows to trim adapter sequences, filter, remove poor signal profile reads, classify the reads according to the barcode to apply it to the specific sample, and align it to the reference genomic sequence of EGFR exon 20. The software shows the coverage of the region and the fraction of the reference and nonreference sequence at the T790 position for each sample for each sequencing direction and combined.
Determining the Detection Limit for Calling EGFR T790M Mutations
The confounding factors for identifying low-frequency mutations with ultra-deep sequencing are the errors introduced during PCR and sequencing. 18 When looking for mutant alleles at very low frequencies, we have to make sure that the alteration we find is a signal representing a real low-frequency mutation and not the result of error. To determine the noise level of our method, we calculated the distribution of non-hot-spot nonreference change in the bases sequenced from each case. Toward this aim, FASTQ files from both platforms were aligned to the human genome using the Burrows-Wheeler Alignment Tool, 21 and VCF files containing the reference and nonreference reads for each base were generated using SAMtools. 22 We assumed that non-hot-spot alterations are most likely sequencing artifacts and not a true mutation, and therefore, these alterations were referred to as background “noise.” An allele frequency of p.T790M that is higher than the 95th percentile background “noise” level was defined as the detection limit of the method (a value higher than 95th percentile in the “hot-spot” position has a chance of less than 5% to be an artifact—P < .05). 23
Validation for Limit of Detection Value
To validate our calculated limit of detection, we performed analysis on serially diluted mutated DNA samples, similar to what was previously reported. 24 Briefly, we purchased two 400 bp synthetic gBlocks (IDT, San Diego, California) that included the coding EGFR exon 20 as well as our PCR amplification primers. One gBlock contained EGFR c.2369C>T mutation, and the other was WT. DNA concentration was measured using the Qubit Fluorometer (Invitrogen, Carlsbad, California), and WT and mutant EGFR gBlocks were mixed to generate different mutation fractions ranging from 0.1% to 2%. The different mixtures served to validate the limit of detection for our method.
Equivalent Nucleotide Changes Nomenclature
Every base substitution on one strand of DNA has an equivalent change on the other strand. For example, A>G substitution on one strand of the DNA is equivalent to T>C substitution in the other strand. Therefore, these are usually coupled together, and when we refer to one nucleotide change in the manuscript, it includes the other one in the couple as well.
Results
Amplification and Sequencing
DNA was successfully extracted from 102 plasma samples of patients with lung adenocarcinoma, previously treated with EGFR-TKIs. All DNA samples were successfully PCR amplified. Fifty-six (55%) and 46 (45%) samples underwent sequencing using the Ion Torrent PGM and Roche/454 platforms, respectively. The average depth of coverage was 11 815 ± 9323 and 7651 ± 5691 for the Ion Torrent PGM and Roche/454 platforms, respectively.
Sequencing Artifacts Analysis
The distribution of the frequency of the total intrinsic noise levels in Ion Torrent PGM and Roche/454 is shown in Figure 1. The intrinsic noise was defined as the non-hot-spot nonreference reads. In the non-hot-spot bases, the frequency of nonreference reads was 0.07% ± 0.08% and 0.03% ± 0.06% (P < .001) for the Ion Torrent PGM and Roche/454 platforms, respectively (Figure 1). The 95th and 99th percentiles were 0.23% and 0.49% for the Ion torrent, respectively, and 0.12% and 0.34% for the Roche/454, respectively.

A, Distribution of the frequency of the total intrinsic noise levels in Ion Torrent Personal Genome Machine (PGM) and Roche/454. The intrinsic noise was defined as the non-hot-spot nonreference reads. B, The average of the total noise in Ion Torrent PGM and Roche/454. The Ion Torrent showed higher average of noise compared to the Roche/454.
Analysis of specific base pair change showed similar pattern in both methods. The substitution types that were common in Roche/454 platform were also common in Ion-torrent PGM. A>G was the most common alteration in both methods (Figure 2). As the mutation leading to p.T790M is a C>T transition, we also calculated the non-hot-spot nonreference allele frequency for this alteration, which was 0.06% ± 0.09% and 0.03% ± 0.08% for the Ion-torrent PGM and Roche/454 platforms, respectively (Figure 3). The 95th and 99th percentile for C>T were 0.18% and 0.37% for the Ion Torrent PGM, respectively, and 0.1% and 0.35% for the Roche/454, respectively. Based on this value, the limit of detection was determined as 0.18% and 0.1% for Ion torrent and 454 platforms, respectively.

Frequency of specific nucleotide changes in the next-generation sequencing (NGS) platforms. Both methods showed similar distribution of mutation types. The substitution types that were common in Roche/454 platform were also common in Ion Torrent Personal Genome Machine (PGM). The most common specific base change in the intrinsic noise was A>G found in more than 50% of the reads on both platforms.

C>T substitution non-hot-spot nonreference allele frequency. C>T substitution is the mutation leading to p.T790M mutation. The limit of detection for this mutation was defined as the 95th percentile of sequencing artifacts, which was 0.1% in 454 and 0.18% in Ion Torrent. Changes in the hot spot of T790M mutation with frequencies higher than this value were defined as true-positive tumor mutations. The 99th percentile was 0.37% in Ion Torrent and 0.35% in 454, respectively.
Using a set of serially diluted synthetic DNA samples carrying the T790M mutation, we could identify mutations with allele frequency of 0.18% or more using the Ion-torrent PGM system, supporting our approach to determine the limit of detection (Figure 4). Distribution of the frequency of the total noise level in synthetic DNA sequences is shown in Figure 5. Analysis of this total noise reveals higher levels of noise than those found in sequences of the DNA samples derived from plasma samples of patients (Figure 5). Based on the limit of detection for each sequencing method, we could define p.T790M mutation in plasma-derived DNA samples. Using these cutoffs, 27 (48%) of 56 and 26 (56%) of 46 carried the mutation, which is the expected rate of p.T790M mutations in patients developing resistance to TKIs. 10,11 Duplicate runs were available for 34 cases in the Ion Torrent samples and 43 cases in the Roche/454 samples. Agreement between duplicates was 76% and 72% for the Ion-torrent PGM and Roche/454 platforms, respectively. We also calculated the 99th percentile for non-hot-spot nonreference allele frequency for both systems (equivalent to P value of .01). Using the 99th percentile cutoffs, the rate of positive cases was 36% and 26% for the Ion Torrent PGM and Roche/454, respectively. The rate of agreement between duplicates was slightly improved to 82% and 81% in the Ion Torrent samples and the 454 samples, respectively (Figure 6).
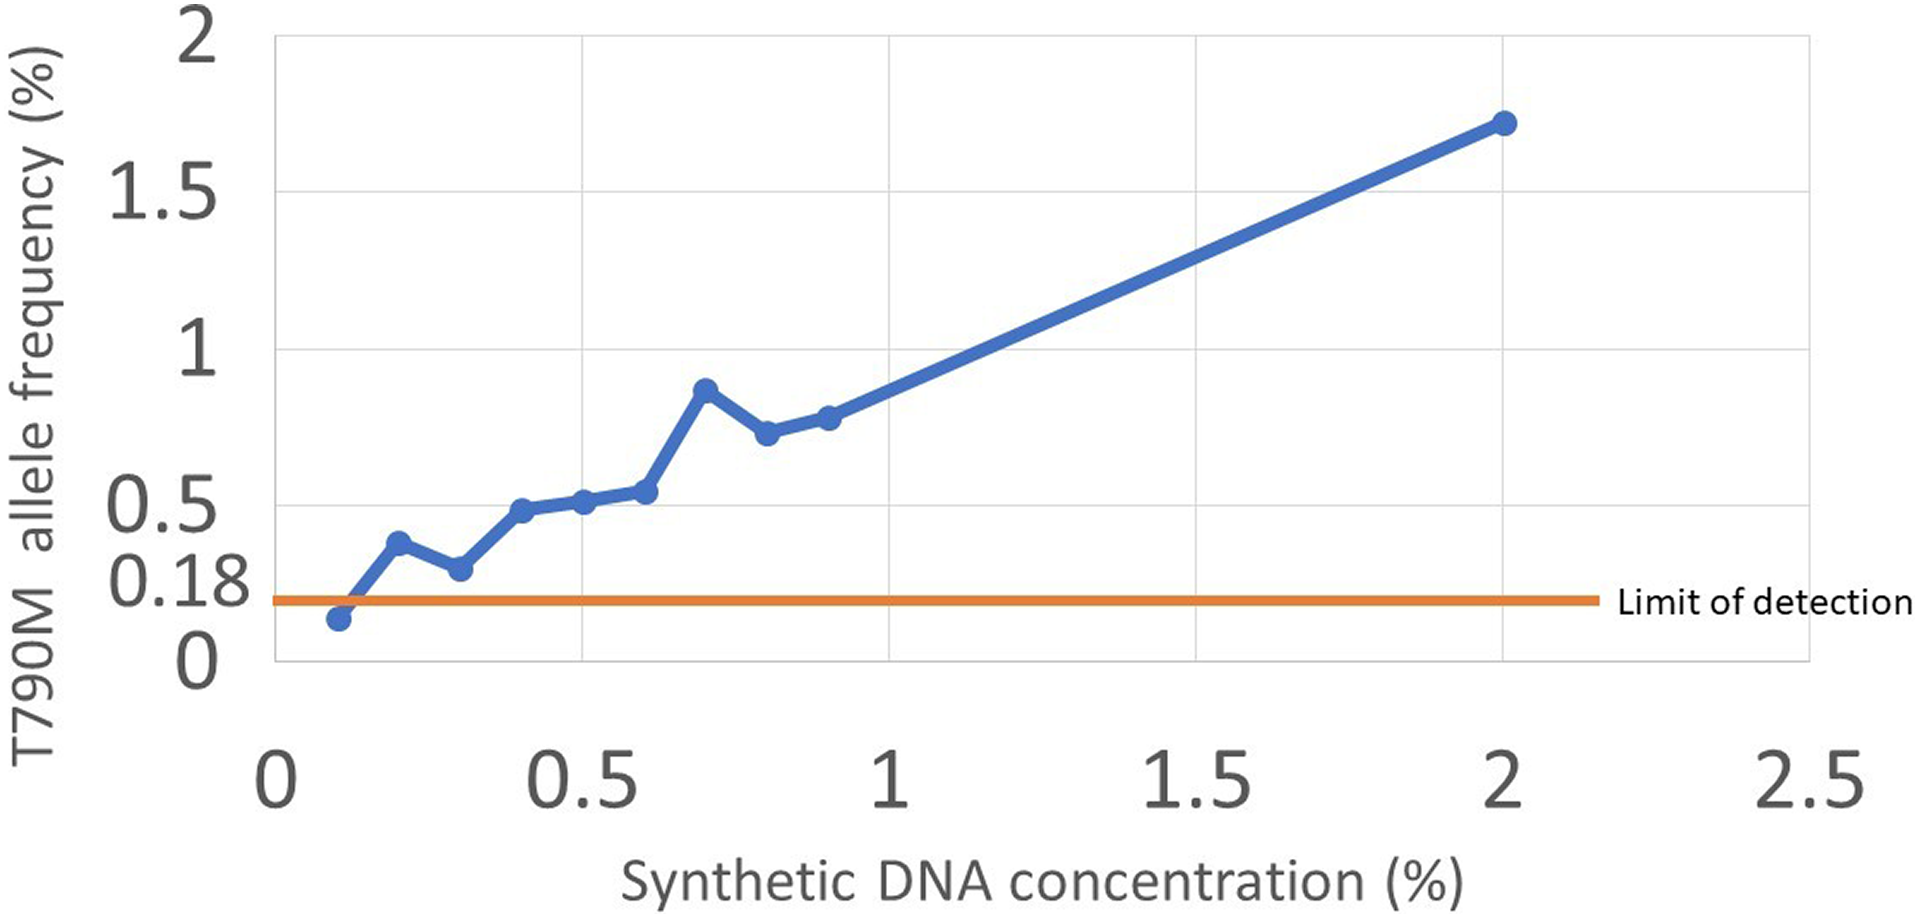
T790M mutation frequency in the synthetic DNA samples. Serially diluted synthetic DNA was sequenced with the Ion Torrent Personal Genome Machine (PGM), and we could identify mutations with allele frequencies higher than 0.18%, the limit of detection for the Ion Torrent PGM.
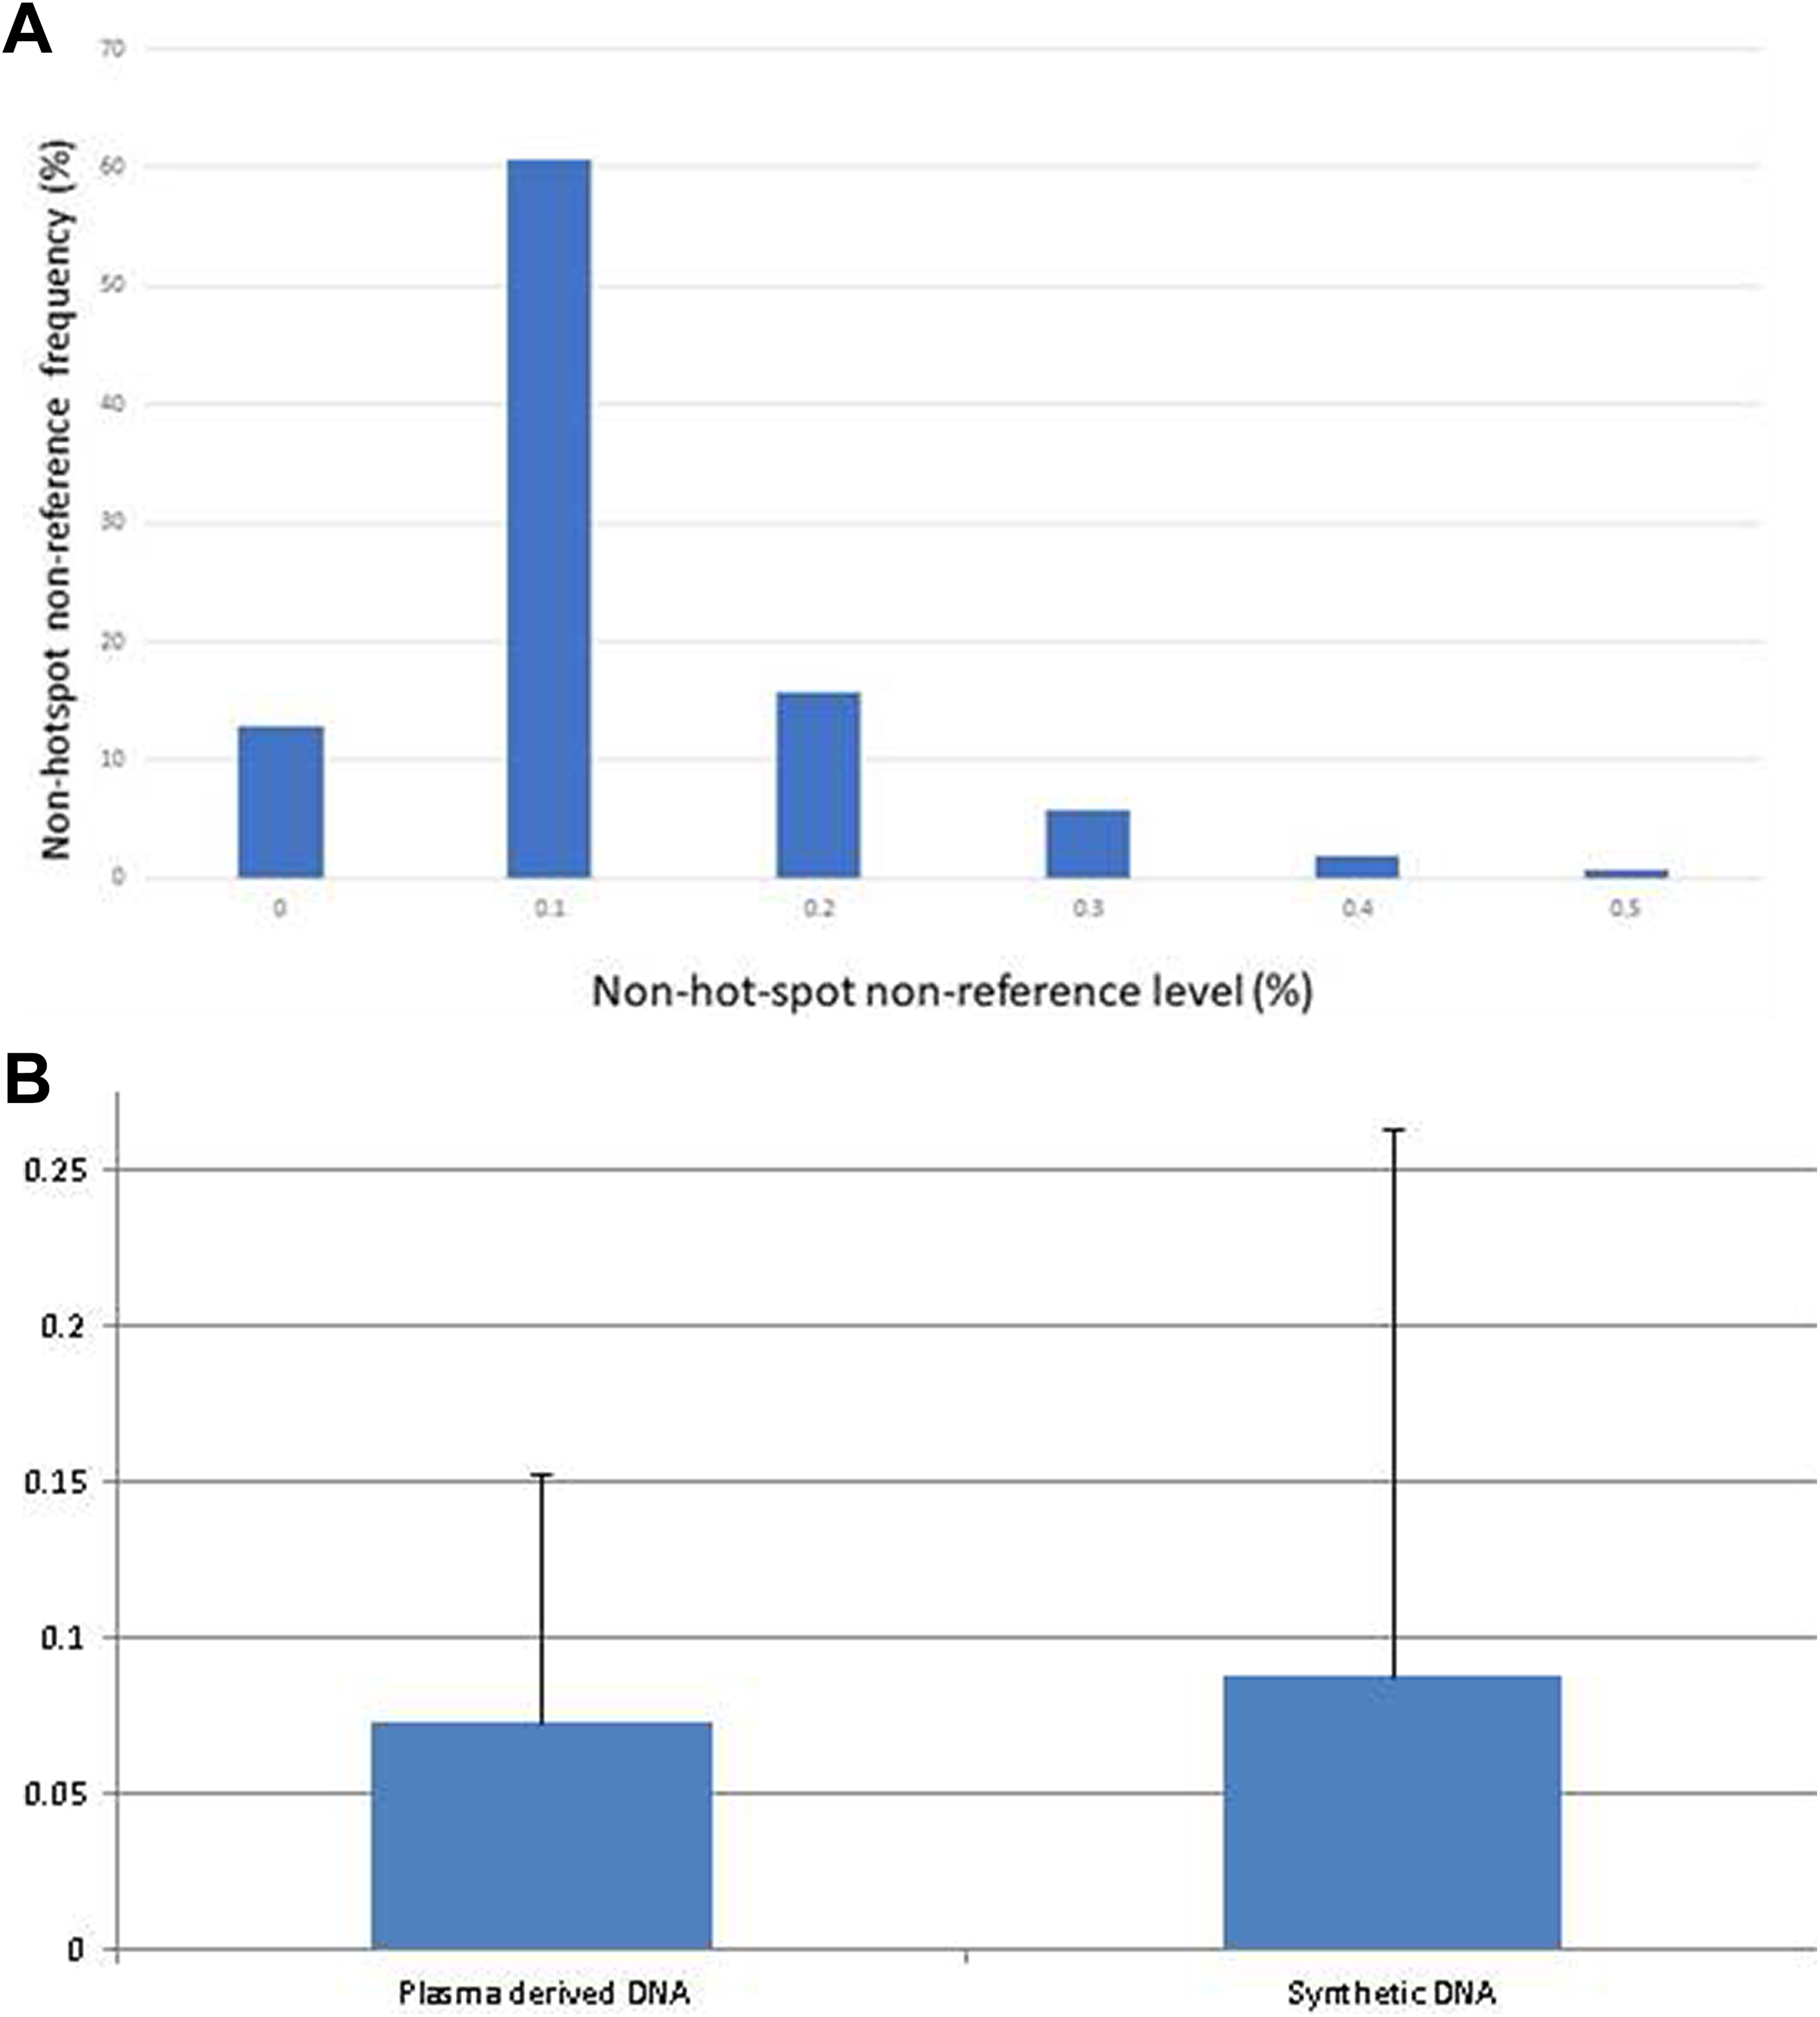
A, Distribution of the calculated intrinsic noise level in synthetic DNA. Synthetic DNA samples carrying p.T790M mutation were serially diluted in wild-type DNA to concentrations of 0.1% to 2% and sequenced on the Ion Torrent platform. B, The average of the total noise in the synthetic DNA samples compared to the average of noise in the plasma-derived DNA samples sequenced using the Ion Torrent PGM. The average level of noise was 0.08% higher than the average level of the noise in the plasma-derived DNA samples that were sequenced using the Ion-Torrent PGM (0.07%).

Agreement between duplicates using the 95th and 99th percentile cutoffs. In both platforms, the 99th percentile cutoff was associated with higher levels of agreement. The agreements were 76% and 72% for the Ion-Torrent and 454 platforms with the 95th percentile cutoff, respectively, and over 80% for both platforms using the 99th percentile cutoff.
We hypothesized that low DNA concentration might be more susceptible for PCR artifacts. However, analysis of non-hot-spot nonreference sequences in the low and high DNA concentrations showed an average allele frequency of 0.046% and 0.044%, respectively. This suggests that low DNA concentration is not associated with significant increase in sequencing artifacts. In addition, there was no significant difference between the levels of agreement between duplicates in low and high concentrations of DNA.
Discussion
In this study, we found that different NGS-based technologies have different limits of detection for identifying EGFR p.T790M mutation in ctDNA and different intrinsic noise levels. Several factors could explain this difference. There are several massively parallel sequencing methods, which are based on different technologies. The Ion Torrent method is based on the detection of hydrogen ions released during DNA synthesis. The 454 uses pyrosequencing based on fluorescent detection of pyrophosphate released during DNA polymerization. Hence, NGS should not be referred to as one technology, as it encompasses different methodologies, each with different artifact noise levels, and different limits of detection for mutations. In the present study, we compared 2 specific methods for sequencing, but our message regarding the effect of sequencing platform on the limit of detection applies for other sequencing platforms as well. Additional analysis of other sequencing platforms such as Illumina MiSeq platform could further establish the effect of sequencing platform on the limit of detection.
Previous studies support our results indicating different limits of detection for different sequencing technologies. 25 -29 Additionally, the application of molecular tagging of the DNA molecules can significantly reduce artifact level and improve the limit of detection. For example, Forshew et al 25 could reach a limit of detection of 0.2% using this approach, whereas Newman et al 26 could identify mutations with allele frequency of as little as 0.02%. Alternatively, PCR-based methods were reported with a limit of detection of at least 0.1% 29 ; however, these types of methods require a specific assay for each mutation. This variability in the values of the limits of detection reflects the lack of standardization and the need for methodological approaches to define a limit of detection that is specific for each technology and each mutation. Moreover, the artifact level is different for different base pair changes. Therefore, when calculating the limit of detection for a specific mutation, attention should be given to the exact base pair change.
When determining the limit of detection for a specific assay, one should also make sure that the samples used for the validation are equivalent to the clinical samples for which the assay is being designed. In the present work, we found that synthetic DNA had higher level of sequencing artifacts compared to plasma-derived ctDNA samples. This might suggest that serially diluted synthetic DNA might not be the ideal tool for determining the limit of detection. Additionally, serial dilution of cell lines harboring a specific mutation is not necessarily the best tool for determining the limit of detection since the DNA extracted from cell lines is less fragmented and of higher quality.
Another important factor that underlies the limit of detection for ctDNA might be the number of the molecules present. 30 The agreement rates we found in duplicates were above 70%. A potential cause for disagreement between duplicates could be low DNA concentration. This could lead to false-positive results due to overrepresentation of sequencing artifacts. Alternatively, this could lead to false-negative results if mutant DNA molecules are at a very low frequency and present at detectable frequencies within one PCR reaction but not within the other. In the present work, we did not find increased level of sequencing artifacts in the samples with lower DNA concentration. Additionally, the rate of disagreement between PCR duplicates was not significantly different between the low and high DNA concentration samples. Of note, the number of samples with duplicates and available DNA concentration data were relatively small, and the effect of low concentration DNA on the limit of detection should be further analyzed in larger cohorts.
In summary, deep sequencing methods can be applied to identify low-frequency point mutations in ctDNA. Several factors underlie the limit of detection for each method, including the sequencing platform and the specific nucleotide change. Therefore, the definition of the detection limit should be specific for the method used and the mutations to be detected.
Footnotes
Declaration of Conflicting Interests
The author(s) declared no potential conflicts of interest with respect to the research, authorship, and/or publication of this article.
Funding
The author(s) received no financial support for the research, authorship, and/or publication of this article.