
Abstract
Background
Recently developed reagents for the highly sensitive measurement of cardiac troponin I are useful for early diagnosis of acute coronary syndrome. However, differences in measured values between these new reagents and previously used reagents have not been well studied. In this study, we aimed to compare the values between ARCHITECT High-Sensitive Troponin I ST (newly developed reagents), ARCHITECT Troponin I ST and STACIA CLEIA cardiac troponin I (two previously developed reagent kits).
Methods
Gel filtration high-performance liquid chromatography was used to analyse the causes of differences in measured values.
Results
The measured values differed between ARCHITECT High-Sensitive Troponin I ST and STACIA CLEIA cardiac troponin I reagents (r = 0.82). Cross-reactivity tests using plasma with added skeletal-muscle troponin I resulted in higher reactivity (2.17–3.03%) for the STACIA CLEIA cardiac troponin I reagents compared with that for the ARCHITECT High-Sensitive Troponin I ST reagents (less than 0.014%). In addition, analysis of three representative samples using gel filtration high-performance liquid chromatography revealed reagent-specific differences in the reactivity against each cardiac troponin I complex; this could explain the differences in values observed for some of the samples.
Conclusion
The newly developed ARCHITECT High-Sensitive Troponin I ST reagents were not affected by the presence of skeletal-muscle troponin I in the blood and may be useful for routine examinations.
Introduction
Troponin I (TnI), a subunit found in the troponin complex, plays an important role in the regulation of muscle contraction in cooperation with Troponin T (TnT) and Troponin C (TnC). 1 TnI has cardiac and skeletal-muscle isoforms.2–4 Cardiac troponin I (cTnI) in the peripheral blood exists in its free for or in a complex with TnT and TnC. 5 However, differences in the reactivity with the cTnI complex among the various reagent kits have not been clarified. Early stages of myocardial damage can be diagnosed by increased concentrations of cTnI in the blood; cTnI is released following myocardial cell injury and can be detected using specific monoclonal antibodies.6,7 Guidelines for the management of acute coronary syndrome without persistent ST segment elevation in electrocardiogram (published by the Japanese Circulation Society [JCS], revised in 2007)8 suggest that measurement of cTnI is useful for diagnosis and prognostic evaluation of acute coronary syndrome. In addition, the Global Task Force 9 comprised the European Society of Cardiology, the American College of Cardiology Foundation, the American Heart Association, and the World Heart Federation suggested that measurement of cTnI can be used as a biomarker for the diagnosis of myocardial infarction.
For accuracy and specificity of cTnI concentrations, reagents are recommended to have less than 10% coefficients of variation (CVs) at the given cut-off value (the 99th percentile of a normal reference population). 8 We previously reported that the CVs around the cut-off value were not sufficient for fundamental studies when using the ARCHITECT Troponin I ST (Ar-cTnI) reagents. 10 Therefore, in order to overcome this issue, highly sensitive cTnI assays reagents (i.e. ARCHITECT Highly Sensitive Troponin I ST [Ar-hs-cTnI] reagents) have recently been developed. However, the differences in measured values between newly developed reagent systems and previously used reagents have not been well studied.
In the present study, we evaluated the differences in cTnI values obtained for previously used reagents (i.e. Ar-cTnI and STACIA chemiluminescent enzyme immunoassays [CLEIA] cTnI [St-cTnI]) and newly developed reagents (i.e. Ar-hs-cTnI). Furthermore, to clarify the source of these discrepancies, we analysed the cross-reactivity with skeletal-muscle TnI (sTnI) and the differences in reactivity with the cTnI complex.
Materials and methods
Samples
Peripheral blood samples collected with heparin lithium were obtained from outpatients and patients admitted to Sapporo Medical University Hospital. Plasma samples were prepared from these peripheral blood samples using standard methods. Samples were stored at −80℃ and used only once within one month. All samples were anonymously handled to protect the personal information of each patient.
Reagents and instruments
cTnI concentrations in plasma samples were measured using Ar-hs-cTnI reagents (Abbott Japan, Tokyo, Japan), and measured values were analysed using an ARCHITECT i2000 SR immunoassay analyzer (Abbott Japan). The basic performance of these reagents was compared with those of Ar-cTnI (Abbott Japan) and St-cTnI (LSI Medience, Tokyo, Japan), which were analysed using the ARCHITECT i2000 SR immunoassay analyzer (Abbott Japan) and STACIA (LSI Medience). Statistical analysis and calculations were done using Microsoft Office Excel 2007.
Plasma concentrations of cTnI for Ar-hs-cTnI and Ar-cTnI were measured using chemiluminescent immunoassays. Briefly, cTnI in the samples was reacted with mouse monoclonal anti-cTnI antibodies bound to magnetic beads. Reacted samples were washed and separated into bound and free fractions (B/F separation). The mixture was then reacted with acridinium-labelled mouse-human chimera monoclonal anti-cTnI antibodies and subjected to B/F separation again. Next, pretrigger and trigger reagents were added to the samples, and cTnI concentrations were obtained from the detected chemiluminescence intensity. Plasma concentrations of cTnI for St-cTnI were measured using CLEIA.
Precision study
The CVs of within-run precision were calculated 20 times using three pooled plasma samples at different concentrations. The CVs of between-day precision were calculated for 20 days using three pool plasma samples at different concentrations.
Cross-reactivity of sTnI
Recombinant human sTnI (catalog no.: 8T25; HyTest, Turku, Finland) was added to the control samples at low or high concentrations or to plasma samples from patients at a final concentration of 1000 pg/mL. cTnI concentrations for each condition were then measured, and cross-reactivity with sTnI was calculated by comparisons with blank samples.
Gel filtration high-performance liquid chromatography
The plasma samples were analysed by size-exclusion high-performance liquid chromatography (HPLC) using a TSKgel G2000SWXL column (7.8 mm i.d. × 30 cm; Tosoh Corporation, Tokyo, Japan) connected with a TSKgel Guardcolumn SWXL (6.0 mm i.d. × 4 cm; Tosoh Corporation) at a flow rate of 0.5 mL/min on an LC-20 A HPLC system (Shimadzu Corporation). Next, 50 mM sodium phosphate buffer containing 0.15 M NaCl (pH 7.0) was used as an elution buffer. Aliquots (80 or 100 μL) of the samples were automatically injected onto the column, and eluted fractions (0.5 mL each) were collected.
Reactivity with the cTnI complex
Three discordant samples having high cTnI concentrations and sufficient volume were used. The cTnI concentration in each elution fraction was measured, and elution times estimated from the molecular weight of each complex were calculated. Elution fractions were grouped as free cTnI; complexes of cTnI and TnC (cTnI-C); complexes of cTnI, TnC and TnT (cTnI-C-T) and multimers of these complexes (Multi).
Ethical considerations
The details of this research project were approved the Review Board in Sapporo Medical University Hospital (http://web.sapmed.ac.jp/byoin/chiken/irb.html; nos. 272-68).
Results
Basic performance of Ar-hs-cTnI
Before comparing the measured values among different reagents, we first confirmed the basic performance. The CVs of within-run precision were 2.1–4.6% for Ar-hs-cTnI, 2.7–5.4% for Ar-cTnI and 1.7–14.1% for St-cTnI. The CVs of between-day precision were 2.2–5.8% for Ar-hs-cTnI, 1.5–9.4% for Ar-cTnI and 4.4–7.4% for St-cTnI (raw data not shown). The linearity of measured values using serially diluted samples was confirmed until the level reached the upper detection limit (Ar-hs-cTnI; 45,321 pg/mL, Ar-cTnI; 41,449 pg/mL St-cTnI; 55,945 pg/mL). No prozone phenomenon was observed until 273,947 pg/mL for Ar-hs-cTnI, 324,010 pg/mL for Ar-cTnI and 232,945 pg/mL for St-cTnI, and there was no interference from substances such as free bilirubin, conjugated bilirubin, chyle, haemoglobin and rheumatoid factor (data not shown).
We then measured cTnI concentrations of serially diluted samples in duplicate for five days and calculated the limit of detection (LOD) in accordance with the method described by the Quality Management Committee of the Japanese Society of Clinical Chemistry.
11
The LODs of the reagents were 0.7 pg/mL for Ar-hs-cTnI, 9.1 pg/mL for Ar-cTnI and 1.8 pg/mL for St-cTnI. To further confirm the high sensitivity of Ar-hs-cTnI, we examined the limit of quantification (LOQ) for the samples. Low-concentration samples were analysed in duplicate for five days, and precision profiles were obtained (Figure 1). The concentration at CVs of 10% was calculated from the regression equations. The LOQs of the reagents were 4.4 pg/mL for Ar-hs-cTnI, 51.8 pg/mL for Ar-cTnI and 11.9 pg/mL for St-cTnI, indicating that Ar-hs-cTnI exhibited the highest sensitivity of all the reagents tested in this study.
Analysis curve for determination of the limit of quantification (LOQ). Twenty low-concentration samples were measured in duplicate for five days, and the average value for each sample on each day was used for the calculation of the CV. Precision profiles for each reagent were obtained, and the concentration at a CV of 10% was calculated from the regression equation.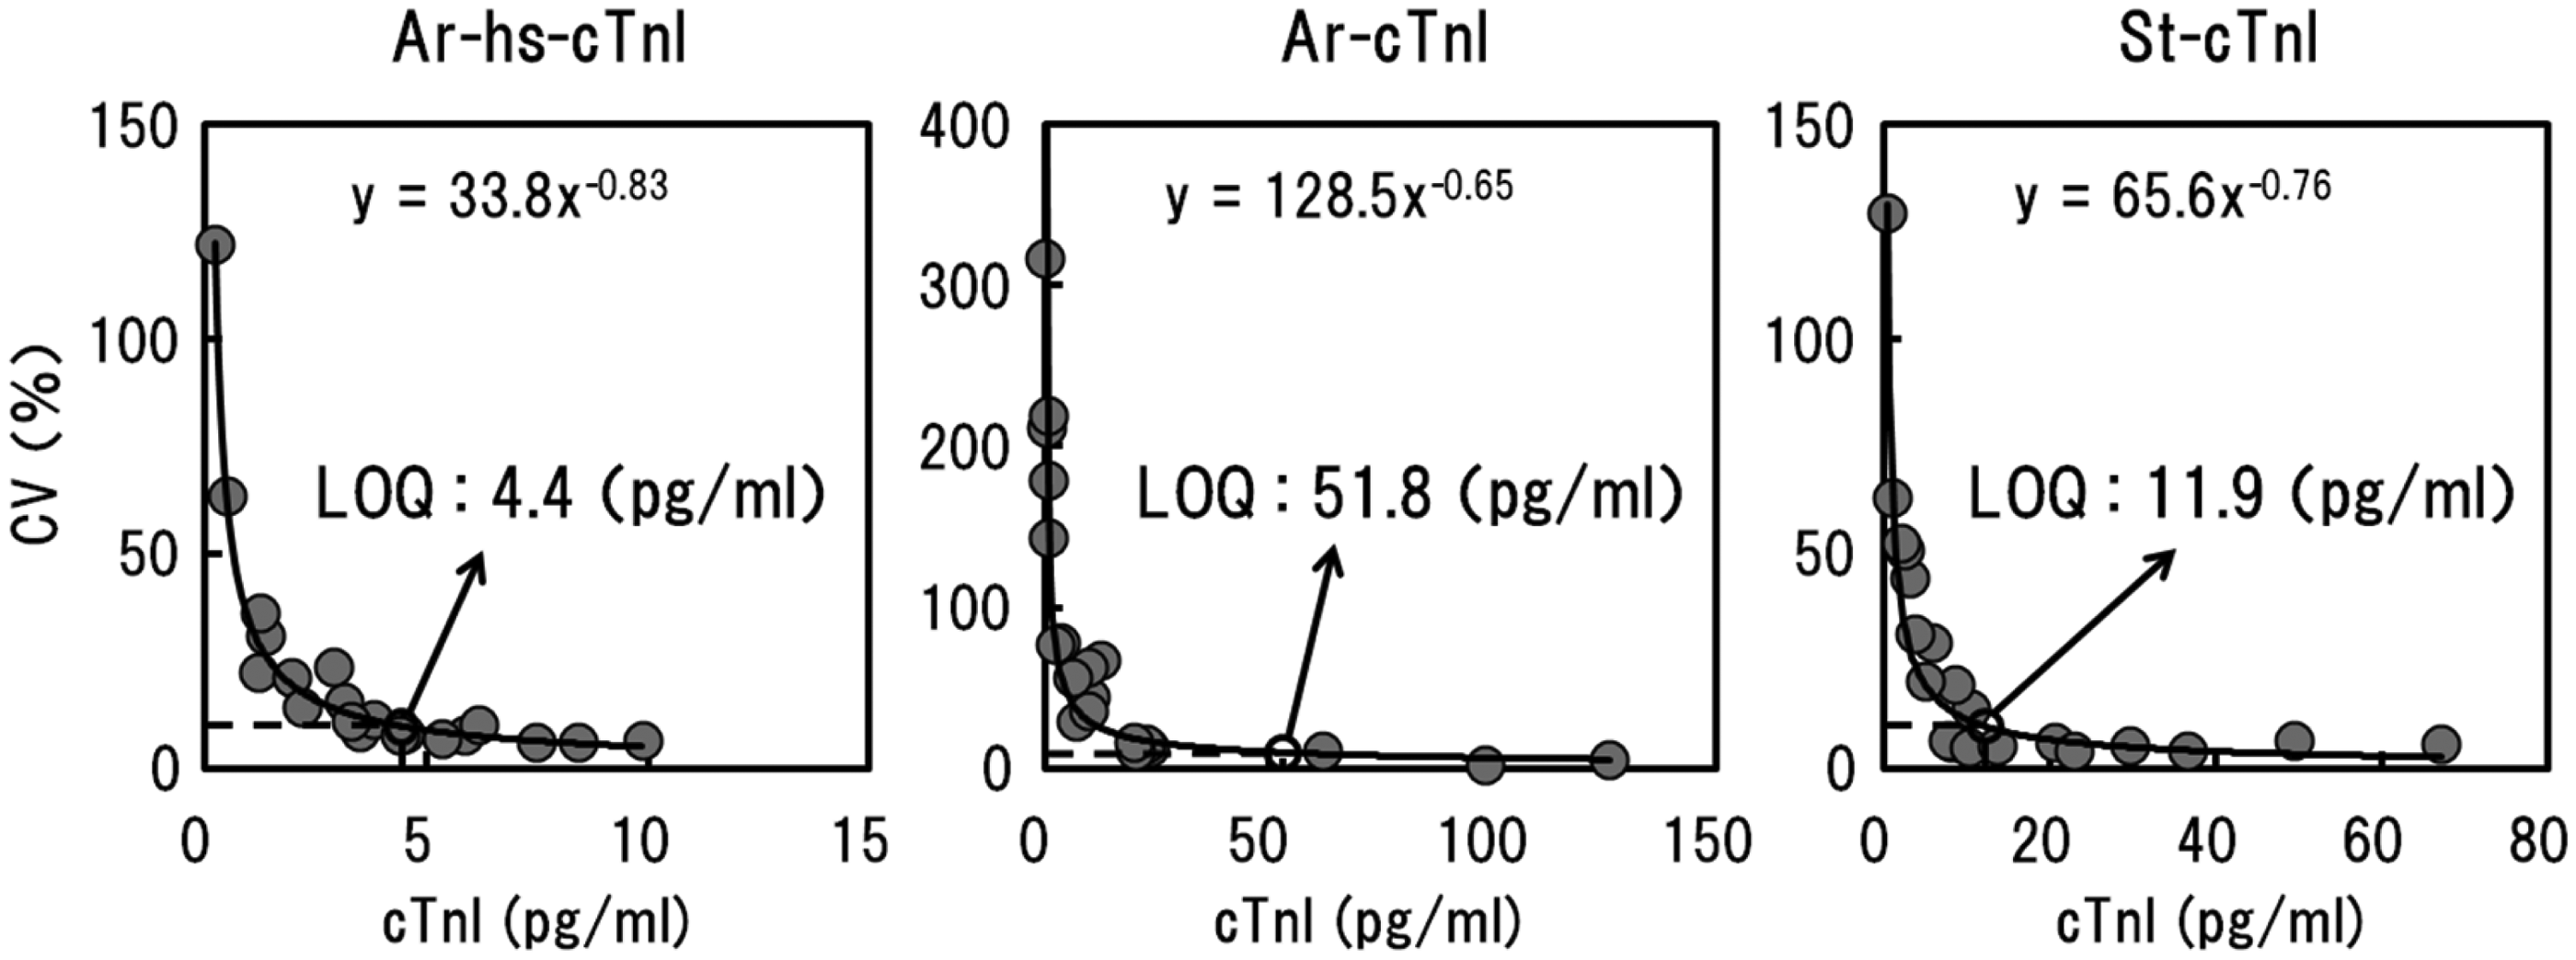
Correlation among reagents
We next examined the correlations among measured values for Ar-hs-cTnI and Ar-cTnI or St-cTnI using plasma samples from 106 patients (Figure 2(a)). Strong correlations were observed between Ar-hs-cTnI and Ar-cTnI (r = 0.91). However, the correlation between Ar-hs-cTnI and St-cTnI was relatively low (r = 0.82). This low correlation was more apparent when samples with 1000 pg/mL of the target were compared (Figure 2(b)). Under these conditions, the correlation between Ar-hs-cTnI and St-cTnI was decreased (r = 0.64), although the correlation between Ar-hs-cTnI and Ar-cTnI remained strong (r = 0.95).
Correlation of measured values between Ar-hs-cTnI and Ar-cTnI or St-cTnI using plasma samples from 106 patients. (a) Overall plots and (b) plots for 1000 pg/mL.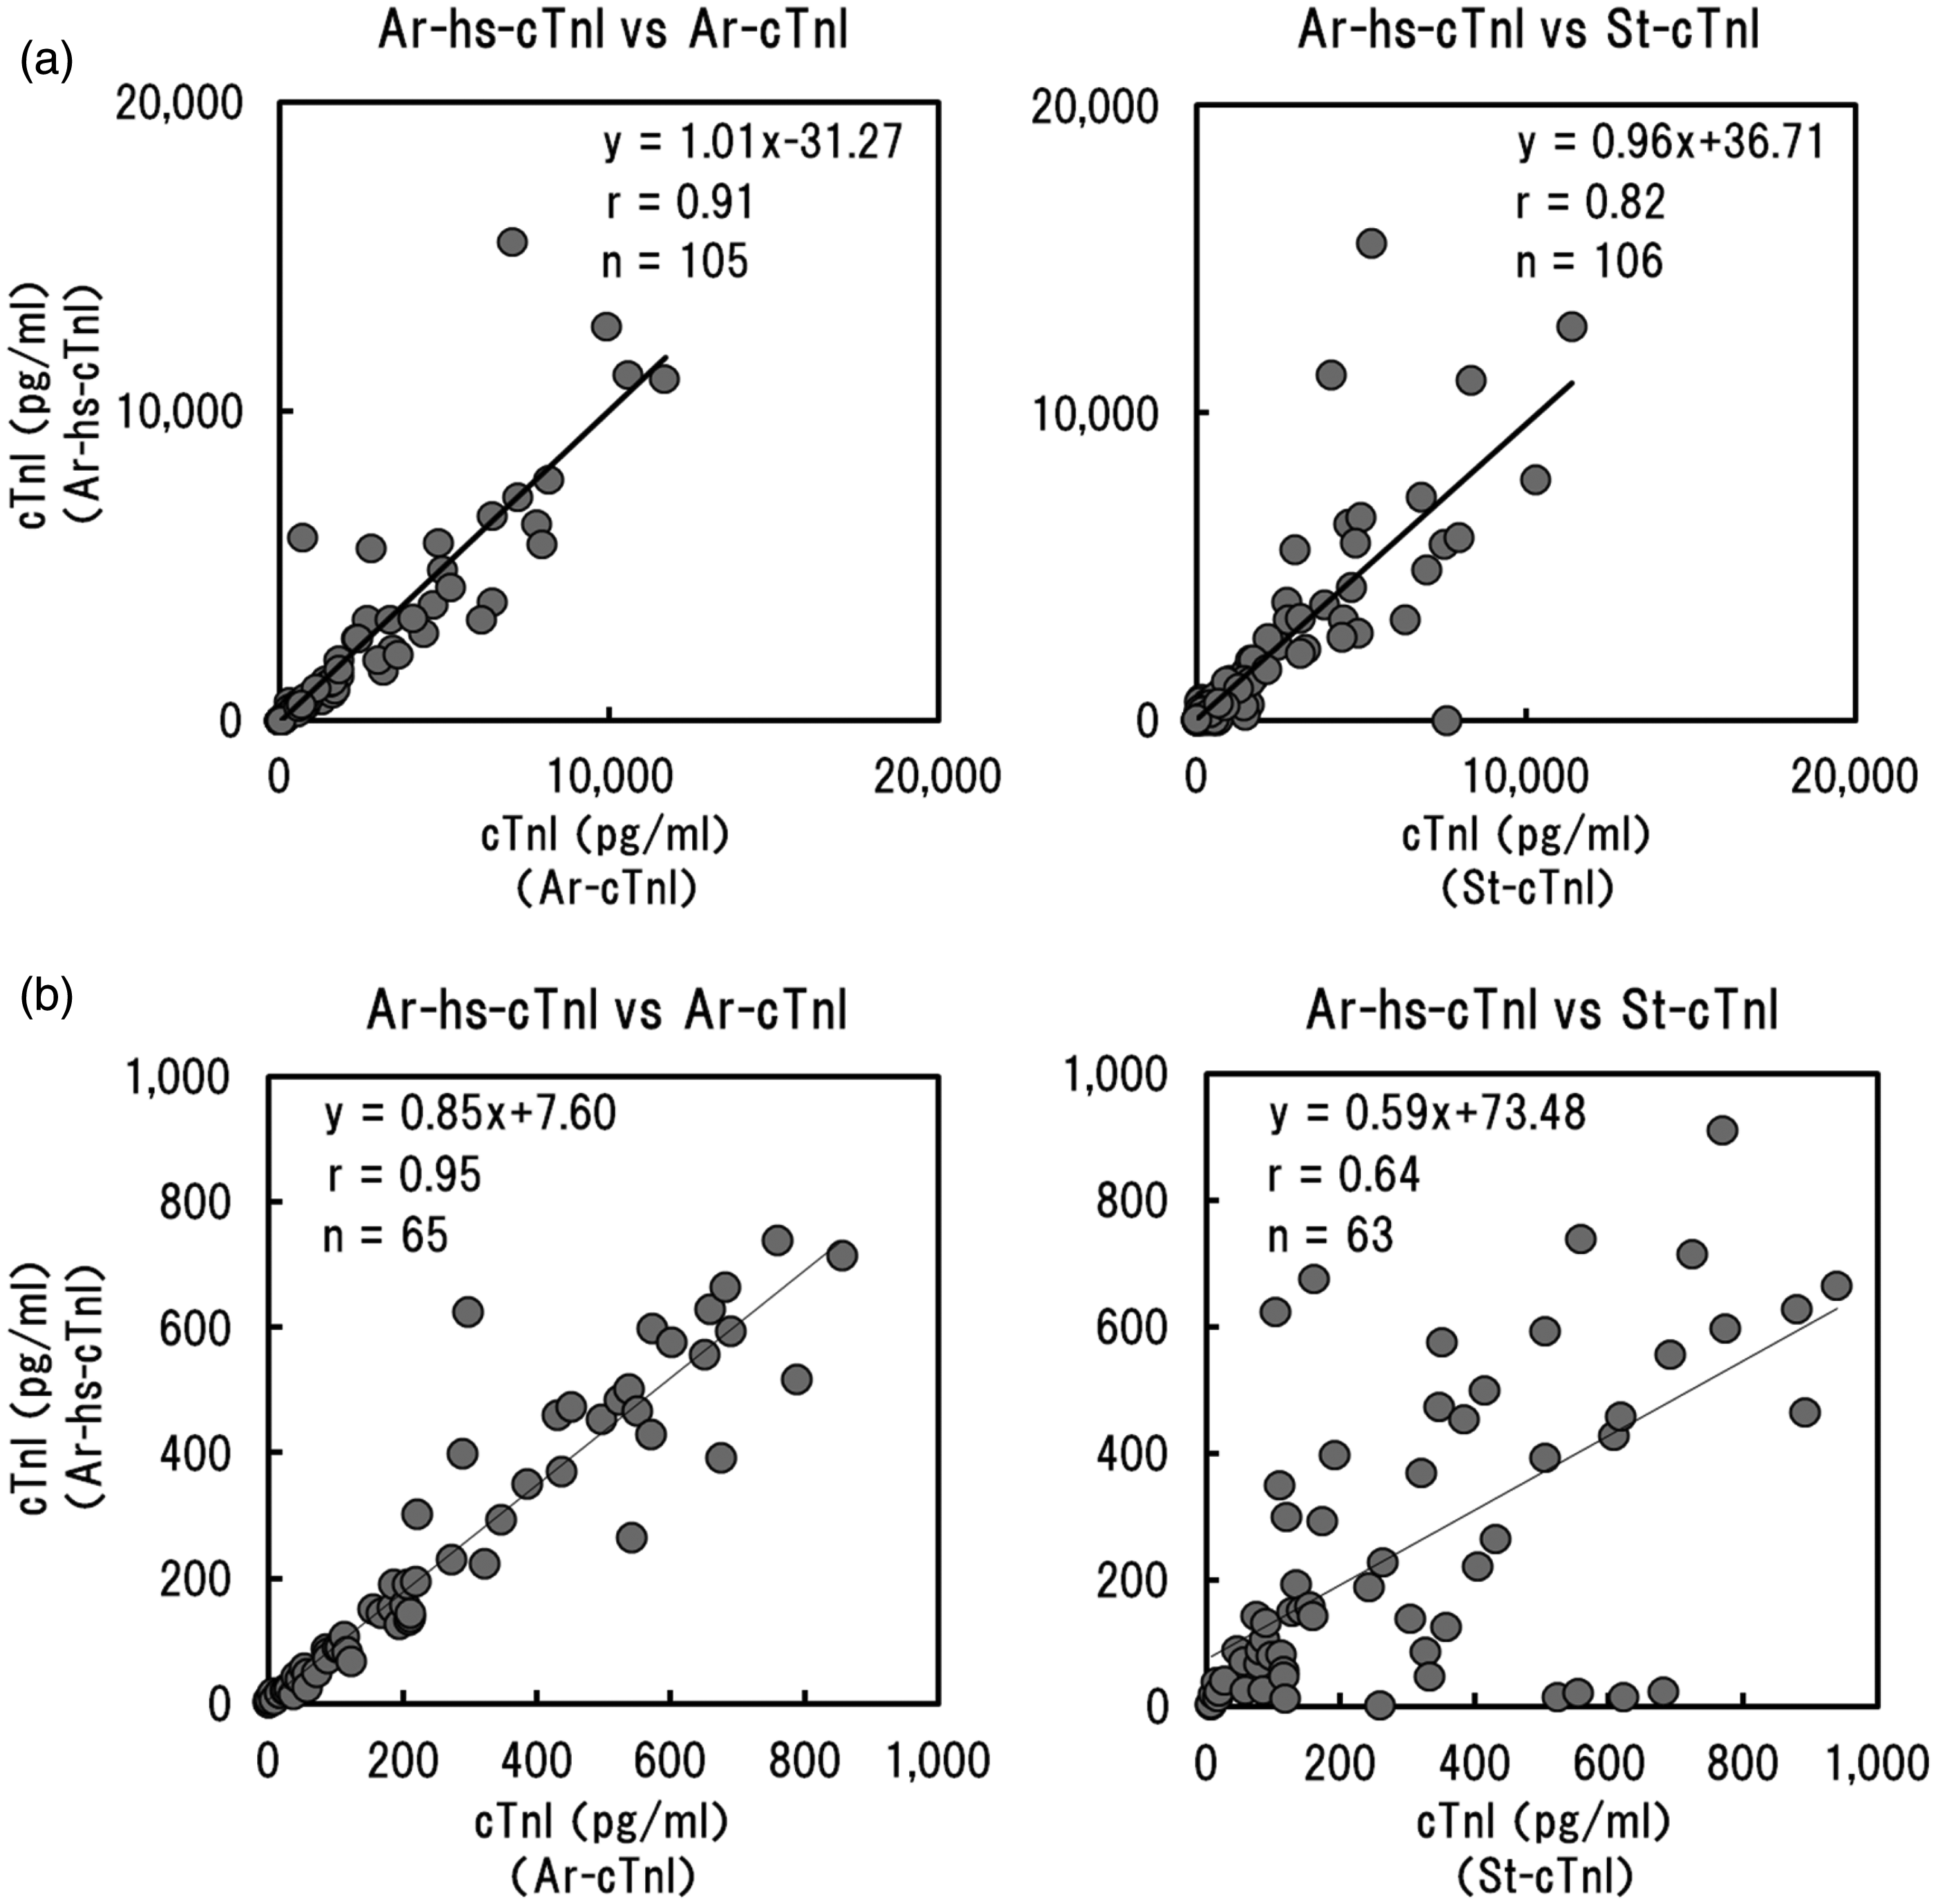
Cross-reactivity of sTnI
Cross-reactivity of sTnI.
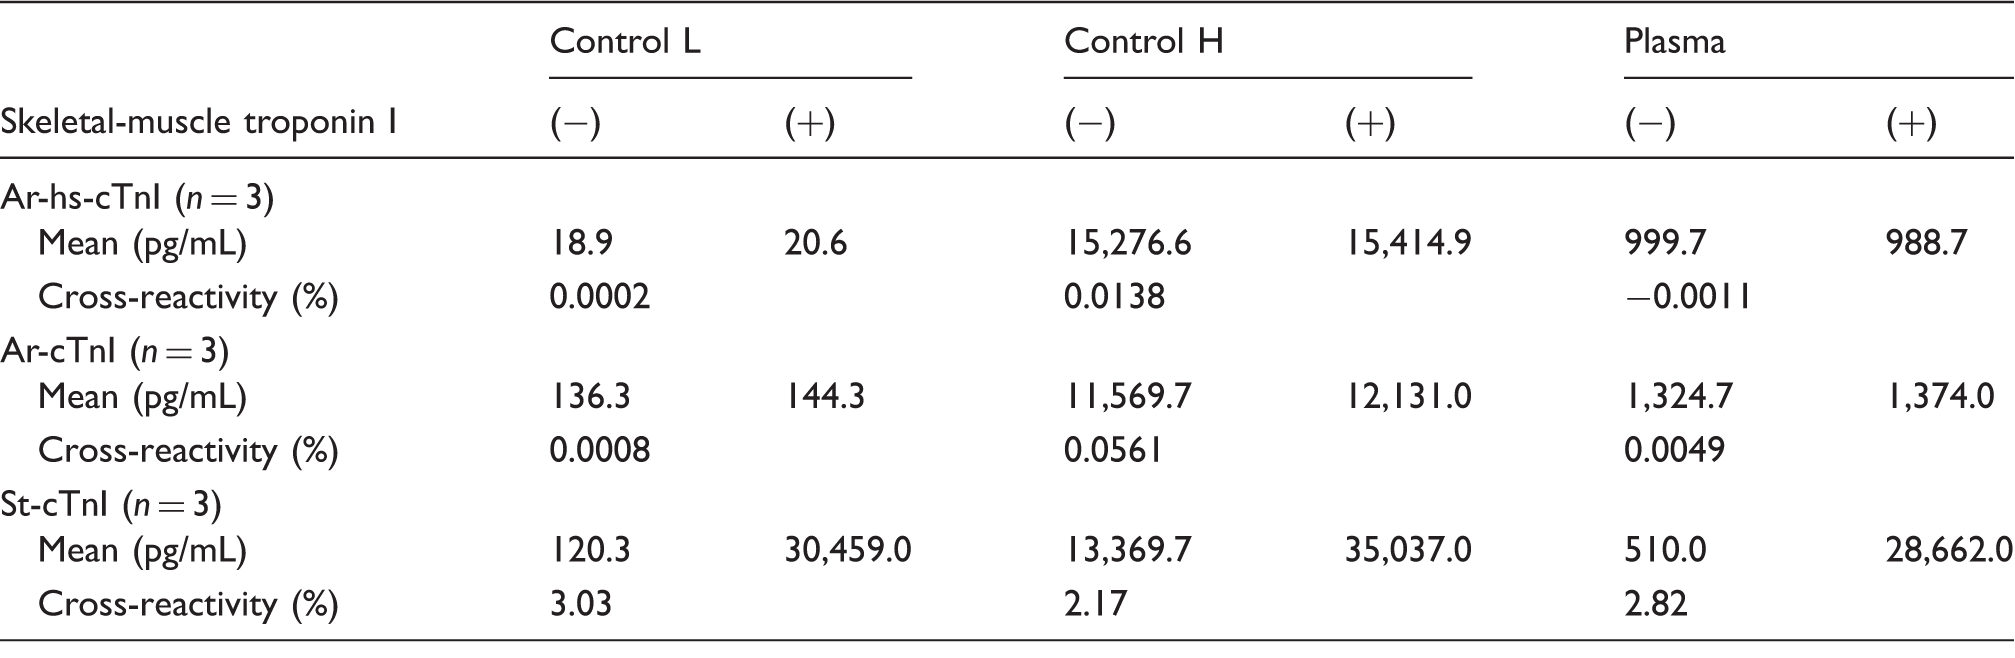
Recombinant human sTnI was added to the control samples at low and high concentration or plasma samples from patients at a final concentration of 1000 pg/mL. TnI concentrations at each condition were measured and cross-reactivity of sTnI was calculated against the blank samples.
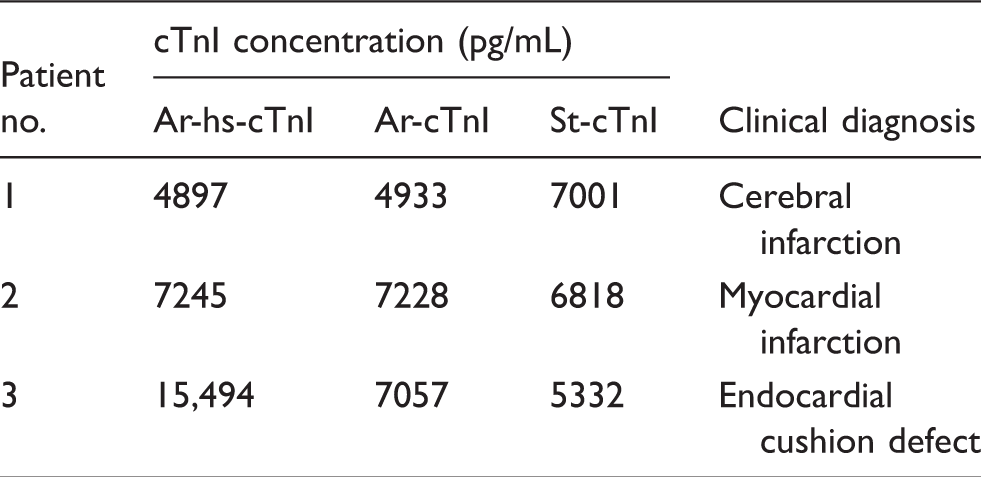
cTnI concentrations and clinical diagnosis of the samples showing higher reactivity in St-cTnI compared to Ar-hs-cTnI or Ar-cTnI.
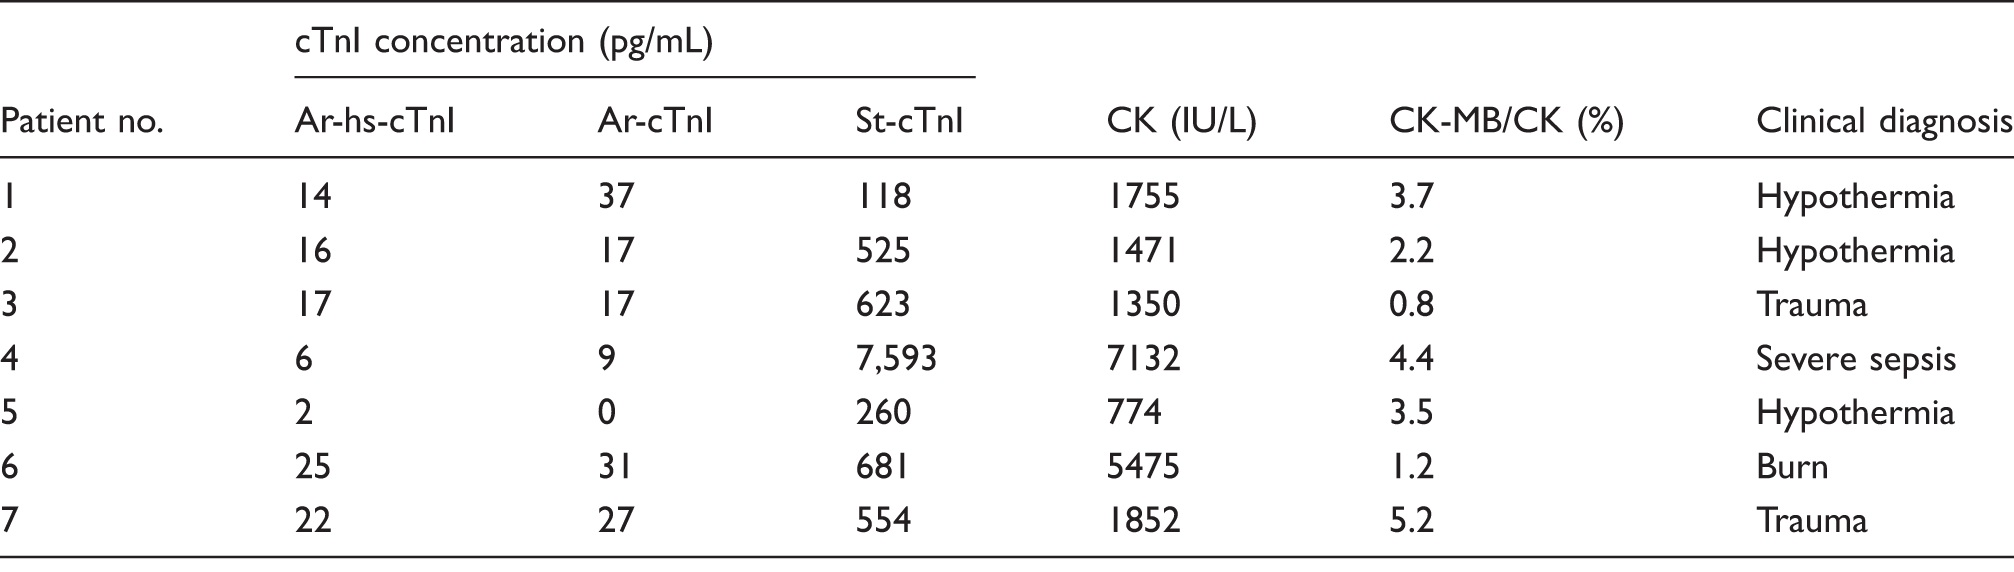
Seven samples showed cTnI concentrations over cut-off value in St-cTnI and under cut-off value in Ar-hs-cTnI and Ar-cTnI.
Reactivity with the cTnI complex
To further elucidate the reason for the low correlation between Ar-hs-cTnI and St-cTnI, we next examined differences in reactivity with several cTnI complexes using HPLC-separated samples (Table 3). The results showed that the reactivity with Multi fractions tended to be highest for St-cTnI, whereas the reactivity with cTnI-C fractions tended to be higher for Ar-hs-cTnI (Figure 3), although the percentage of each elution fraction varied for different samples. We then analysed the consistency between the discrepancies in actual cTnI concentrations and reactivity against cTnI complexes for each case. First, in sample 1, which had a higher concentration when analysed using St-cTnI, there were no obvious differences in reactivity between the reagent kits. However, the reactivity with Multi fractions was higher for St-cTnI than for Ar-hs-cTnI (consistency-positive). In sample 2, which had a higher concentration when analysed using Ar-hs-cTnI, higher reactivity with cTnI-C fractions was observed for Ar-hs-cTnI than that observed for St-cTnI (consistency-positive). Finally, in sample 3, which had a higher concentration when analysed using Ar-hs-cTnI, the reactivity with Multi fractions was lower for Ar-hs-cTnI than for St-cTnI (i.e. no consistency).
Differences in the reactivity against several cTnI complexes for Ar-hs-cTnI and St-cTnI. Three plasma samples were separated using gel filtration HPLC. The cTnI concentration of each elution fraction was measured, and elution times were estimated from the molecular weight of each complex. Elution fractions were grouped as free cTnI; complexes of cTnI and TnC (cTnI-C); complexes of cTnI, TnC, and TnT (cTnI-C-T); and multimers of these complexes (Multi). Closed squares: Ar-hs-cTnI; closed circles: St-cTnI; black arrow: free cTnI; gray arrow: cTnI-C; white arrow: cTnI-C-T; hatched arrow: Multi. cTnI concentrations and clinical diagnosis of HPLC-separated samples.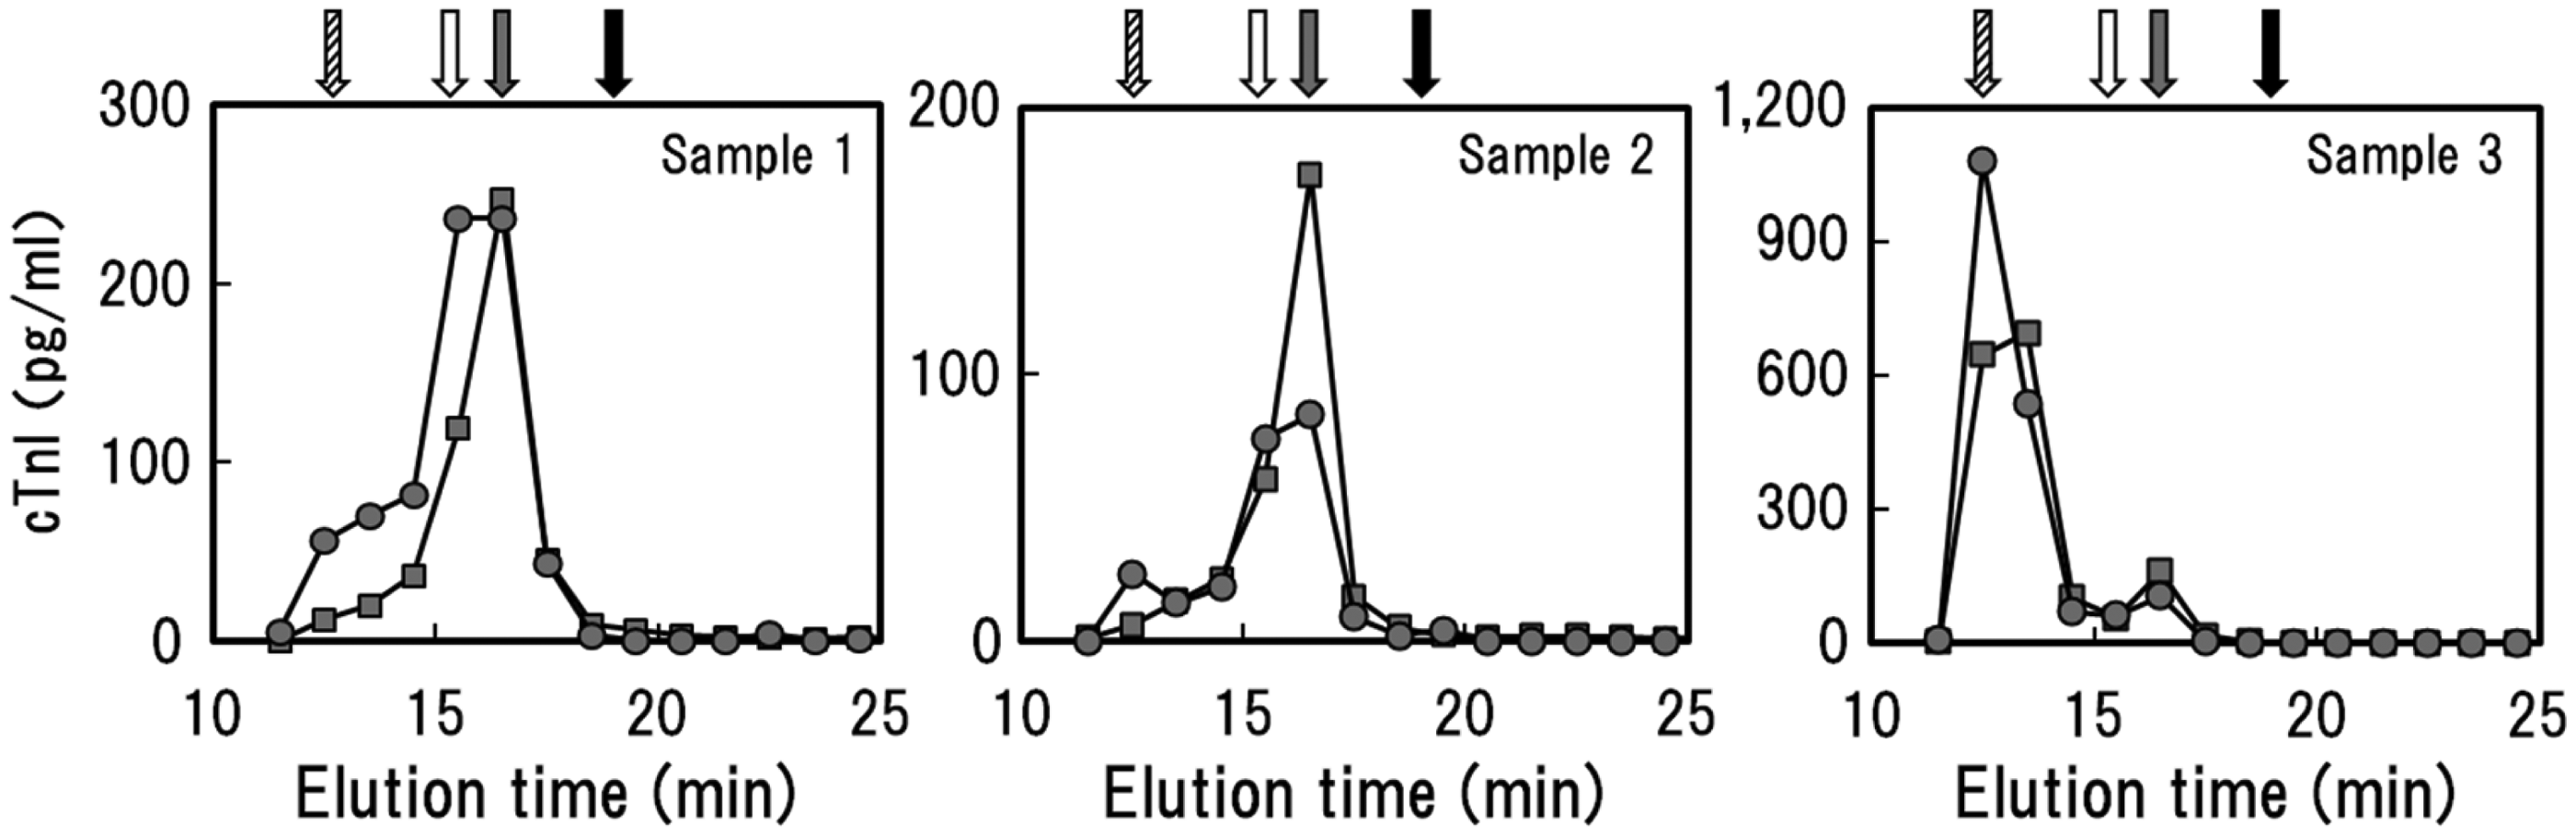
Discussion
In this study, we analysed the differences in cTnI values obtained for previously used reagents and newly developed reagents and evaluated the causes for these discrepancies. Ar-hs-cTnI reagents have been developed to be more sensitive compared with St-cTnI and Ar-cTnI; we confirmed this increased sensitivity in this study. However, the correlation between Ar-hs-cTnI and the reference reagent St-cTnI was low, particularly within the clinically relevant range of cTnI concentrations. To elucidate the possible causes of this discrepancy, we first examined the cross-reactivity with sTnI; interestingly, much higher cross-reactivity was observed for St-cTnI than for Ar-hs-cTnI. One reason for this result may have been the different clinical background of the patients. sTnI is known to be increased by muscle diseases, physical exercise, trauma and surgical procedures. 12 Patients showing higher cTnI concentrations with the St-cTnI reagents but not with the Ar-hs-cTnI reagents had no heart diseases and suffered from diseases in which lysis of striated muscle could have occurred. Therefore, in the cases with apparent discrepancies in cTnI concentrations, false-positive results may have been obtained owing to cross-reactivity with sTnI when analysed using the St-cTnI reagents.
We next evaluated whether differences in reactivity for the cTnI complex may explain the discrepancies in cTnI concentrations measured by the different reagents. For all three cases evaluated in this study, reactivity observed for the Multi fraction tended to be higher when using the St-cTnI reagents, whereas that observed for the cTnI-C fraction tended to be higher when using the Ar-hs-cTnI reagents, although the degree of reactivity differed with different cases. We hypothesized that this phenomenon could be explained by the varying epitopes of the reagents (cTnI amino acids of epitopes is 24–40 and 41–49 for Ar-hs-cTnI, 24–40, 41–49 and 87–91 for Ar-cTnI, 41–49, 71–116 and 163–209 for St-cTnI). Thus, we next examined the consistency between reagent-specific differences in reactivity against cTnI complexes and discrepancies in measured values. Although samples 1 and 2 were consistently positive, sample 3 did not show consistent results. Inhibitory factors such as human antimouse antibodies (HAMAs) may lead to false-negative results when using the St-cTnI reagents, because the reagent set uses mouse-derived antibodies, thus, explaining this discrepancy. Human-mouse chimera antibodies were used to avoid the effects of HAMAs in Ar-hs-cTnI. However, the effects of HAMAs could not be analysed in detail in this study because of the limited sample volume. In summary, our results suggested that Ar-hs-cTnI was highly sensitive for measurement of cTnI and showed low cross-reactivity with sTnI. Therefore, this reagent system may be useful for routine examinations.
Footnotes
Acknowledgements
We would like to thank the members of Division of Laboratory Medicine, Sapporo Medical University Hospital for helpful discussion of the manuscript.
Declaration of conflicting interests
The author(s) declared no potential conflicts of interest with respect to the research, authorship, and/or publication of this article.
Funding
The author(s) received no financial support for the research, authorship, and/or publication of this article.
Ethical approval
Guarantor
TK.
Contributorship
TK carried out most of the experiments; TK and DK participated in the design of the study and interpretation of the results, and drafted the manuscript. All authors participated in the interpretation of the results and coordinated the study. ST conceived and coordinated the study, and supervised its design and conduction and writing of the manuscript. All authors read and approved the final manuscript.