
Abstract
Background
E-selectin, an adhesion molecule, is a specific marker of endothelial dysfunction. High concentrations have been reported in type 2 diabetes and disorders with high risk of cardiovascular disease (CVD). Measurement of carotid intima-media thickness (CIMT) is a surrogate marker of early atherosclerosis. We examined the relationship between E-selectin concentrations, CIMT and cardio-metabolic traits in normo- and hyperglycaemic mixed ancestry South Africans.
Methods
E-selectin concentrations were determined in 308 subjects from the Cape Town Bellville South Community–based study on a mixed ancestry population. Their correlation with CIMT and cardio-metabolic profile used robust correlations and linear regression models.
Results
E-selectin concentrations were significantly higher in the hyperglycaemic (median 139.8 µg/L) compared to the normoglycaemic group (median 118.8 µg/L), (p = 0.0007). Significant differences between the two groups were found for markers of glycaemia and adiposity, but not for CIMT. Significant correlations were found between E-selectin and age, markers of glycaemia and inflammation, central obesity and lipid variables. Associations remained significant only with age, hyperglycaemia and C-reactive protein in robust linear regression models. In similar regressions models, age and gender were the main predictors of CIMT, which was not associated with E-selectin.
Conclusions
E-selectin concentrations in this study were associated with hyperglycaemia, possibly reflecting early endothelial damage. However, E-selectin was not useful to assess CIMT, a marker of subclinical atherosclerosis, which appeared to be determined by ageing and male gender.
Background
Diabetics are at an increased risk of cardiovascular disease (CVD), through multiple pathophysiological pathways including endothelial cell dysfunction and damage, which are major causes of vascular complications in diabetes.1,2 Endothelial cell dysfunction is regarded as an early step in atherosclerotic plaque formation primarily due to its effect on endothelial cell activation. 3 The effect of hyperglycaemia on endothelial cells closely mimics that of inflammatory initiators. Advanced glycation end-products are increased due to the nonenzymatic binding of glucose to various proteins. This includes binding to receptors on the endothelial cells, leading to an increased synthesis of adhesion products such as E-selectin, a specific marker of endothelial cell activation and dysfunction.2,4 This process promotes vascular inflammation and the recruitment of leucocytes and atherosclerosis. 4 E-selectin’s expression on inflamed endothelial cells is increased in response to pro-inflammatory cytokines such as tumour necrosis factor (TNF)α and interleukin (IL)-13,5 and has been reported to be elevated in type 2 diabetes. E-selectin recruits leukocytes into the endothelium by binding ligands on their cell surfaces. This facilitates their rolling on endothelial cells, thereby slowing down the leucocytes and allowing their eventual entry into the subendothelial space.3,6,7 Elevated concentrations of E-selectin in obesity may be due to its increased synthesis secondary to TNFα, which is associated with the inflammatory response of visceral obesity.8,9 Elevated concentrations of E-selectin have also been known to occur in high CVD risk disorders such as smoking, obesity, diabetes, hypertension and hypercholesterolaemia.4,7,10
The obesity pandemic has fuelled a dramatic increase in prevalence of type 2 diabetes, particularly in low- to middle income countries such as South Africa. 11 Type 2 diabetes and obesity are both considered to be inflammatory conditions.12–15 The measurement of carotid intima-media thickness (CIMT) has been described as a surrogate marker of early atherosclerosis burden and is used for CVD risk assessment. 16 A CIMT > 0.8 mm is considered thickened and is associated with CVD risk.
Emerging markers of CVD risk such as soluble E-selectin concentrations have not been investigated in populations within Africa. The mixed ancestry population is a heterogeneous South African ethnic group with one of the highest reported prevalences of type 2 diabetes in Africa. 11 This community has a high prevalence of metabolic syndrome which has been shown to be a powerful determinant of diabetes and CVD. Previous studies on this population found a high risk of diabetes and CVD and led to the establishment and continuation of the Bellville South study group.11,17 In the current study, we examined the relationship between soluble E-selectin concentrations, CIMT and cardio-metabolic traits in normo- and hyperglycaemic mixed ancestry South Africans.
Methods
Study setting and population
The study setting has been described in detail elsewhere.11,17,18 Briefly, participants were members of a cohort study conducted in Bellville South, Cape Town, a mixed ancestry township formed in the late 1950s. The study was approved by the University of Stellenbosch (N09/03/090) and the Cape Peninsula University of Technology Faculty of Health and Wellness Sciences ethics committee (Reference Number: CPUT/HW-REC 2008/002, CPUT/HW-REC 2010, NHREC: REC – 230 408 – 014 and N14/01/003). The study was conducted according to the Code of Ethics of the World Medical Association (Declaration of Helsinki). All participants signed written informed consent after all the procedures had been fully explained in the language of their choice.
Anthropometric measurements
Participants were examined in the Bellville South Community in Cape Town. All consenting participants received a standardized interview and physical examination during which blood pressure was measured according to World Health Organization (WHO) guidelines 19 using a semi-automated digital blood pressure monitor (Rossmax, PA, USA). Other clinical measurements included the body weight, height, waist and hip circumferences. Participants underwent a standard 2-h 75 g oral glucose tolerance test (OGTT) as described by the WHO, with fasting and 2-h plasma glucose being determined. Impaired glucose tolerance (IGT) and impaired fasting glucose (IFG) were diagnosed based on WHO criteria. 20 According to these criteria, IFG was defined as a fasting glucose concentration of 5.6–7 mmol/L and IGT was defined as a 2-h glucose concentration of 7.8–11.1 mmol/L. Normoglycaemia was defined as normal fasting glucose concentrations and normal response to 75 g OGTT, whereas hyperglycaemia was defined as known diabetes, screen detected diabetes, IGT and/or IFG.
Laboratory measurements
Fasting (minimum of 8 h) blood samples were collected and processed within 2 h for further analysis. Separated serum was stored at −70℃. Plasma glucose was measured by enzymatic hexokinase method on the Cobas® 6000 Roche Diagnostics (Indianapolis, IN, USA). Glycated haemoglobin (HbA1c) was assessed by turbidimetric inhibition immunoassay on the Cobas 6000, Roche Diagnostics (Indianapolis, IN, USA). This method is National Glycohaemoglobin Standardization Programme (NGSP) certified according to Roche Diagnostics. Cholesterol, high density lipoprotein cholesterol (HDL-c) and triglycerides (TG) were estimated by enzymatic colorimetric methods on the Cobas 6000, Roche Diagnostics (Indianapolis, IN, USA). Insulin was determined by a microparticle enzyme immunoassay on the AxSYM® Abbot (Abbott, Irving, TX, USA). C-reactive protein (CRP) was measured by a high-sensitivity CRP assay, based on the highly sensitive Near Infrared Particle Immunoassay rate methodology (Immage® Immunochemistry System, Beckman Coulter (Brea, CA, USA)), with a lower limit of detection of 0.2 mg/L. All laboratory tests were performed in an accredited laboratory where regular internal and external quality control was performed.
Serum samples for E-selectin determination were stored and are stable at −70℃ according to the manufacturers’ insert. Samples, controls and standards were measured in duplicate by a sandwich ELISA (abcam®, Cambridge, UK), and the concentrations were calculated from a standard curve. The limit of detection is <0.5 ng/mL and the average E-selectin concentration for this assay as determined by the manufacturers on 80 normal subjects was found to be 51.99 ± 26.65 µg/L (range 11.78–160.72 µg/L). The intra-assay coefficient of variation (CV) was determined and found to be 8.9% and the inter-assay CV was 10.5%.
Definitions and calculations
Body mass index (BMI) was calculated as weight per square metre (kg/m2) and waist–hip ratio (WHR) as waist/hip circumferences (cm). Diabetes was based on a history of doctor diagnosis, fasting blood glucose concentration ≥7.0 mmol/L and/or 2-h post-OGTT plasma glucose concentration ≥11.1 mmol/L. 20 The homeostatic model assessment of insulin resistance (HOMA-IR) was calculated according to the formula: HOMA-IR = (fasting insulin concentration [mIU/L] × fasting plasma glucose [mmol/L]/22.5). 21 Low-density lipoprotein cholesterol (LDL-c) was calculated using Friedewald’s formula. 22 This calculation is invalid and was not performed at TG concentrations >4.5 mmol/L.
Measurement of carotid IMT
The CIMT was measured by two qualified sonographers who were blinded to the risk factor status of participants, in longitudinal section at the far wall of the distal common carotid arteries, 2 cm from the bifurcation, at three consecutive end-points, 5–10 mm apart. The mean of the six readings (three from each side) was taken for each participant using a portable B-mode and spectral Doppler ultrasound scanner equipped with cardiovascular imaging software. The GE LOGIQ e® (General Electric Healthcare, Germany) high-performance multipurpose colour compact ultrasound system included new imaging CrossXBeam technologies with multifrequency virtual apex on phased array cardiac transducer (3S-RS wide band phased probe, 1.7–4.0 MHz) for echocardiography, and a linear wide band vascular transducer (8 L-RS 4.0–12 MHz linear probe) used for improved diagnostic confidence and imaging clarity for the carotids.
Statistical methods
The statistical software R (version 3.2.2 [15 August 2015], The R Foundation for Statistical Computing, Vienna, Austria) was used to perform all the statistical analyses. The Shapiro–Wilk W test was used to determine the distribution of E-selectin. Due to the skewed distribution, non-parametric tests were used and the median and lower and upper quartiles (P25–P75) were used for descriptive statistics of the general characteristics of the study group. The Mann–Whitney U test was used to compare categorical variables across subgroups. The association of E-selectin with baseline characteristics was assessed by comparing the distribution of those characteristics across quarters of E-selectin. We first used the Kruskal–Wallis test to test for differences in the median values of those characteristics by quarter of E-selectin, and then used the Jonckheere’s trend test to investigate monotonic changes in the medians across quarters of E-selectin. Finally, we used robust correlation to investigate continuous associations between continuous E-selectin levels and continuous traits to limit the potential effect of outliers. Similar robust correlations were used to investigate the continuous association of E-selectin and other characteristics with CIMT, and the potential effects of extraneous factors adjusted for in robust linear regression models. Results corresponding to P values below 5% are described as significant. We did not adjust for multiple testing.
Results
Results according to glycaemic status (Mann–Whitney U test for non-parametrics).
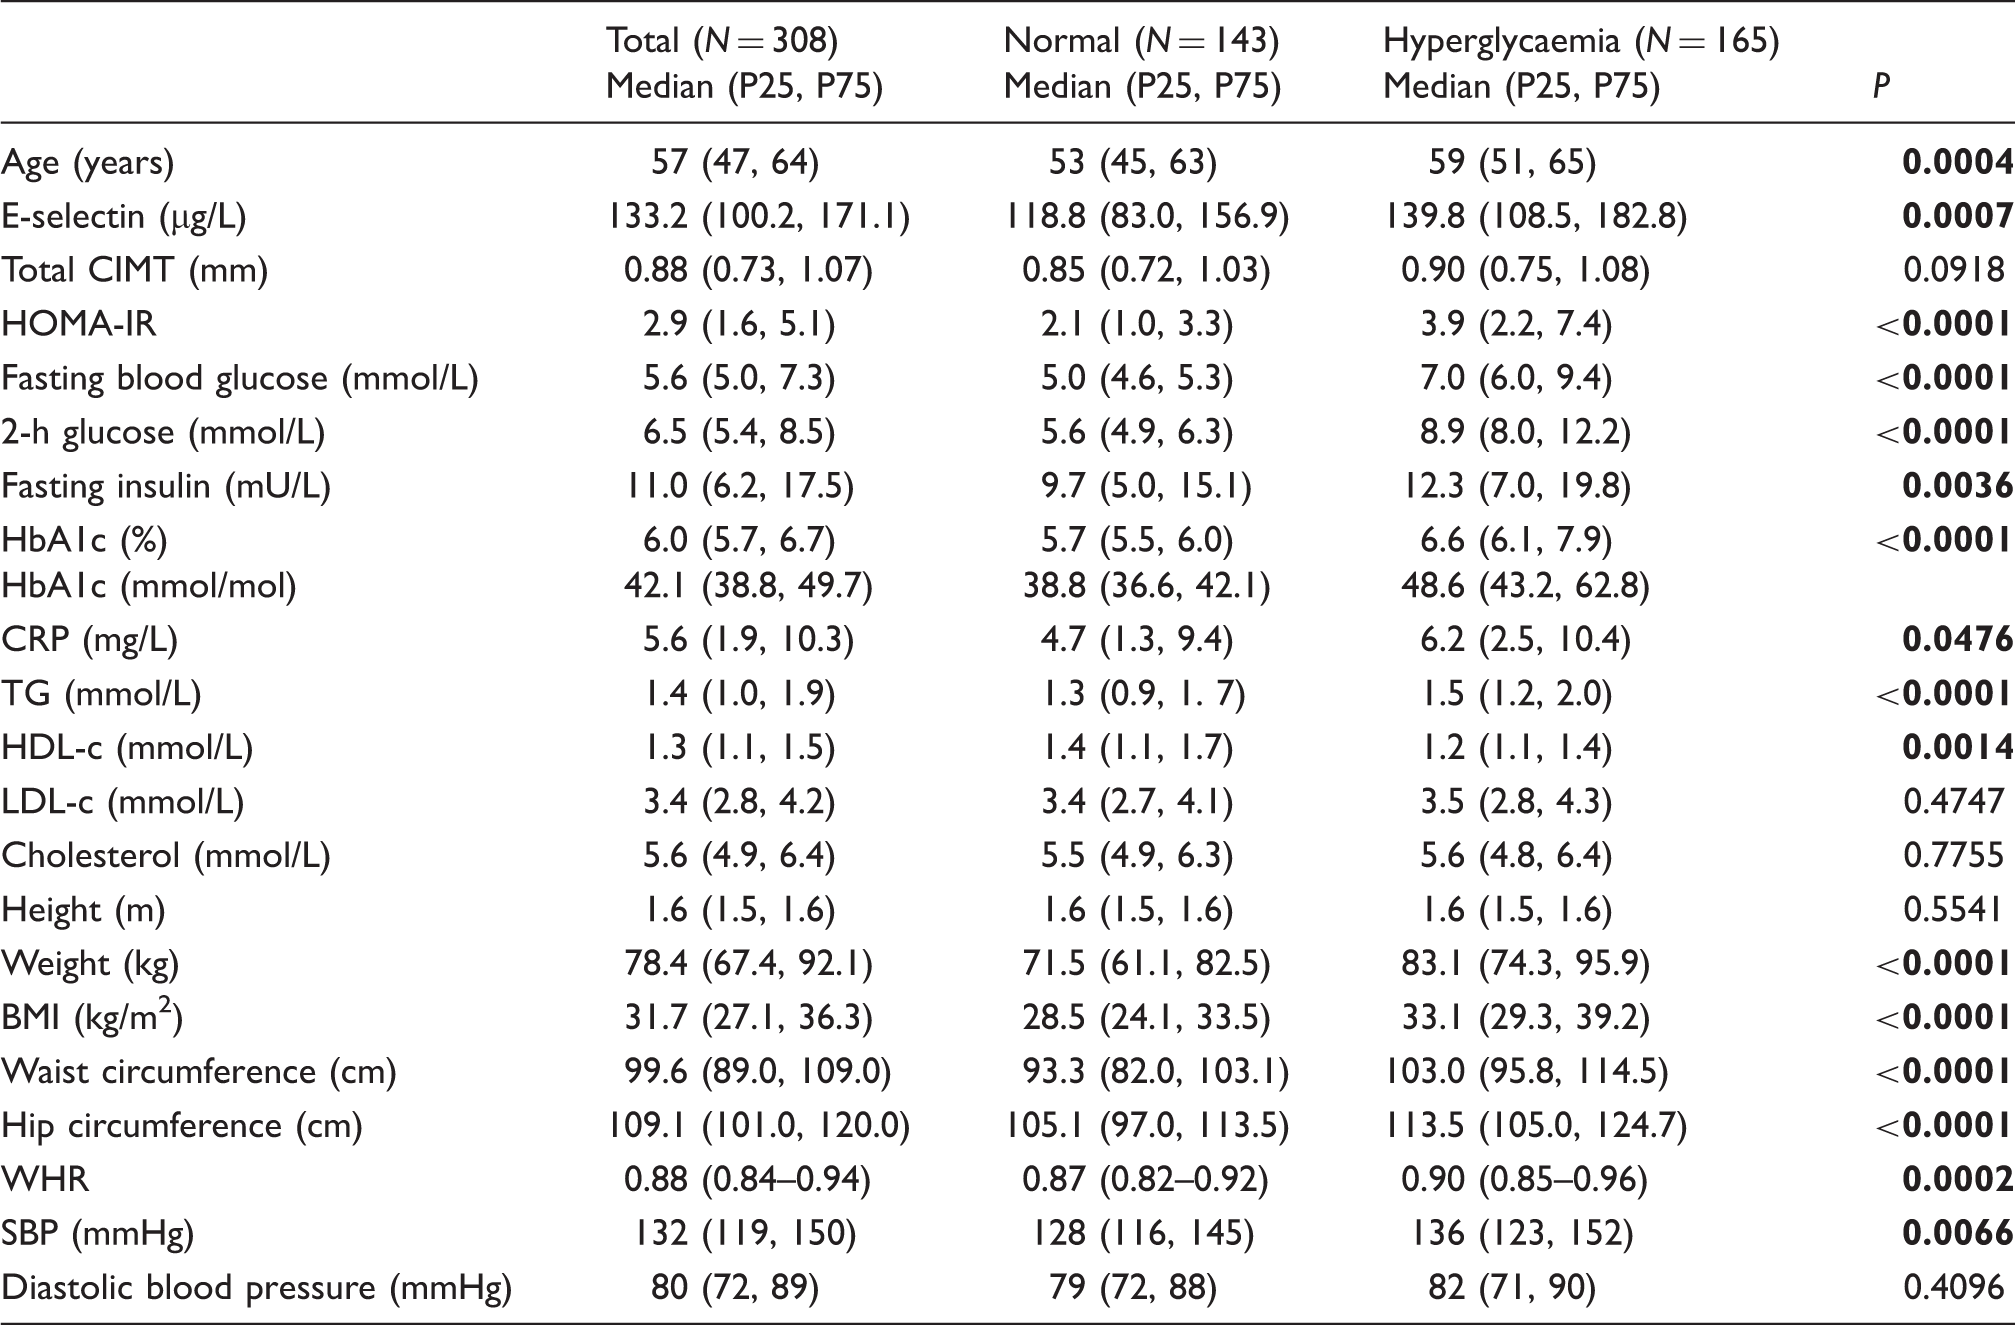
BMI: body mass index; CIMT: carotid intima-media thickness; CRP: C-reactive protein; HbA1c: glycosylated haemoglobin; HDL-c: high density lipoprotein cholesterol; HOMA-IR: homeostatic model assessment of insulin resistance; LDL-c: low-density lipoprotein cholesterol; SBP: systolic blood pressure; TG: triglycerides; WHR: waist–hip ratio. Bold denotes statistical significance.
Baseline characteristics across quarters of E-selectin.
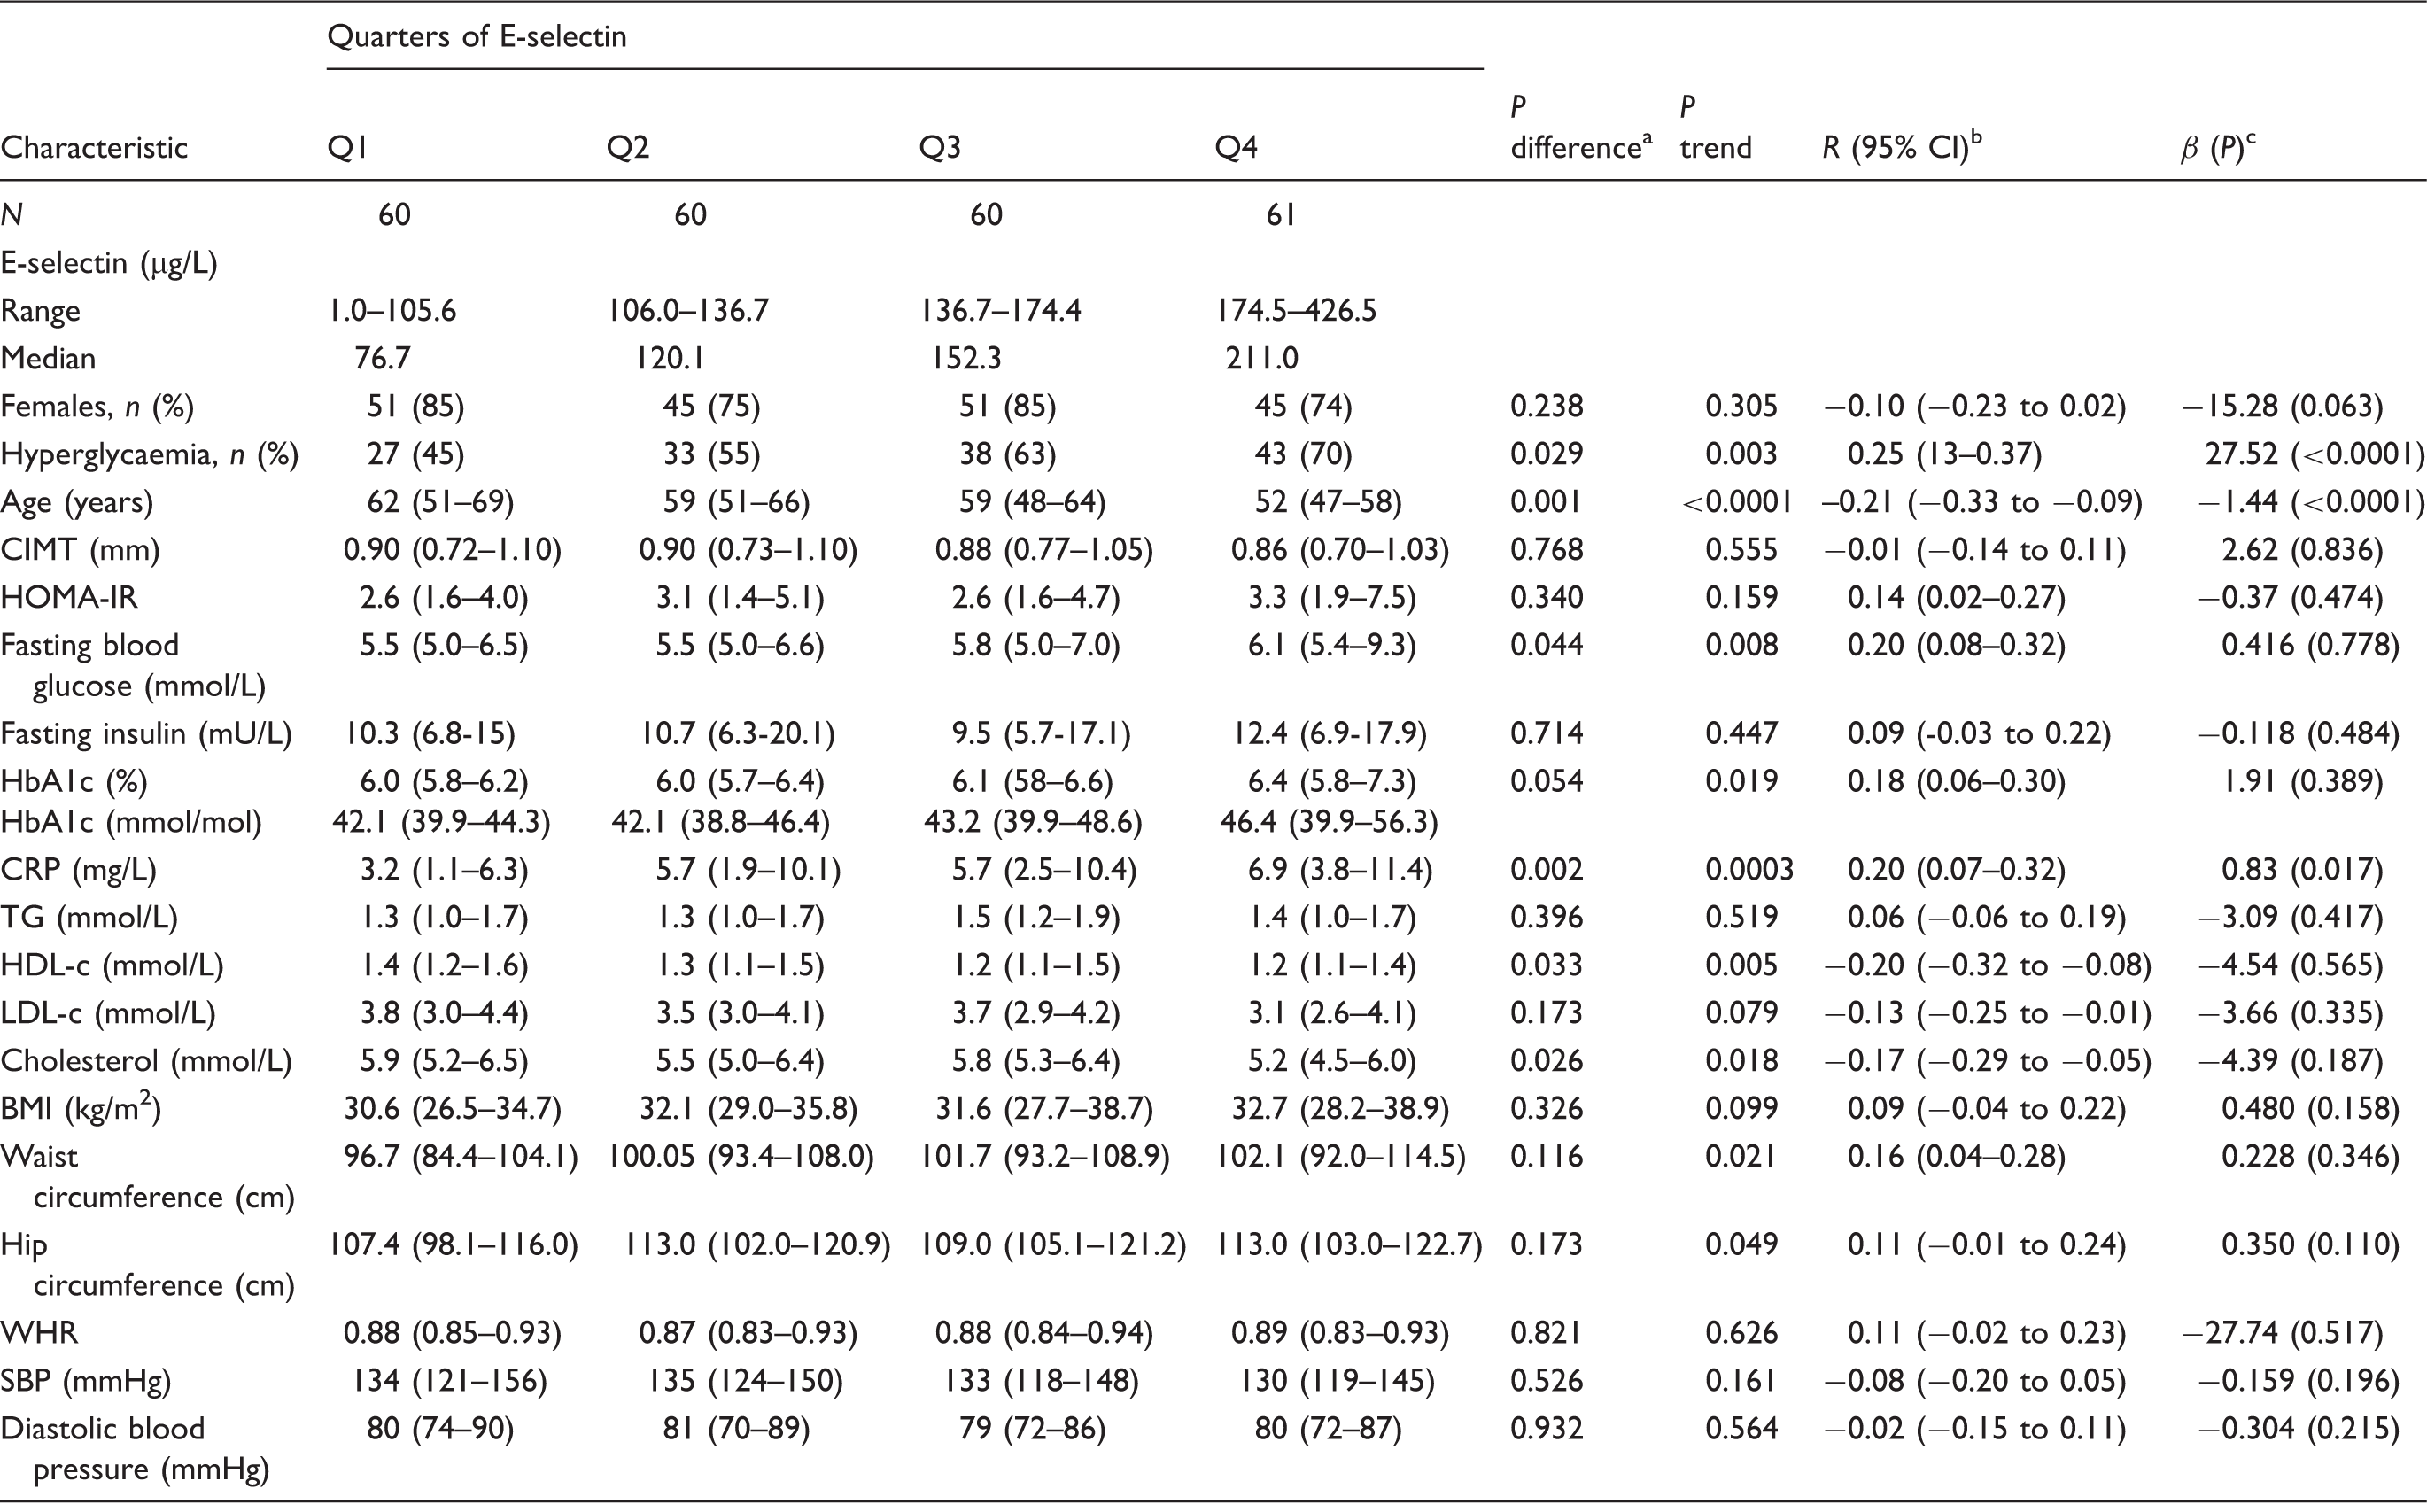
BMI: body mass index; CIMT: carotid intima-media thickness; CRP: C-reactive protein; HbA1c: glycosylated haemoglobin; HDL-c: high density lipoprotein cholesterol; HOMA-IR: homeostatic model assessment of insulin resistance; LDL-c: low-density lipoprotein cholesterol; SBP: systolic blood pressure; TG: triglycerides; WHR: waist–hip ratio.
p values from Kruskal–Wallis and χ2 tests for the differences across quarters of E-selectin.
Robust correlation coefficients and 95% CIs for the continuous associations of E-selectin with covariates.
β coefficients and P values from age, gender and status for hyperglycaemia-adjusted robust linear regressions for the prediction of E-selectin concentrations by various traits.
Robust correlation of CIMT with E-selectin and other variables.
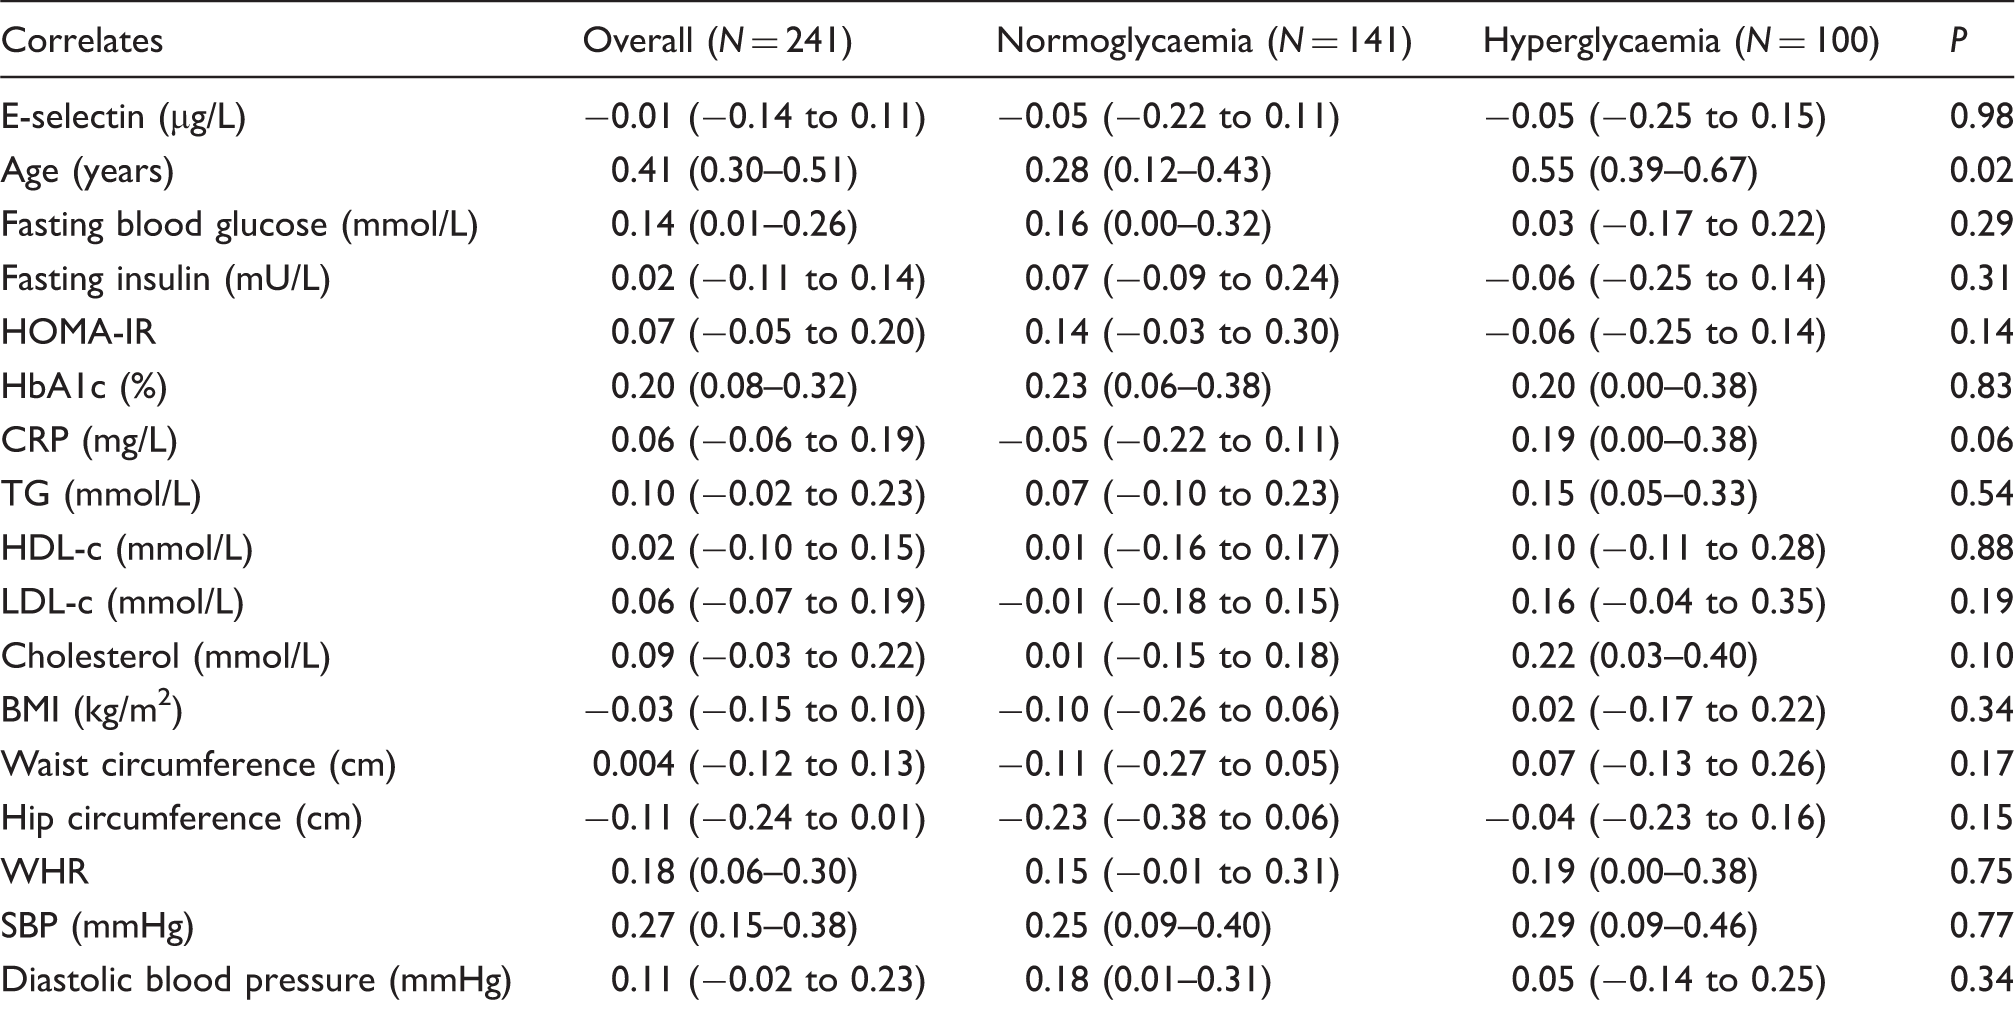
BMI: body mass index; CIMT: carotid intima-media thickness; CI: confidence interval; CRP: C-reactive protein; HbA1c: glycosylated haemoglobin; HDL-c: high density lipoprotein cholesterol; HOMA-IR: homeostatic model assessment of insulin resistance; LDL-c: low-density lipoprotein cholesterol; SBP: systolic blood pressure; TG: triglycerides; WHR: waist–hip ratio.
Regression coefficients from multiple robust linear models for the prediction of CIMT by E-selectin accounting for the potential effect of gender, age, hyperglycaemia and adiposity.
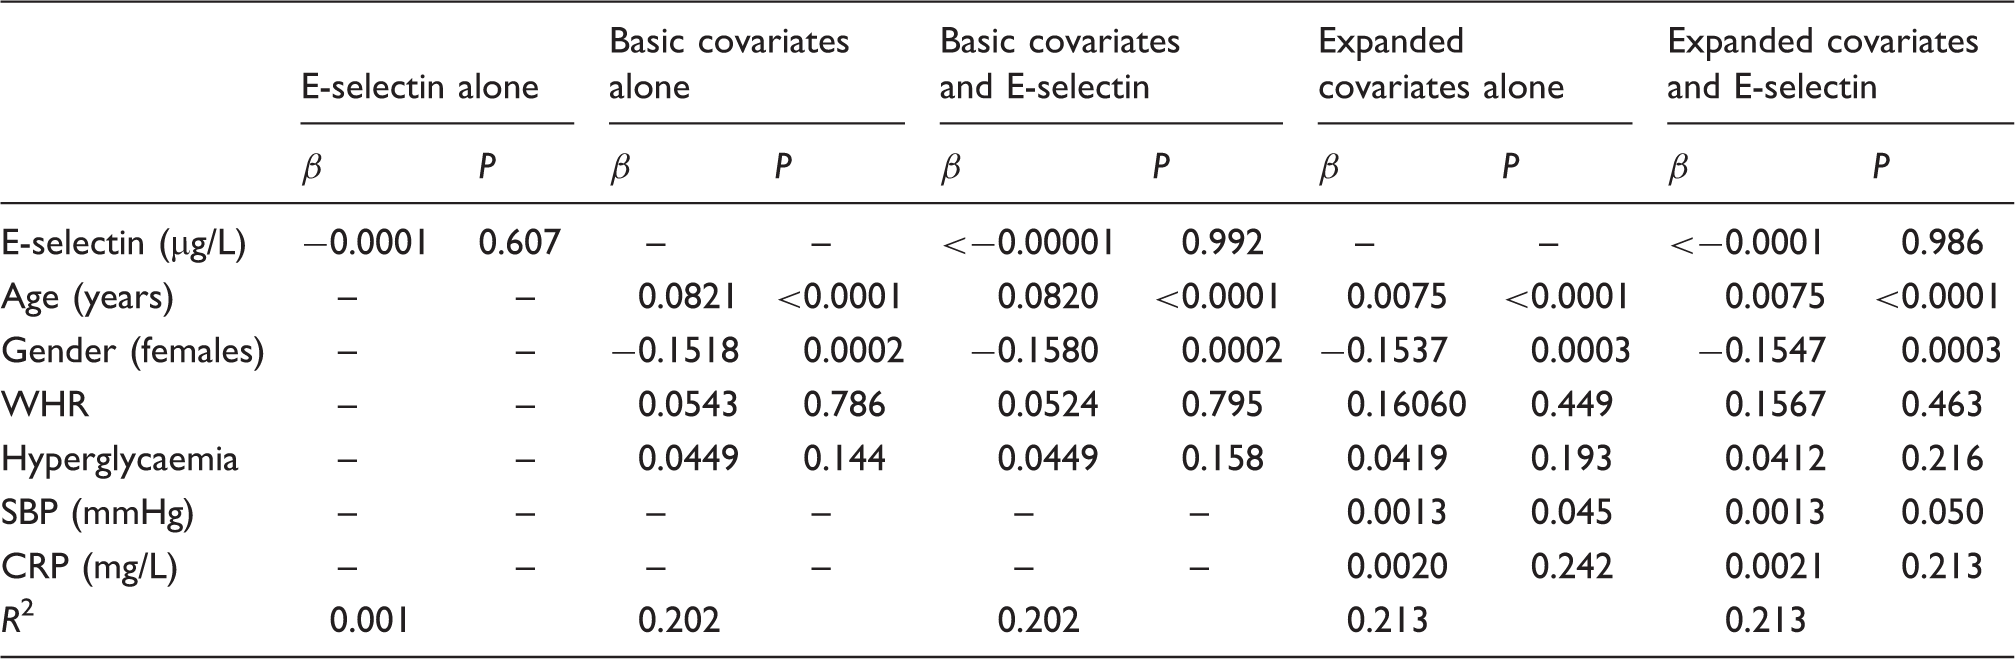
CRP: C-reactive protein; SBP: systolic blood pressure; WHR: waist–hip ratio.
Discussion
The adhesion of circulating leukocytes to endothelial cells plays an important role in the initiation of atherosclerosis.1,23 Cellular adhesion molecules are poorly expressed by the resting endothelium, but are upregulated during endothelial activation associated with atherogenesis.3,24 Soluble forms of cellular adhesion molecules can be found in plasma, and it has been suggested that elevated plasma concentrations of some cellular adhesion molecules may be an index of endothelial activation 7 or even a molecular marker of early atherosclerosis.4,25
The purpose of this study was to examine the relationship between E-selectin levels, CIMT and cardio-metabolic traits in normo- and hyperglycaemic mixed ancestry South Africans. Although we found that E-selectin concentrations were raised in hyperglycaemic subjects, no relationship was observed between these E-selectin concentrations and CIMT. These results suggest that the measurement of E-selectin in this population for the purpose of CVD risk stratification is likely to be futile. Indeed, subclinical atherosclerosis as measured by CIMT showed significant associations only with traditional risk factors such as age, gender and blood pressure.
Similar to our observations, Leinonen et al. 26 found that E-selectin levels were higher in diabetics, but not associated with CIMT. In contrast to these results, several studies have reported a significant association between E-selectin levels and CIMT. A study by Delibasi et al. 27 found that in subjects with non-functional adrenal incidentalomas, E-selectin concentrations correlated significantly with both HOMA-IR and CIMT, while Baldassarre et al., 28 who examined subjects with only CVD but no diabetes, found that statin therapy significantly decreased both CIMT and E-selectin concentrations indicating the treatment’s ability to improve endothelial dysfunction. In another study of 505 Japanese males, Sakurai et al. 29 reported that E-selectin concentrations were significantly associated with CIMT and suggested its usefulness as a biomarker for unstable plaques and future CVD prediction. Furthermore, Vaidya et al. 30 reported that E-selectin was associated with CIMT independent of metabolic syndrome. The MIAMI study which examined the relationship between various circulating markers of inflammation and CIMT found that E-selectin was strongly correlated to atherosclerotic burden and CIMT, and inversely correlated to HDL-c. 31
Obesity, type 2 diabetes and atherosclerosis are associated with underlying inflammation.12–15 This pro-inflammatory status leads to increased secretion of TNFα and IL-6 which stimulate the synthesis of E-selectin.3,7 In the case-cohort study by the Monitoring of Trends and Determinants in Cardiovascular Disease (MONICA)/Cooperative research, males and females with elevated concentrations of E-selectin demonstrated a significantly higher risk of type 2 diabetes after multivariate analysis. 32
Ryysy and Yki-Järvinen 33 measured E-selectin concentrations in type 2 diabetics before and after initiation of insulin therapy for intensive glycaemic control and described that before therapy, E-selectin concentrations were 71% higher in diabetics than in controls but that these concentrations decreased with improved glycaemic control. 33 Leinonen et al. 34 measured adhesion molecules including E-selectin in type 2 diabetics and found that the concentrations correlated with HbA1c and inversely with HDL-c. A small study by Boulbou et al. 35 examined 18 type 2 diabetics with peripheral arterial disease and 18 type 2 diabetics without peripheral arterial disease and 22 controls, and found that diabetics with peripheral arterial disease had significantly increased E-selectin concentrations which correlated with duration of disease and insulin resistance. Elhadd 36 described increased E-selectin concentrations in type 2 diabetics and Cominacini 37 found that higher E-selectin concentrations in type 2 diabetics were dependent on glycaemic control and postulated that oxidative stress associated with poor glycaemic control may upregulate E-selectin concentrations.
HDL-c has been found to inhibit the formation of adhesion molecules. 38 In support, we found a significant inverse correlation between E-selectin concentrations and HDL-c in the group as a whole but not in separate groups. Leionen et al. proposed that E-selectin may influence HDL-c concentrations by influencing phospholipase A2, which affects paraoxonase activity and thus the reverse cholesterol transport system. Additionally, phospholipase A2 decreases LDL-c size, making LDL-c more atherogenic. 34 In cell culture studies, Nofer et al. 39 found that HDL-c inhibited the cytokine-induced expression of E-selectin and Cockerill et al. 40 also determined that this inhibitory effect may be due to its inhibition of IL-1.
We found an inverse correlation between E-selectin concentrations and age which was unexpected. However, Ponthieux et al. 41 performed an age-related study of reference values for E-selectin in 2003 and found that although E-selectin concentrations decreased steadily during childhood, they were not influenced by age in adulthood. It is also important to note that although E-selectin concentrations differed significantly between the two groups, the concentrations were increased in all the participants. Our findings of higher baseline E-selectin concentrations may be due to participants having higher BMIs, and all had relatively increased CIMT. Additionally, Constans and Conri 7 advocate caution when interpreting E-selectin results due to large interindividual variation of results.
Our study has some limitations, namely the cross-sectional nature precluding inferences about causality. The study sample was relatively small, likely compromising our statistical power to uncover some significant associations. We only determined E-selectin concentrations and did not examine other adhesion molecules. The reference intervals for E-selectin were determined by the manufacturer in 80 normal subjects who were not described and may have differed from our population. Additionally, although the manufacturers claimed that serum samples for E-selectin determination are stable at −70℃, we did not formally verify this. Furthermore, the study participants were almost uniformly obese. Such a uniform population could narrow the spectrum of some covariates investigated in the current study and therefore mask some significant associations. However, our study also has major strength including the assessment of a wide range of cardio-metabolic risk factors, and the use of robust statistical analysis to address and efficiently deal with possible effects of outliers which could distort the associations, particularly in the context of a modest sample size.
Conclusion
In conclusion, although we found higher E-selectin concentrations in hyperglycaemic subjects which may be indicative of the underlying endothelial dysfunction in hyperglycaemia, we found that concentrations of soluble E-selectin did not correlate with CIMT, a surrogate marker of early atherosclerosis. This is despite the fact that E-selectin is endothelium specific and is a marker of endothelial dysfunction. However, in our cohort, all participants were overweight, all had relatively high E-selectin concentrations and all had median CIMT above the recommended cut-off of 0.8 mm. This supports previous findings that this is likely a population at high risk for CVD, and this may be due to underlying endothelial dysfunction. Further longitudinal studies are warranted in this population to establish the prognostic value of our findings.
Footnotes
Acknowledgements
We wish to thank the fieldworkers from the Bellville South study for recruiting study subjects and the Bellville South Community.
Declaration of conflicting interests
The author(s) declared no potential conflicts of interest with respect to the research, authorship, and/or publication of this article.
Funding
The author(s) disclosed receipt of the following financial support for the research, authorship, and/or publication of this article: This research was supported by grants from the University Research Fund of the Cape Peninsula University of Technology, South Africa, and the National Health Laboratory Services South Africa (grant number 94277). The above-mentioned funding sources played no role in this publication besides funding the project.
Ethical approval
The study was approved by the University of Stellenbosch (N09/03/090) and the Cape Peninsula University of Technology Faculty of Health and Wellness Sciences ethics committee (Reference number: CPUT/HW-REC 2008/002, CPUT/HW-REC 2010, NHREC: REC - 230 408 – 014 and N14/01/003).
Guarantor
RTE.
Contributorship
All authors contributed to the planning, conduct and reporting of the work.