
Abstract
Background
Faecal calprotectin has been shown to be a useful non-invasive marker for the diagnosis and monitoring of inflammatory bowel disease in children and adults. Although there are well-established reference ranges for the diagnosis of inflammatory bowel disease in adults, these have been less well studied in children. The objective was to establish reference ranges in our local population.
Method
All faecal calprotectin results from 2011 to 2014 were retrospectively collated and grouped according to patient age. Probability plots were used to determine expected upper limit of normal for each age group, and Mann-Whitney test was used to determine statistical difference between groups.
Results
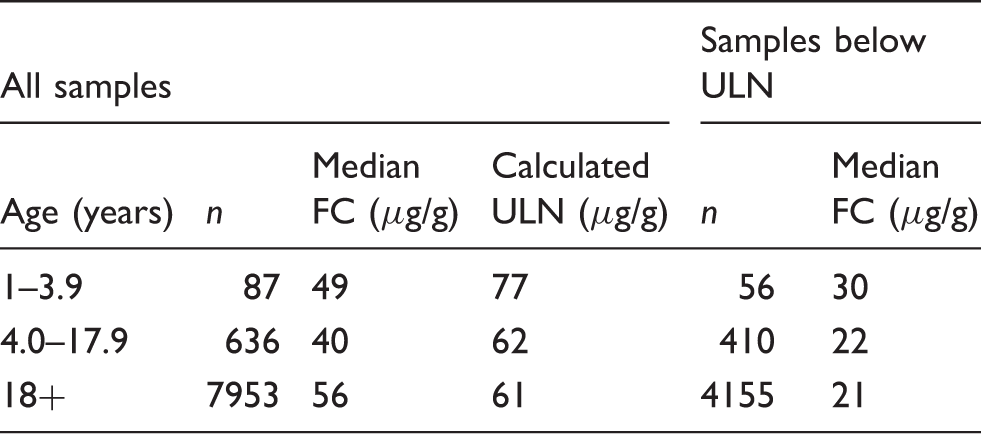
Upper limit of normal for age groups 1–3.9 years, 4–17.9 years and 18 years plus were 77, 62 and 61 µg/g, respectively. There was a significant difference (P = 0.0013) between the median calprotectin concentration for the age group 1–3.9 years (n = 87) and 4–17.9 years (n = 636) and between the age group 1–3.9 years and 18 years plus (n = 7953, P = 0.0001), but there was no significant difference between the age groups 4–17.9 years and 18 years plus (P = 0.4206).
Conclusions
In our local population, faecal calprotectin varies with age. Children aged 1–3.9 years had higher concentrations of faecal calprotectin than adults, but there was no significant difference in faecal calprotectin between older children and adults. This is in agreement with other published studies; however, the faecal calprotectin upper limit of normal calculated for children aged 1–3.9 years was lower than has been observed elsewhere.
Introduction
Inflammatory bowel disease (IBD) refers to a group of conditions that involves inflammation of the gastrointestinal tract, of which, ulcerative colitis (UC) and Crohn’s disease (CD) are the most common. IBD is associated with high morbidity and may cause serious complications requiring surgery and an increased risk of colorectal cancer. Early diagnosis is essential for appropriate management and monitoring. The symptoms of IBD including abdominal pain, chronic diarrhoea or constipation are amongst those frequently observed in primary care, most commonly in association with irritable bowel syndrome (IBS) which has a prevalence of between 10 and 20% of the general population. 1 Unlike IBD, IBS has no distinctive pathology, is not associated with serious comorbidities and does not require referral to secondary care.
Faecal calprotectin (FC) is a protein released by neutrophils, which are found in inflamed areas of the bowel in IBD. Measurement of FC in a single stool sample has been established as a highly sensitive, non-invasive marker for the diagnosis and monitoring of IBD in children and adults.2,3 Although there are well-established cut-off values for the rule-out of IBD in adults, these have been less well studied in children particularly those in the younger age categories (under 4 years). 4
The diagnosis of IBD may be less straightforward in the paediatric population than in adults. Children often have more extensive disease at diagnosis compared with adults. While the majority of adults with IBD have a diagnosis of UC, in children, this is reversed with 60% of IBD in under 16 year olds caused by CD. 5 The pattern of symptoms also differs between children and adults: only 25% of children with CD present with the classic triad of abdominal pain, diarrhoea and weight loss. Other symptoms present at diagnosis in children include lethargy, anorexia and abdominal discomfort or isolated growth failure. 5 There are a number of differential diagnoses including infectious disease, allergy and primary immunodeficiency disorders which are more likely to be seen in children than in adults. Therefore, while in adults FC is used to distinguish IBD from IBS; in children, the aim is to distinguish IBD from non-IBD. This may partially explain why FC is highly sensitive but only moderately specific for the diagnosis of IBD in children. 6
Summary of faecal calprotectin concentrations in healthy children from previous studies.
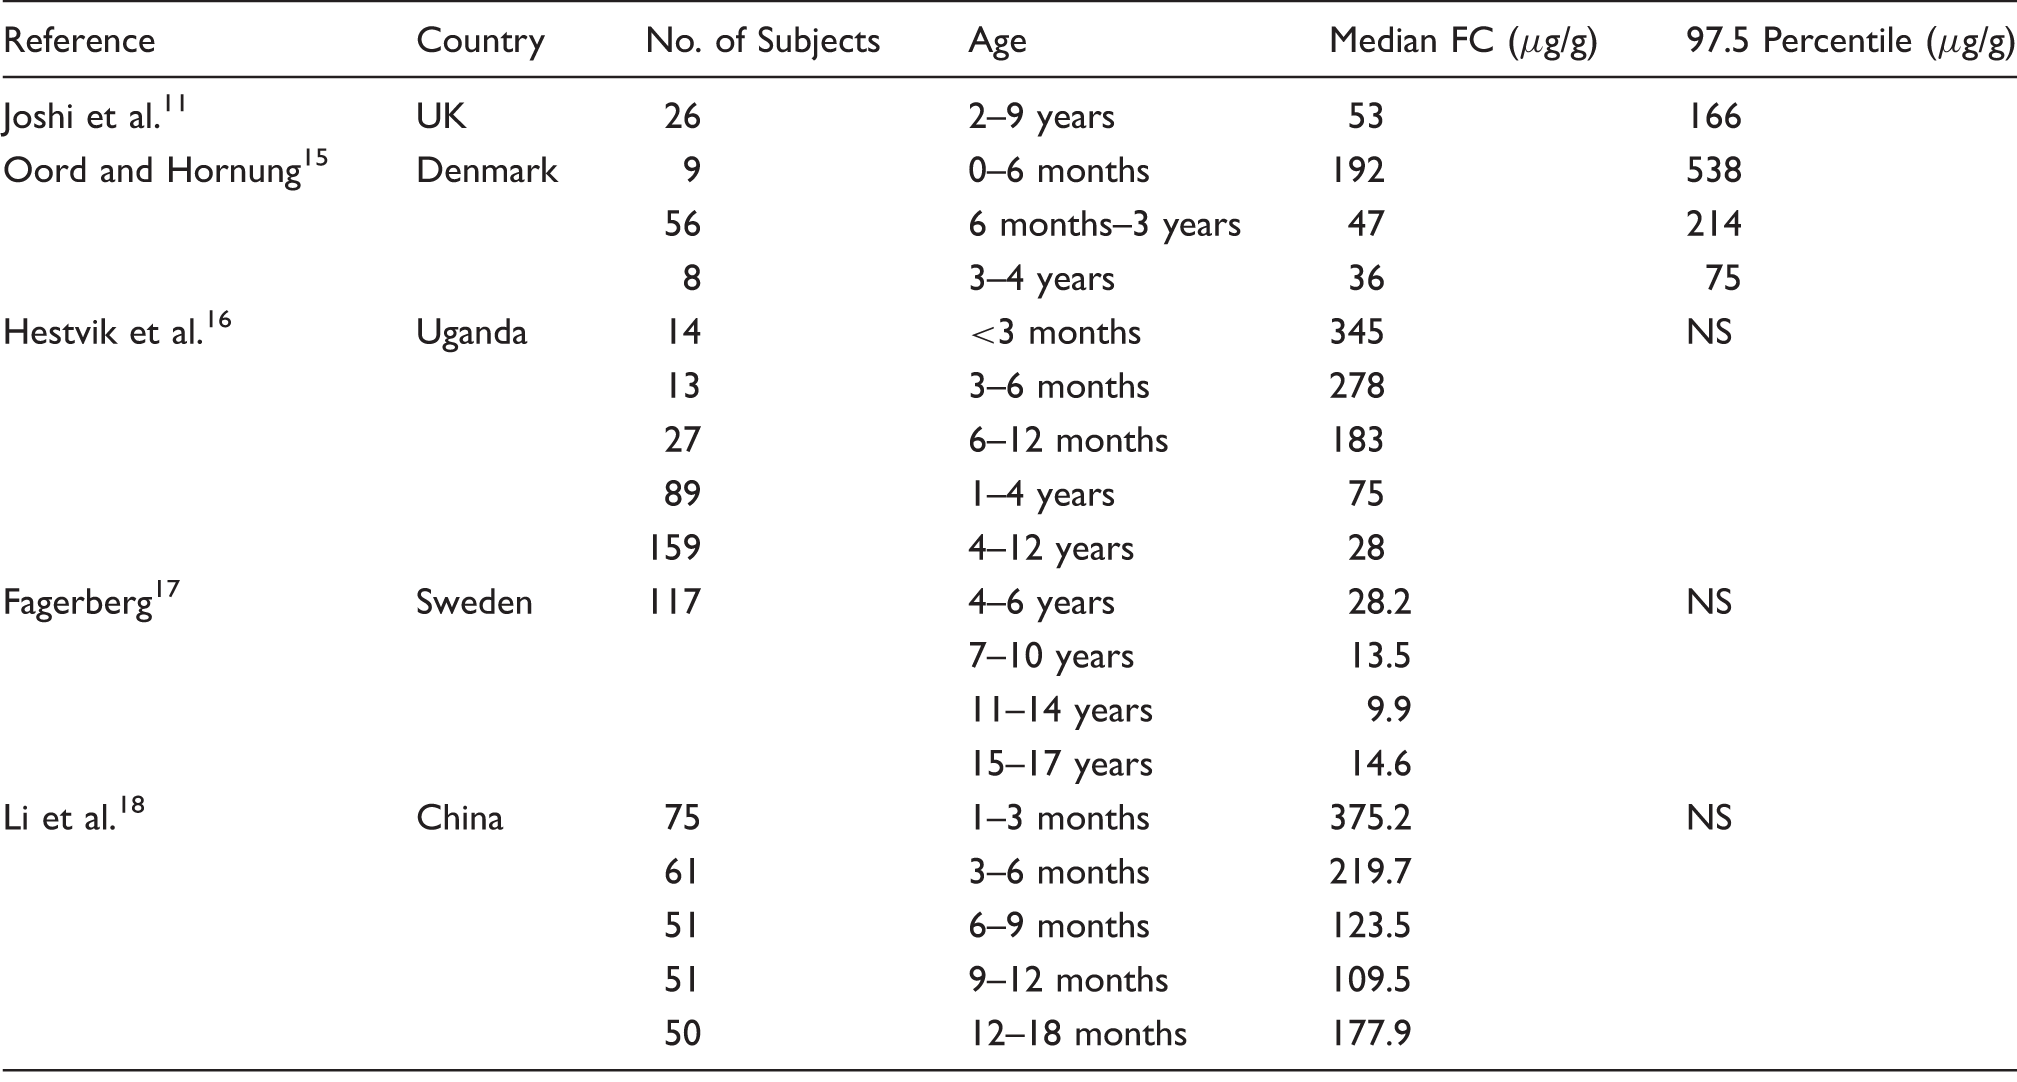
NS: not stated.
We provide a retrospective analysis of 8676 FC analyses used to establish upper limits of normal for a UK population.
Methods
Study group
All FC results from 2011 to 2014 were retrospectively collated for use in the study. This included samples from primary and secondary care as well as referrals from other laboratories in the area. Results were grouped into three age categories: 1–3.9 years (87 persons in group), 4–17.9 years (636 persons) and ≥18 years (7953 persons). These age categories were selected on the basis of evidence from the literature that FC reference ranges used in adults are also applicable in children above the age of 4 years.16,17
Analytical
Faecal samples were collected into a plain container and received in the laboratory at room temperature. The transit time of samples to the laboratory was not recorded, but we advise that samples are stable at room temperature for up to three days as recommended by the assay manufacturer. All samples were frozen at −20℃ on receipt and thawed prior to analysis. FC concentration was measured using a commercially available ELISA assay (Bühlmann Laboratories AG, Schönenbuch, Switzerland) according to manufacturer instructions.
Statistical
Statistical analysis was performed using the Analyse-it software for Excel, version 2.21 (Leeds, UK). Probability plots of the logged data were generated for each age group and the expected upper limits of normal calculated as described previously. 19 The Mann-Whitney test was used to determine whether each group was statistically different from the others. Results were considered statistically significant if P < 0.05.
Results
Probability plotting defined an upper limit of normal for adults of <61 µg/g, which is comparable with the manufacturers quoted range of <50 µg/g. A similar result was observed for children aged 4–17.9 years. However, the upper limit of normal in younger children was higher. Figure 1 demonstrates a break point at 77 – 87 µg/g. Using this analysis, the defined upper limit of normal was determined for each age group (Table 2). The 97.5th percentiles of the newly defined ‘reference’ populations were 75, 60 and 58 µg/g for ages 1–3.9, 4–17.9 and 18+ years, respectively.
Probability plot defining upper limit of reference range (vertical line) in persons aged 1–3.9 years. Faecal calprotectin concentrations from all samples received in our laboratory 2011–2014. Note: Upper limit of normal (ULN) calculated using probability plotting. FC: Faecal calprotectin.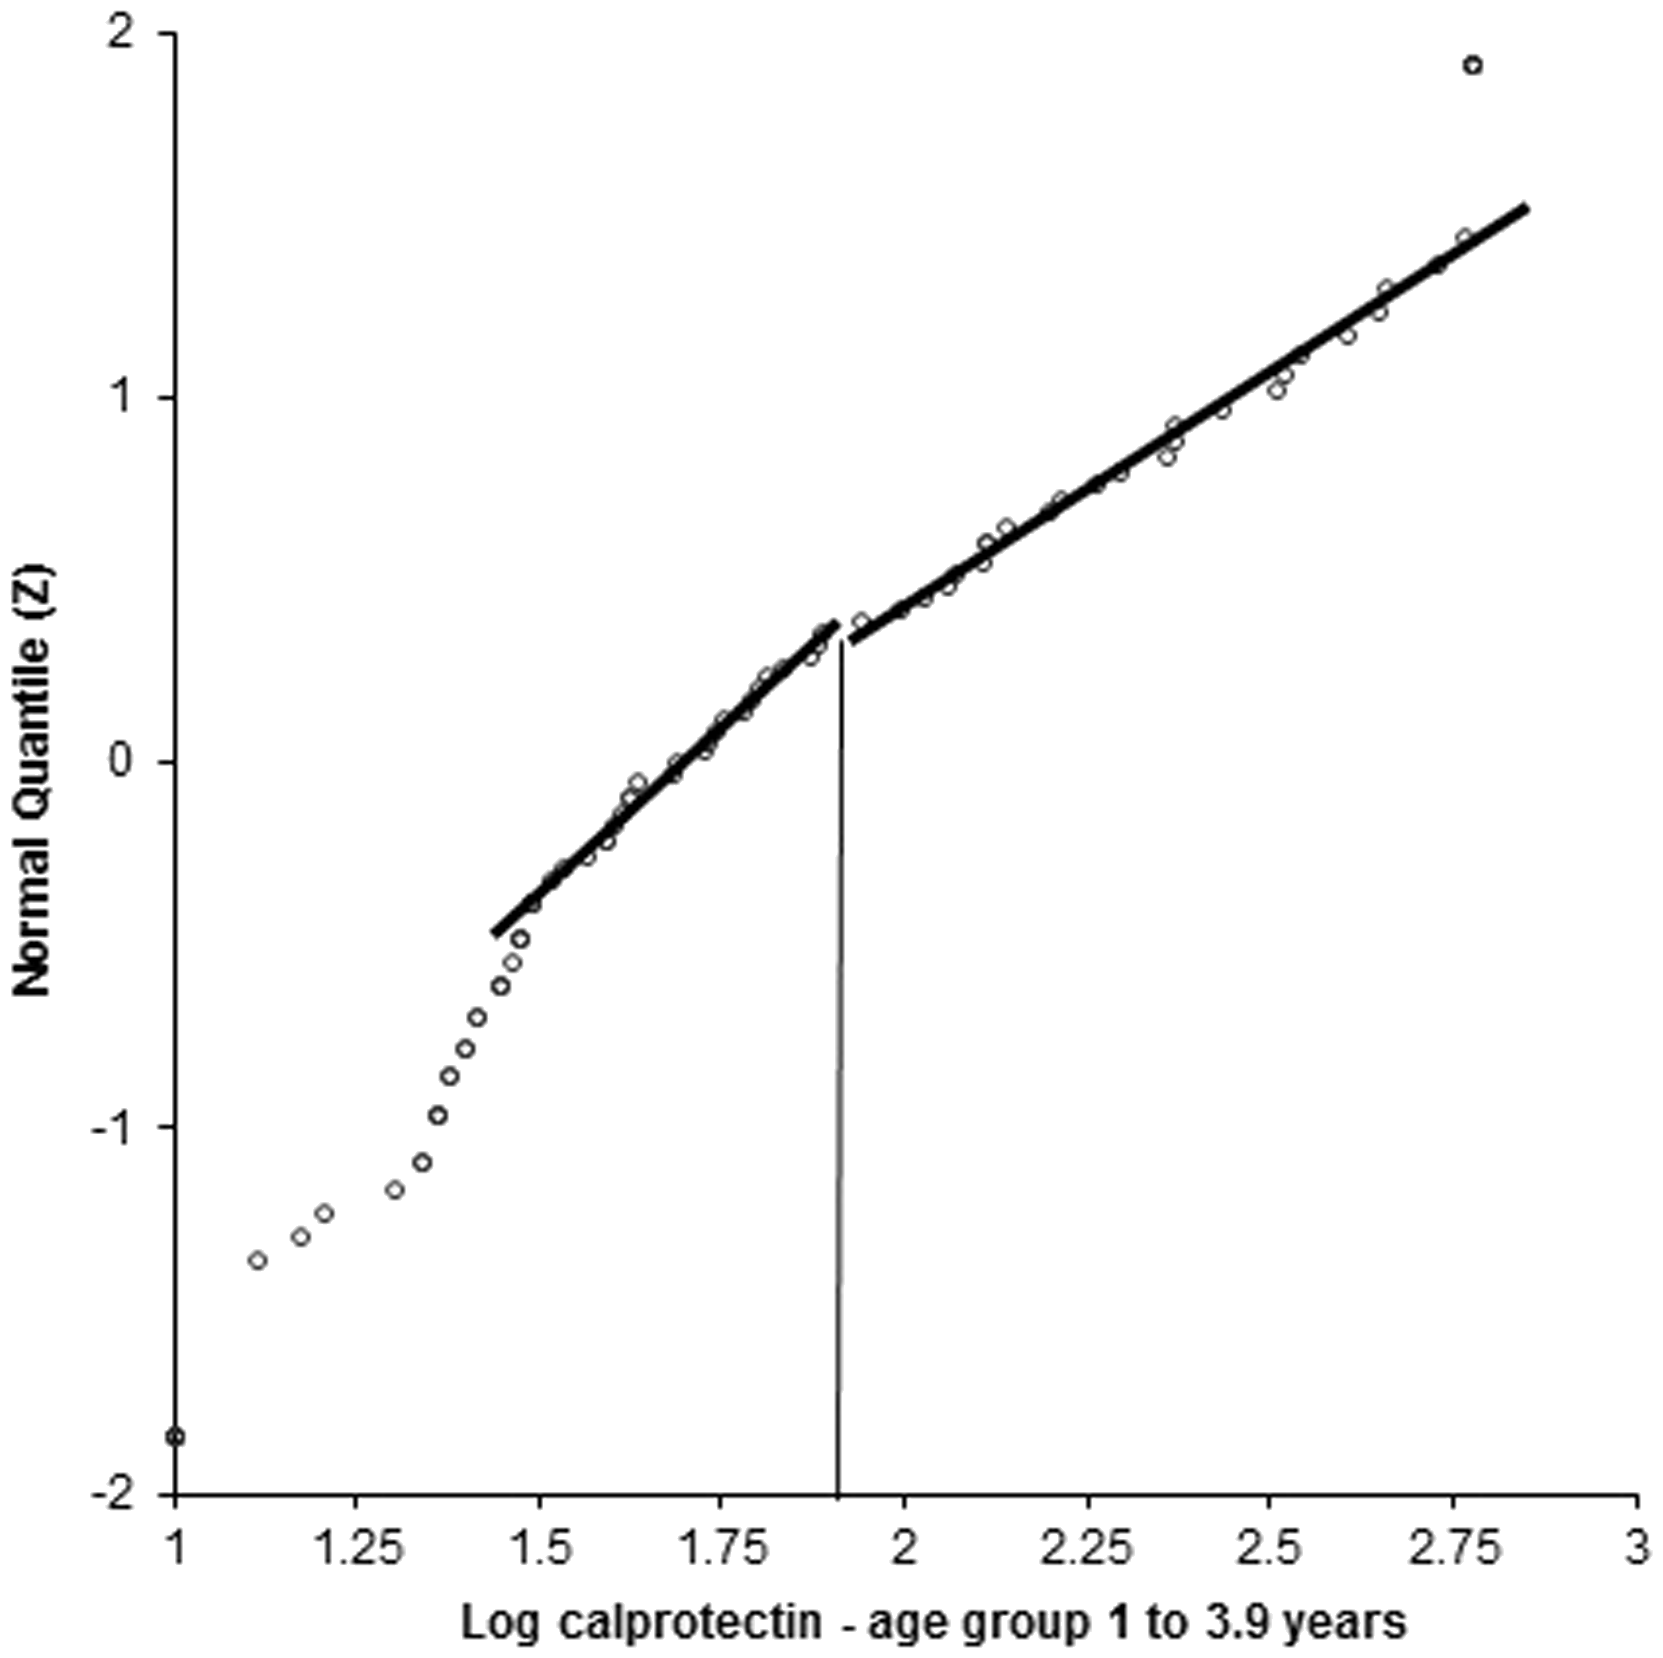
The median calprotectin concentration within the defined reference range for the age group 4 to 17.9 years was not significantly different from 18+ years (P = 0.4206). However, the median calprotectin concentration within the defined reference range for the age group 1 to 3.9 years was significantly different from both the 18+ years age group (P = 0.0001) and the 4 to 17.9 years age group (P = 0.0013). The distribution of concentrations in each group is shown in Figure 2.
Box plot of FC concentrations within the predicted reference range (as shown in Table 2).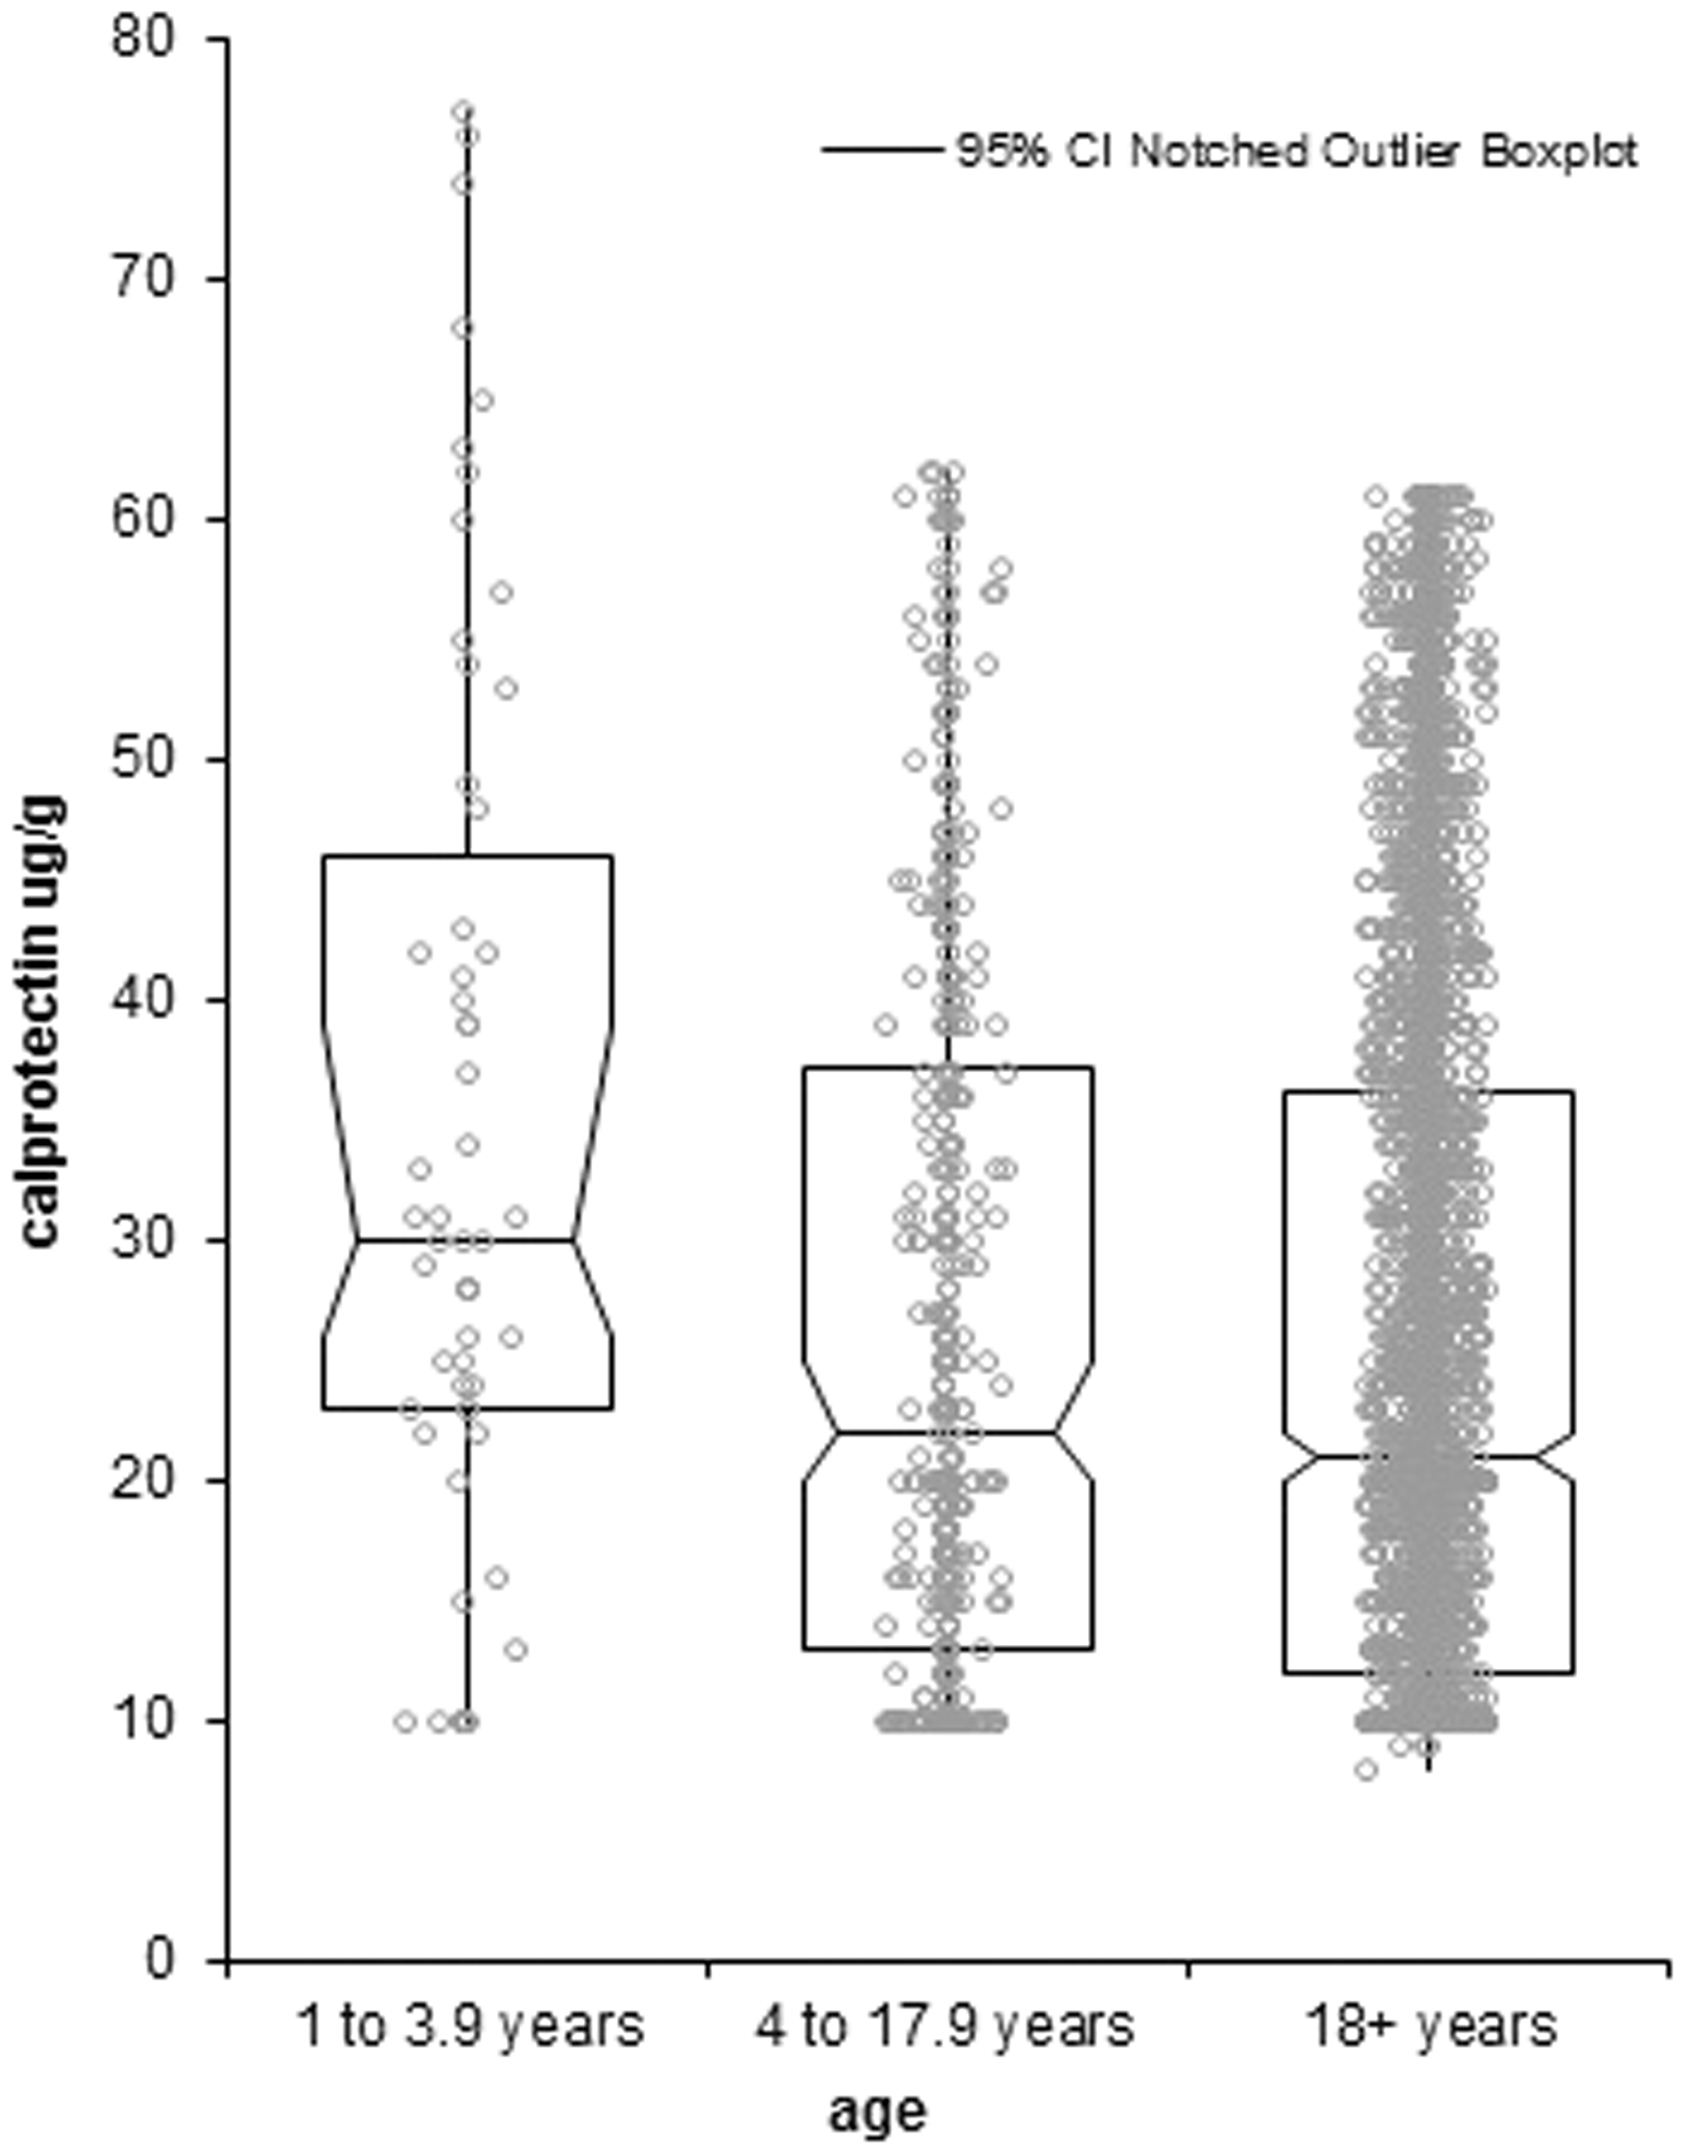
Discussion
There was no significant difference observed between patients in the age group 4–17.9 years and the adult population. This is in agreement with the evidence from the literature.
There are few published studies that have examined FC concentration in younger children (under 4 years), although most agree that FC concentration is significantly higher in this age group.11,15–18 Our study also showed that FC concentration was significantly higher in the 1–3.9 age group than the 4–17.9 and adult age groups. Of the studies quoted in Table 1, the two which look at age groups that are most comparable to ours are Hestvik et al. 16 and Oord and Hornung. 15 Hestvik et al. 16 looked specifically at the age group 1–4 years, which they found to have a median FC of 75 µg/g. This is comparatively higher than the median value of 49 µg/g found in this study. The difference may be due to the socio-economic disparity in the study populations; however, the median FC of the older age group in the Hestvik study is comparable to and certainly not higher than the median FC found from two other studies in children from developed countries of approximately the same age.11,17 Another possible source of variation may be in the methods used to measure FC. UK NEQAS data demonstrate an inter-assay CV of 50–60% in the ELISA method group. However, the Bühlmann assay used in this study consistently produces the highest results of the ELISA method group; thus, if there is an effect of comparing results from different assays, it would be that our results are actually relatively high. Therefore, the actual difference between the median FC observed by Hestvik et al. and our population may be much greater. Oord and Hornung on the other hand used the same Bühlmann assay as we did to measure FC. Although the age categories investigated by Oord and Hornung were set slightly differently to the ones in our study, the medians of both the six months to three years and 3–4 years age groups were higher than those calculated for the 1–4 years age group in our study. In particular, the 97.5th percentile of 214 µg/g calculated by Oord and Hornung for the age group six months to three years was much higher than we found in the not dissimilar age group of 1–3.9 years. Although the 97.5th percentile of the age group 3–4 years in the study by Oord and Hornung was the same as that which we found in the age group 1–3.9 years, our population did not have a disproportionate number of subjects at the top end of the age category (23 subjects age 3–4 years, n = 87 for age group 1–4 years). This suggests that the 97.5th percentile for Oord and Hornung’s subjects aged 1–4 years, though not reported, may reasonably be expected to be significantly higher than ours. Moreover, Oord and Hornung reported that there was no significant difference found between the medians and 97.5th percentiles of age groups 6–12 months and 1–2 years; therefore, the influence of the subjects aged 6–12 months is unlikely to account for the difference between our data and theirs. In summary, it can be concluded that the upper limit of normal of FC for children aged 1–3.9 years found in this study is considerably lower than has been suggested elsewhere.15,16 This is a surprising finding as this study used data from patients in a routine clinical setting who, by definition, have symptoms of bowel disease, whereas other studies have used healthy volunteers. Thus, it might have been expected that our upper limit of normal would be higher. Note, however, that our reference population is selected on the basis of probability plotting which removes those with high FC from the analysis. Earlier studies may not have effectively screened out the outliers.
We propose an upper limit of normal for children under the age of 4 years of 77 µg/g. However, further work is required to validate this value in healthy children and those with confirmed or suspected IBD. Furthermore, evidence from other studies suggests that there is an inverse relationship between FC concentration and age, and therefore more work is required to establish reference ranges across the age range from 0 to 4 years old. It was not possible to further subdivide the 1–3.9 year age group or establish an upper limit of normal in children less than 1 year old in the current study due to low numbers of subjects. This is an area of further research that we intend to revisit in the future with further accumulation of data in these age groups.
Conclusions
In conclusion, we found that expected FC concentration varies with age in our region, though to a much lesser degree than has been observed elsewhere. FC cut-offs used for the diagnosis of IBD in adults may safely be applied to children over the age of 4. However, the adult cut-off is unlikely to be appropriate for use in children under the age of 4.
Footnotes
Declaration of conflicting interests
The author(s) declared no potential conflicts of interest with respect to the research, authorship, and/or publication of this article.
Funding
The author(s) received no financial support for the research, authorship, and/or publication of this article.
Ethical approval
Not applicable.
Guarantor
FD.
Contributorship
FD researched the literature and wrote the first draft. Both authors agreed the study design. RJL interrogated the laboratory database and performed statistical analysis. Both authors read and approved the final draft.