
Abstract
Background
Glycated albumin is an intermediate glycaemic control marker for which there are several measurement procedures with entirely different reference intervals. We have developed a reference measurement procedure for the purpose of standardizing glycated albumin measurements.
Methods
The isotope dilution liquid chromatography/tandem mass spectrometry method was developed as a reference measurement procedure for glycated albumin. The stable isotopes of lysine and fructosyl-lysine, which serve as an internal standard, were added to albumin isolated from serum, followed by hydrogenation. After hydrolysis of albumin with hot hydrochloric acid, the liberated lysine and fructosyl-lysine were measured by liquid chromatography/tandem mass spectrometry, and their concentrations were determined from each isotope ratio. The reference materials (JCCRM611) for determining of glycated albumin were prepared from pooled patient blood samples.
Results
The isotope dilution–tandem mass spectrometry calibration curve of fructosyl-lysine and lysine showed good linearity (r = 0.999). The inter-assay and intra-assay coefficient of variation values of glycated albumin measurement were 1.2 and 1.4%, respectively. The glycated albumin values of serum in patients with diabetes assessed through the use of this method showed a good relationship with routine measurement procedures (r = 0.997). The relationship of glycated albumin values of the reference material (JCCRM611) between these two methods was the same as the relationship with the patient serum samples.
Conclusion
The Committee on Diabetes Mellitus Indices of the Japan Society of Clinical Chemistry recommends the isotope dilution liquid chromatography/tandem mass spectrometry method as a reference measurement procedure, and JCCRM611 as a certified reference material for glycated albumin measurement. In addition, we recommend the traceability system for glycated albumin measurement.
Keywords
Introduction
Glycated albumin (GA)
GA reflects shorter term glycaemic status than HbA1c, which reflects the average glycaemic control for the previous two to three months. GA reflects the average glycaemic status for the previous two to three weeks, and thus is suitable in cases where glycaemic control changes rapidly due to diabetic treatment. 1 GA is also a useful alternative glycaemic marker in patients with anaemia and variant haemoglobin, whose HbA1c values are inaccurate due to the altered lifespan of red blood cells.2,3
HbA1c also reflects lower values in haemodialysis patients because of the increase in immature erythrocytes associated with erythropoiesis stimulating agent treatment. 4 The Japan Society for Dialysis Therapy published a guide entitled ‘Guide: Best Practice for Diabetic Patients on Hemodialysis 2012’ 5 and recommended glycaemic control levels of no more than 9.99–11.1 mmol/L as a predialysis casual plasma glucose concentration and 20% as a GA value (24% for patients with a history of cardiovascular events and hypoglycaemic episodes).
There are numerous anaemic patients whose HbA1c values do not accurately reflect glycaemic control. There are reports that HbA1c values are higher in 50% of premenopausal female with iron deficiency anaemia. 6 In pregnancy, particularly in the later stages, HbA1c is higher independently of blood glucose concentrations because of the worsening iron deficiency. For this reason, GA is recommended as a glycaemic index in pregnant female. 7 It has been reported that the rate of abnormal haemoglobinaemia is 20% among African-Americans and in those living in countries near the Equator. For diabetic patients among such populations, GA may be a useful alternative glycaemic index to HbA1c.
One of the advantages of GA testing is that serum or plasma can be used for measuring samples, and thus can be analysed simultaneously with other analytes, making the test more cost effective. The Japanese Red Cross analyses GA together with ALT, γGTP, total cholesterol, albumin and total protein tests as part of its routine health checks of blood donors, performing 5 million tests a year. Thus, it is useful in screening of diabetes in Japan. 8
Standardization of HbA1c and GA
In 2010, the Japan Diabetes Society (JDS) decided to use the National Glycohemoglobin Standardization Program (NGSP) values, along with the JDS HbA1c values in clinical practice for the international clinical harmonization of HbA1c. At that time, each glycohaemoglobin measurement procedure targeted different glycation sites, and each country employed a different designated comparison method. In 2007, the American Diabetes Association, the European Association for the Study of Diabetes, the International Federation of Clinical Chemistry and Laboratory Medicine (IFCC) and the International Diabetes Foundation published statements confirming that a reference peptide mapping method of IFCC had been established for the HbA1c reference measurement procedure, and indicated that the HbA1c values for the NGSP and IFCC had been combined. At the same time, HbA1c was defined as a form of haemoglobin in which the N-terminal valine residue of the β-chain had been glycated. 9
In 1994, an HPLC method for GA was developed for clinical practice, but this time the most commonly used method is enzymatic methods. The affinity column and antibody assays for GA have also been developed. The maximum values for the reference intervals for each measurement method vary from 4 to 17%. 10 The GA measurement method used most widely around the world is an enzymatic method, and its GA value (%) is calculated by using an equation in which the same GA values as the HPLC method are obtained. This was to avoid confusion at clinical sites, but the GA value obtained by HPLC could not be used to conduct an absolute evaluation. We therefore started the GA standardization project at the Diabetes Mellitus Indices (DMI) Committee of the Japan Society of Clinical Chemistry (JSCC) in 2003. GA was initially defined as albumin containing lysine residues irreversibly bound to glucose, and a reference measurement procedure and reference material for GA were subsequently developed. 11
Methods
A human serum albumin molecule possesses 59 lysine (Lys) residues, and there are reports that four residues (Lys-525, Lys-199, Lys-281 and Lys-439) are major glycation sites. 12 Our studies showed that other lysine residues could also be glycated, and that the glycation rate for each lysine varied according to the diabetic status. Therefore, we first defined GA as albumin with glycated lysine residues, and then studied the optimum conditions of the isotope dilution liquid chromatography/tandem mass spectrometry (ID-LC/MS) method to determine the mole ratio of all the glycated lysine in the albumin molecule.
Studies on the reference measurement procedure for GA
Principles of GA value determination
The serum albumin fractions are hydrolysed and all of the released deoxyfructosyl lysine (DOF-Lys: Nɛ-1-deoxy-
This method is conducted by performing the following procedures.
Isolating albumin from the serum by using an ion-exchange column; Adding stable isotopes as internal standard substances; Stabilizing DOF-Lys by hydrogenation; Hydrolysing albumin with hydrochloric acid; Recovering related amino acid by drying under reduced pressure; Detecting the isotope ratio of DOF-Lys and lysine by LC/MS; Determining the total amount of DOF-Lys and the total amount of lysine in albumin fractions and calculating the GA value.
Isolating and rinsing albumin from blood samples
Five hundred microlitres of serum samples diluted threefold with the eluent were injected into an anion-exchange column (Shodex-Asahipak ES-502N 20C, Showa Denko Inc. Japan; 20 mm ID × 100 mm). The eluent was a 50 mmol/L glycine buffer solution with a pH of 8.5 and containing 220 mmol/L of magnesium chloride. The flow rate was 5 mL/min, and the albumin fraction (at a retention time of 5–7 min) was collected while monitoring at a wavelength of 280 nm. The collected fractions were concentrated to about 500 µL by centrifugation, using an Ultra filter (30 kDa cut-off), and the concentrate was rinsed with 10 mL of water, after which it was subjected to centrifuged rinsing twice. Finally, 500 µL of albumin (concentration of about 10 mg/g) was obtained.
The albumin sample separated from the serum exhibits a single peak in the HPLC using an anion exchange analytical column and a single band in the electrophoresis (Native PAGE). In both cases, the amounts of coexisting proteins, such as globulin and transferrin, were lower than the limit of detection. From these results, the purity of albumin in the sample is estimated to be at least 98%.
Reagents, stable isotopes and glycated lysine
Lysine (
Heptafluorobutyric acid (HFBA) for amino acid analysis, and acetonitrile for LC/MS were purchased from Wako Pure Chemical Industries, Ltd, Japan). The magnesium chloride, glycine, sodium hydroxide and sodium borohydride used should all be of special grade.
Preparing the calibration and stable isotope spike solutions
DOF-Lys and 13 C6-DOF-Lys were each prepared at a concentration of 50 nmol/g by adding water. These solutions were mixed at DOF-Lys/ 13 C6-DOF-Lys ratios of 0.5, 1.0, 1.5, 2.0 and 2.5, and the mixed solutions were used to prepare a calibration curve for glycated lysine quantification. In the same way, solutions of lysine and D4-Lys were prepared at a concentration of 10 μmol/g by adding water. These solutions were mixed at Lys/D4-Lys ratios of 0.8, 0.9, 1.0, 1.1 and 1.2, and the mixed solutions were used to prepare a calibration curve for albumin quantification. The 13 C6-DOF-Lys and D4-Lys mixed spike solutions were prepared at 50 nmol/g and 10 µmol/g by adding water. The reagents are stable for one week in the refrigerator, and for one year at -70℃.
Weighing and stabilizing of glycated lysine by hydrogenation
The concentrated fraction of albumin (100 mg), containing about 1 mg of albumin, and the mixed spike solutions (100 mg) were weighed precisely into a glass ampoule (borosilicate glass, code 051101; Nichiden Rika Glass Co., Ltd, Japan) and mixed carefully. After 1 h, 30 µL of 50 mmol/L sodium borohydride in 0.2 mol/L sodium hydroxide was added and placed for 3 h at room temperature mixing it occasionally to achieve hydrogenation.
It takes 20 h of incubation with 6 mol/L hydrochloride at 110℃ to complete the hydrolysis of albumin into amino acids. However, under these conditions, the DOF-Lys residues decompose. To prevent this from happening, the DOF-Lys residues were stabilized before the hydrolysis of albumin by converting the Nɛ-(1-deoxy-
Hydrolysing hydrochloric acid
Following hydrogenation, 400 µL of 10 mol/L hydrochloric acid (Kanto Chemical Co. Inc., Japan) was added to the glass ampoule, after which it was diluted with water to make 800 µL. After the release of hydrogen gas generated by the degradation of the excess sodium borohydride, the glass ampoule was purged thoroughly with nitrogen gas, and sealed with a gas burner under reduced pressure. The sealed glass ampoule was maintained for 20 h in a heater set at 110 ± 2℃, and the albumin was completely hydrolysed. After hydrolysis, the glass ampoule was opened and transferred to a centrifugal concentrator and drier, and the water and hydrochloric acid were removed completely in about 3 h under reduced pressure by heating to about 60℃ while centrifuging. The resulting dry residue of amino acid is to be dissolved in 500 µL of 0.08% HFBA, which is then to be transferred to a mini vial and used as the sample for LC/MS determination. This sample remains stable in a refrigerator for one month.
Determining DOF-Lys, lysine and their isotope-labelled products
ID-LC/MS analysis was conducted using an LC-MS-2010EV (Shimadzu Corporation, Kyoto, Japan) equipped with an ODS column for LC-MS Shim-pack VP-ODS (2 mm ID × 150 mm; Shimadzu Corporation).
The conditions for LC were as follows: Eluent A (0.08% HFBA); eluent B (acetonitrile); time programme: 3% eluent B (0 min), 8% eluent B (8 min), 80% eluent B (8.1 min), 80% eluent B (10 min), 3% eluent B (10.1 min) and STOP (22 min); flow rate: 0.2 mL/min; injection volume: l μL; column temperature: room temperature.
The conditions for MS analysis were as follows: Ionization mode ESI+; nebulizer gas N2 1.5 L/min; drying gas N2 0.1 MPa; applied voltage +4.5 kV; desolvation tube temperature 260℃; heat block temperature 200℃; analytical mode SIM (m/z 311, 317, 147, 151). To quantify GA, areas of the SIM peaks with m/z 311 for DOF-Lys and m/z 317 for the 13 C6-DOF-Lys stable isotope (proton-added hexytol lysine group) were determined. To quantify albumin, areas of SIM peaks with m/z 147 for lysine and m/z 151 for the D4-lysine stable isotope (proton-added lysine group) were determined.
The measurement of the samples is to be conducted in the following orders: (1) Solution for LC/MS calibration: five levels, (2) control: two 1evels, (3) unknown serum sample: up to 20 specimens, (4) control: two levels, (5) solution for LC/MS calibration: five levels.
Comparing with routine measurement procedures
Forty-four patient serum samples were evaluated by this method and by a routine enzyme method 15 with a reagent for GA determination (Lucica GA-L; Asahi Kasei Pharma, Tokyo Japan), and the GA values were compared.
The routine enzymatic method is as follows: (1) Serum or plasma samples are treated with ketoamine oxidase to remove free glycated amino acid; (2) samples are treated with albumin-specific proteinase to obtain glycated amino acids or peptides and (3) glycated amino acid or peptides are incubated with ketoamine oxidase to yield hydrogen peroxide, which is chromogenically quantified using N,N-bis (4-sulfobutyl)-3-methylaniline, disodium salt, and peroxidase.
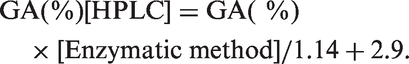
The albumin concentration in the same samples was determined using the more albumin-specific-modified BCP method. The GA% was calculated as the ratio of the GA value to albumin. In addition, the GA values obtained using these routine measurement procedures were converted to the original HPLC values. The relationship between the GA% calculated by the enzyme method and the GA% obtained by the original HPLC method is as follows
Calculating the GA values by using the ID-LC/MS method
The concentrations of DOF-Lys (Cd, nmol/g) and total lysine (CLys, µmol/g) were determined, and then calculated by using the following formula. Fifty-nine is the number of lysine residues present in a human serum albumin molecule

Reference materials with three different concentrations (JCCRM611, M, H and HH) for determining GA were set up by Reference Material Institute for Clinical Chemistry Standards (ReCCS, Kanagawa, Japan). They were prepared from pooled patient blood samples according to the specifications defined by the Committee on DMI of JSCC.
Results
To completely hydrolyse albumin with hydrochloric acid, 6 mol/L hydrochloric acid kept at 110℃ for 20–24 h has been widely used. In this study, a range of hydrolysis conditions were investigated in order to identify the optimal conditions. The peak area for ionized Lys (m/z 147) derived from albumin reached a plateau when the concentration of hydrochloric acid was greater than 4 mol/L, and thus suggests the complete hydrolysis of albumin to amino acids. The area of the SIM peak for D4-Lys stable isotope (m/z 151) did not change, regardless of the hydrochloric acid concentration. These results suggest that D4-Lys stable isotope is stable during hydrolysis by hydrochloric acid, even at a high temperature. For this reason, the albumin concentrations would be more accurately quantified using the present method when compared with conventional measurement procedures in which the albumin concentration is estimated from the peak area of lysine obtained after the hydrolysis of albumin with hydrochloric acid at above 4 mol/L.
In the current procedure used, the DOF-Lys residues in albumin are converted to hexytol-Lys by hydrogenation, which is quantified after hydrolysis. The peak area of hexytol-Lys decreases with the increase in the concentration of hydrochloric acid or the incubation time. Thus, it is difficult to directly quantify the absolute amount of hexytol-Lys derived from albumin after hydrolysis. However, the ratio of peak hexytol-Lys area to the peak area of stable isotope-labelled 13 C6-hexytol-Lys was constant when albumin was hydrolysed with hydrochloric acid at 4 mol/L or greater, and was not affected by the incubation time in the presence of 5 mol/L hydrochloric acid. These results suggest that hexytol-Lys and the stable isotope-labelled 13 C6-hexytol-Lys added to the sample degrade at the same rate during hydrolysis, and that the ratio of peak areas for these compounds can be used to determine the hexytol-Lys derived from albumin.
The mass spectrum of the hydrochloric acid hydrolysates for the stable isotope-spiked albumin sample in LC/MS determination is shown in Figure 1. The peak for hexytol-Lys derived from albumin (m/z 311), the peak of m/z 317 derived from the stable isotope, the peak of m/z 147 derived from albumin with protonated lysine and the peak of m/z 151 derived from stable isotope are all observed.
Mass spectra of hexytol lysine and lysine in LC/MS determination. Sample: Hydrochloric acid hydrolysate of hydrogenated albumin after the spiking of respective isotopes.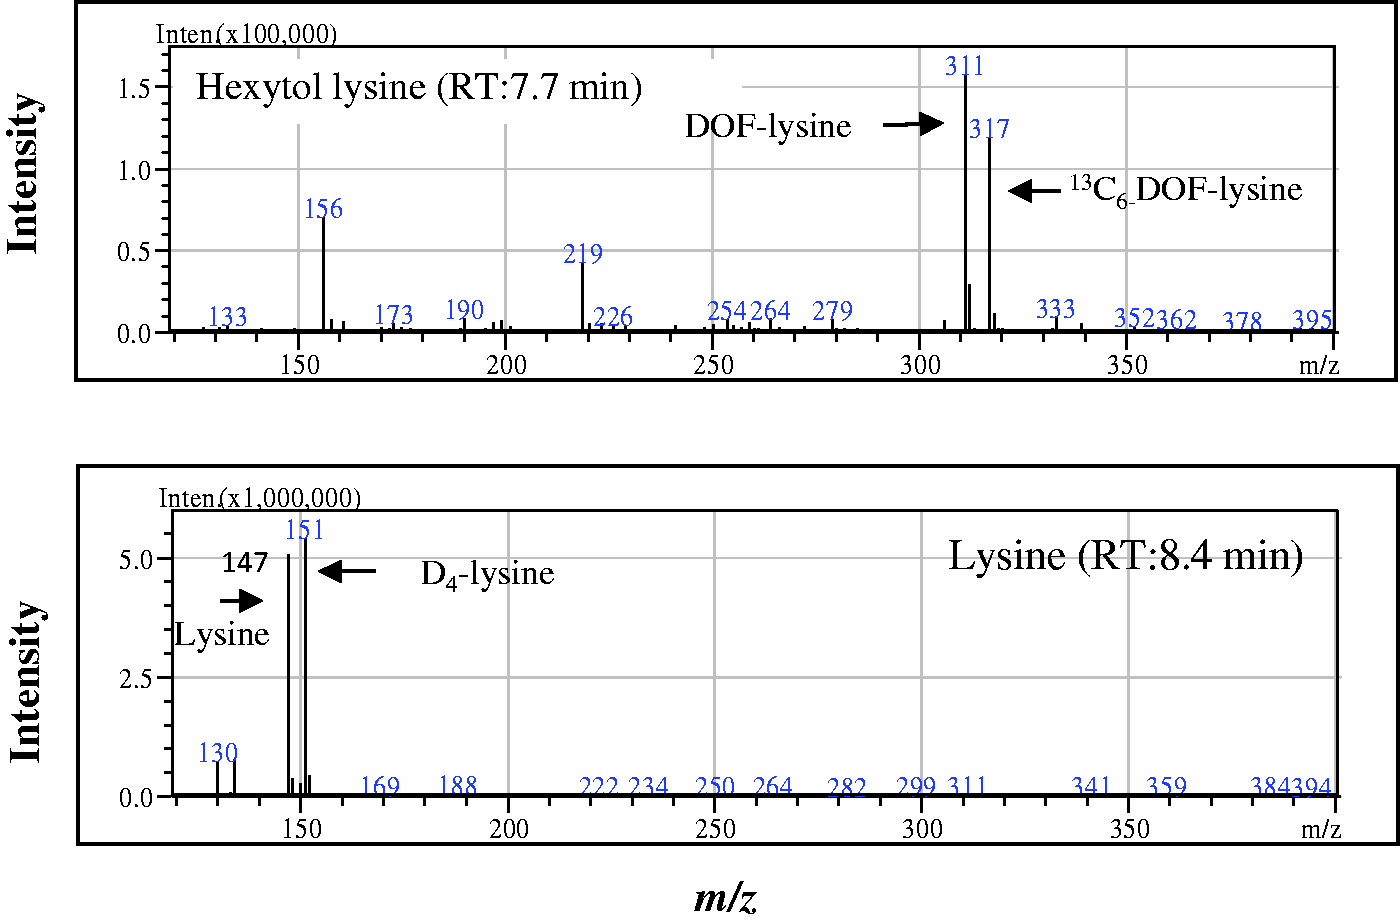
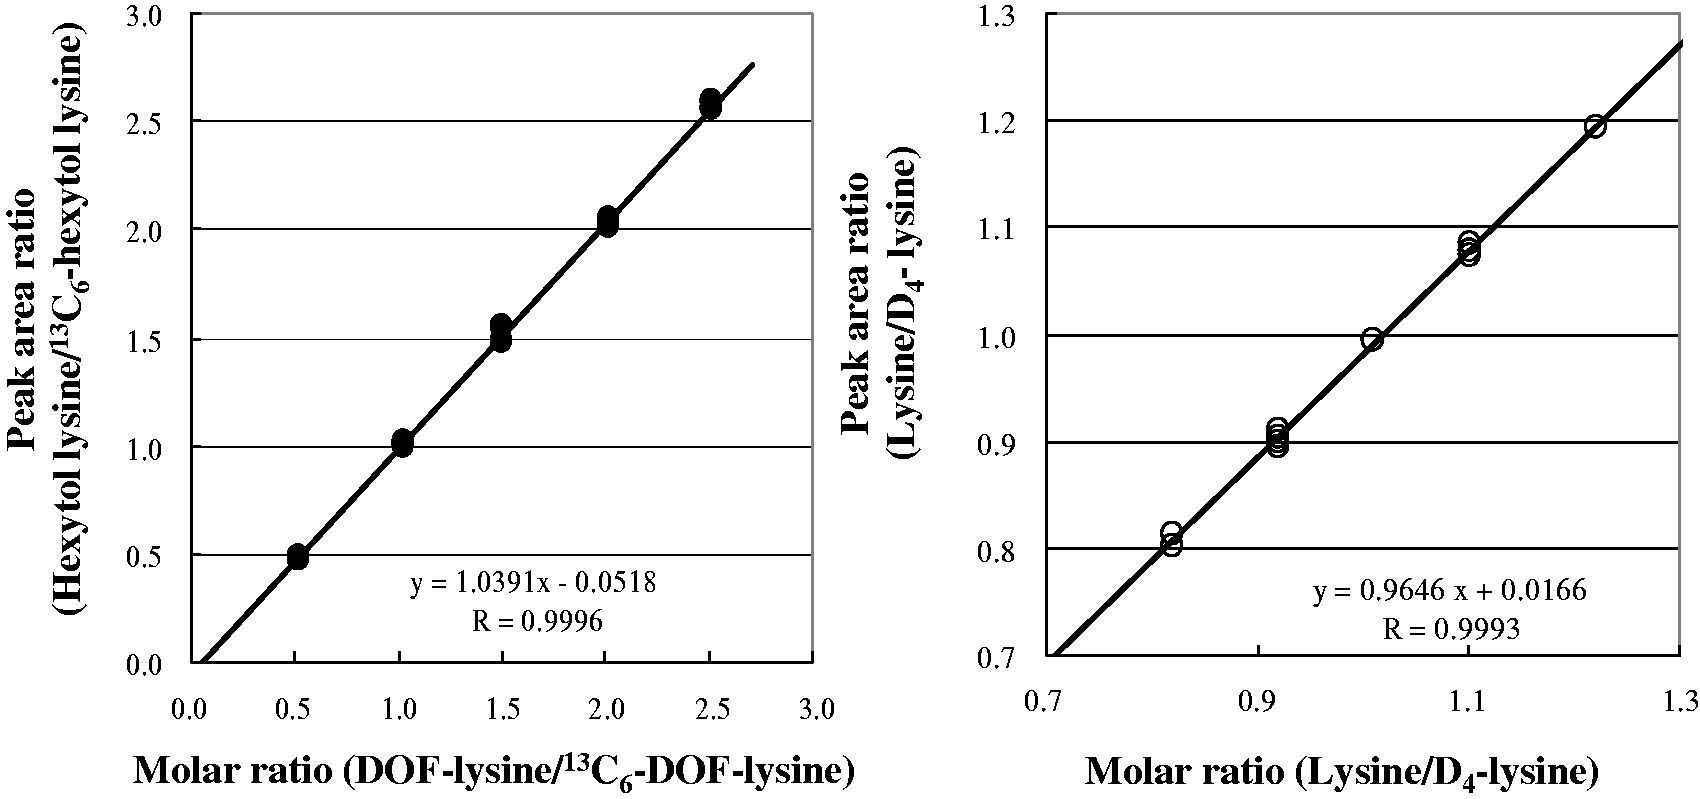
The SIM mass chromatogram of hydrochloric acid hydrolysate for the stable isotope-spiked albumin sample in LC/MS determination is shown in Figure 2. The minor peak seen after the main peak was not identified. The peak intensity was similar in all samples and was not correlated with the main peak intensity. An example of the ID-MS calibration curve for DOF-lysine and lysine determined by using the solution for LC/MS calibration is shown in Figure 3. Both calibration curves show good linearity, with a correlation coefficient of over 0.999 between the molar ratio of the solution for calibration and the peak area ratio of LC/MS.
SIM mass chromatograms of hexytol lysine, lysine and the respective isotopes in LC/MS determination. Sample: The minor peak after the main peak is the unknown peak observed in all the samples at a similar intensity, but there is no effect on the intensity of the main peak. Calibration curves of DOF-lysine (a) and lysine (b) determined by the ID-MS method. The solution for the LC/MS calibration of the respective molar ratio was determined twice for each.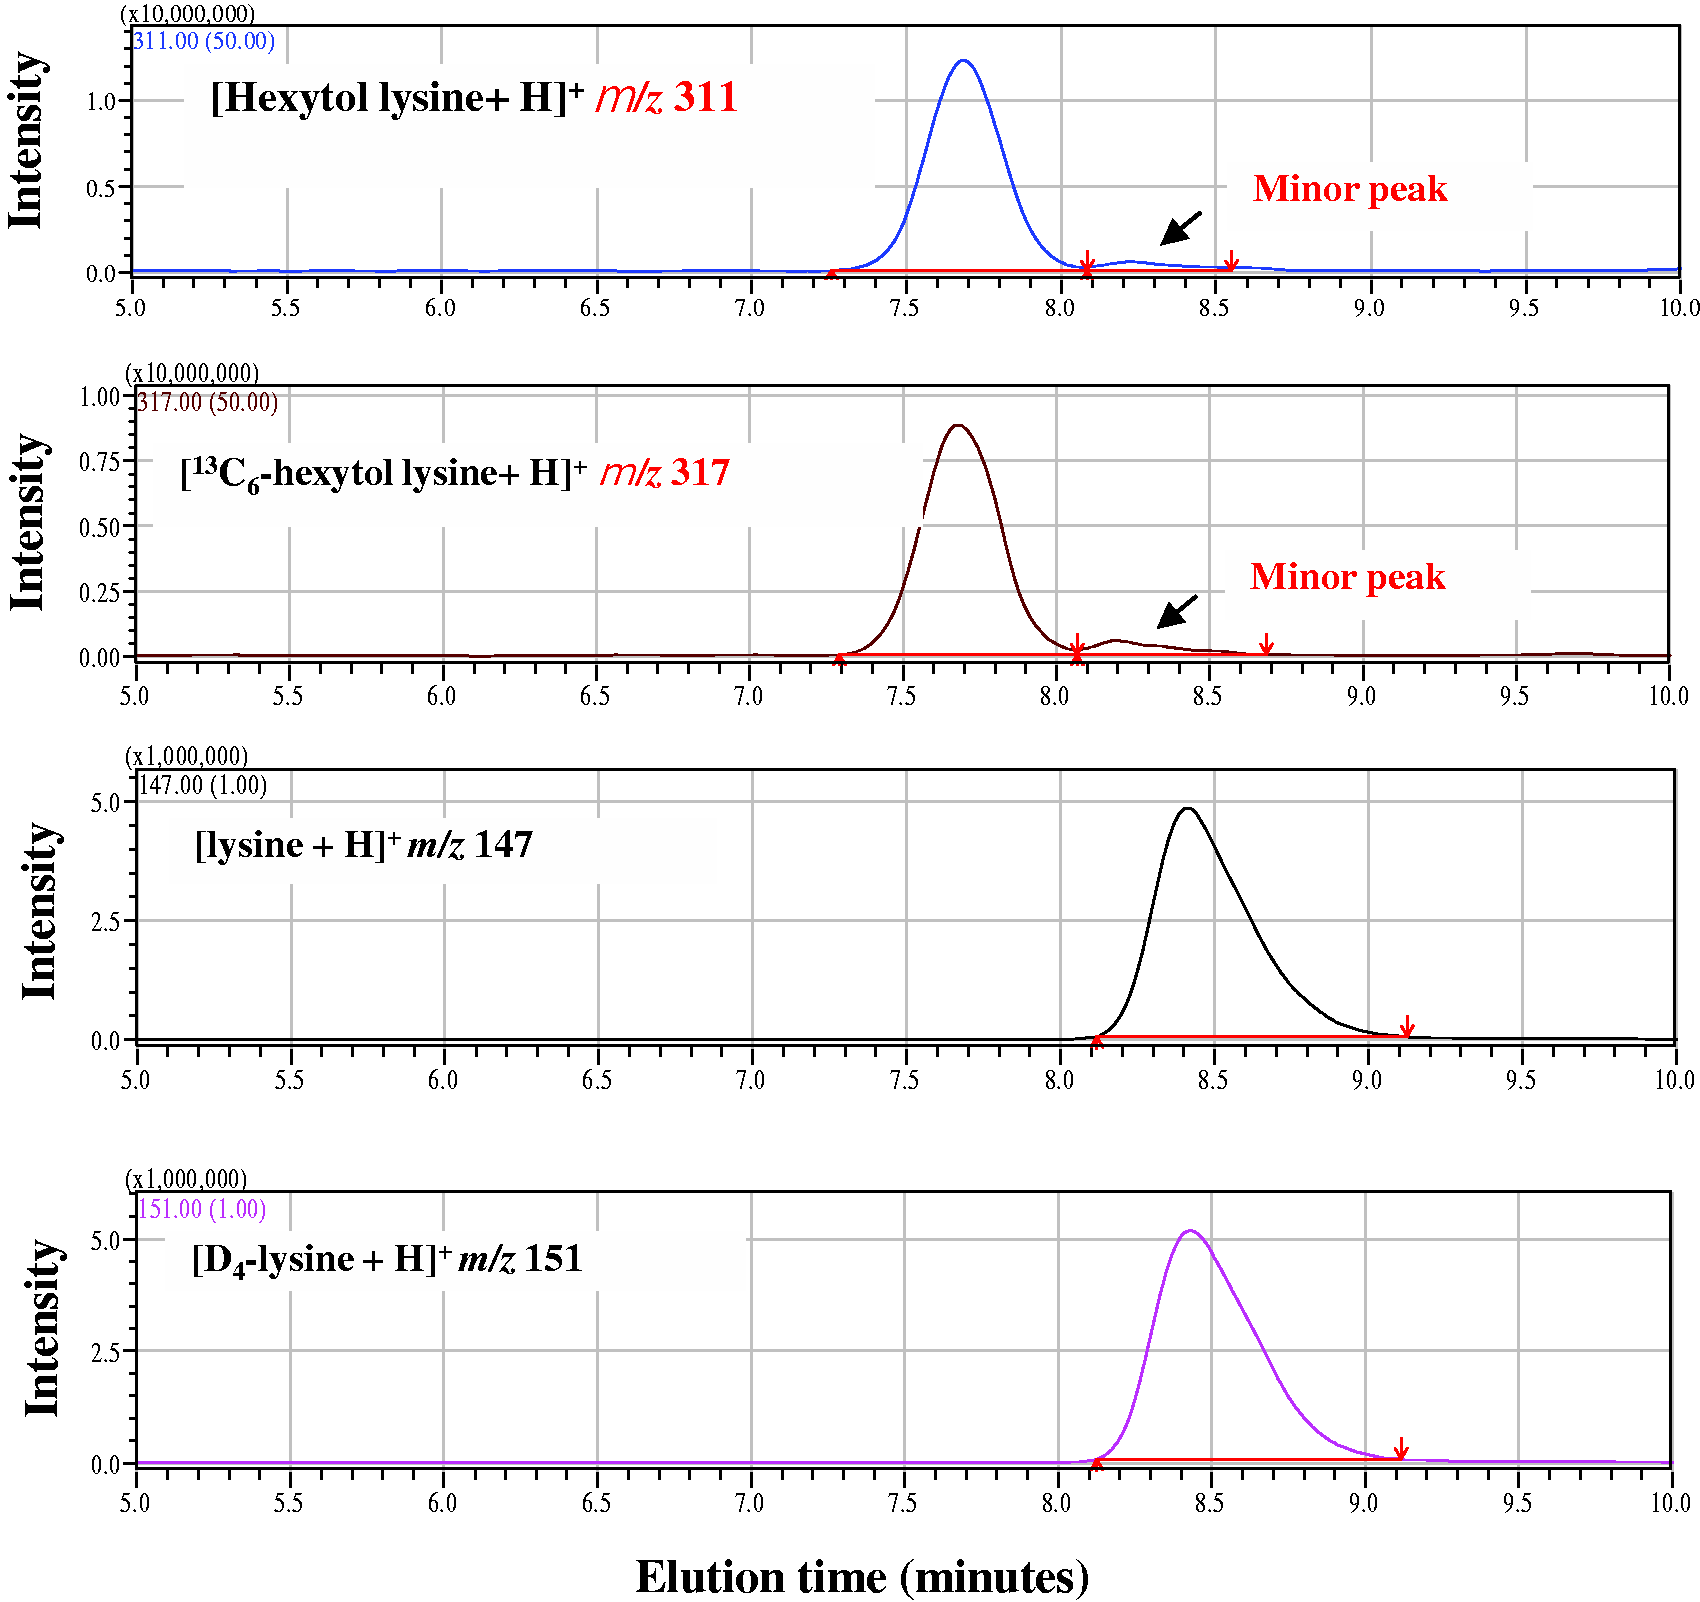
The reproducibility of the GA values was also examined. The repetitive determinations of GA values using the same sample obtained by this method revealed a high within-run reproducibility of CV = 1.2% (n = 10) and a high daily reproducibility of CV = 1.4% (once a day determination for 15 days). These results suggest that the GA values obtained by the present procedure are highly reproducible.
Forty-four patient serum samples were measured by ID-LC/MS and a widely used routine enzymatic method. The correlation coefficient between these two methods was good (r = 0.997). Additional large-scale studies are required to develop a correlation equation between these two methods.
Characteristics and specification of reference material for GA measurement.
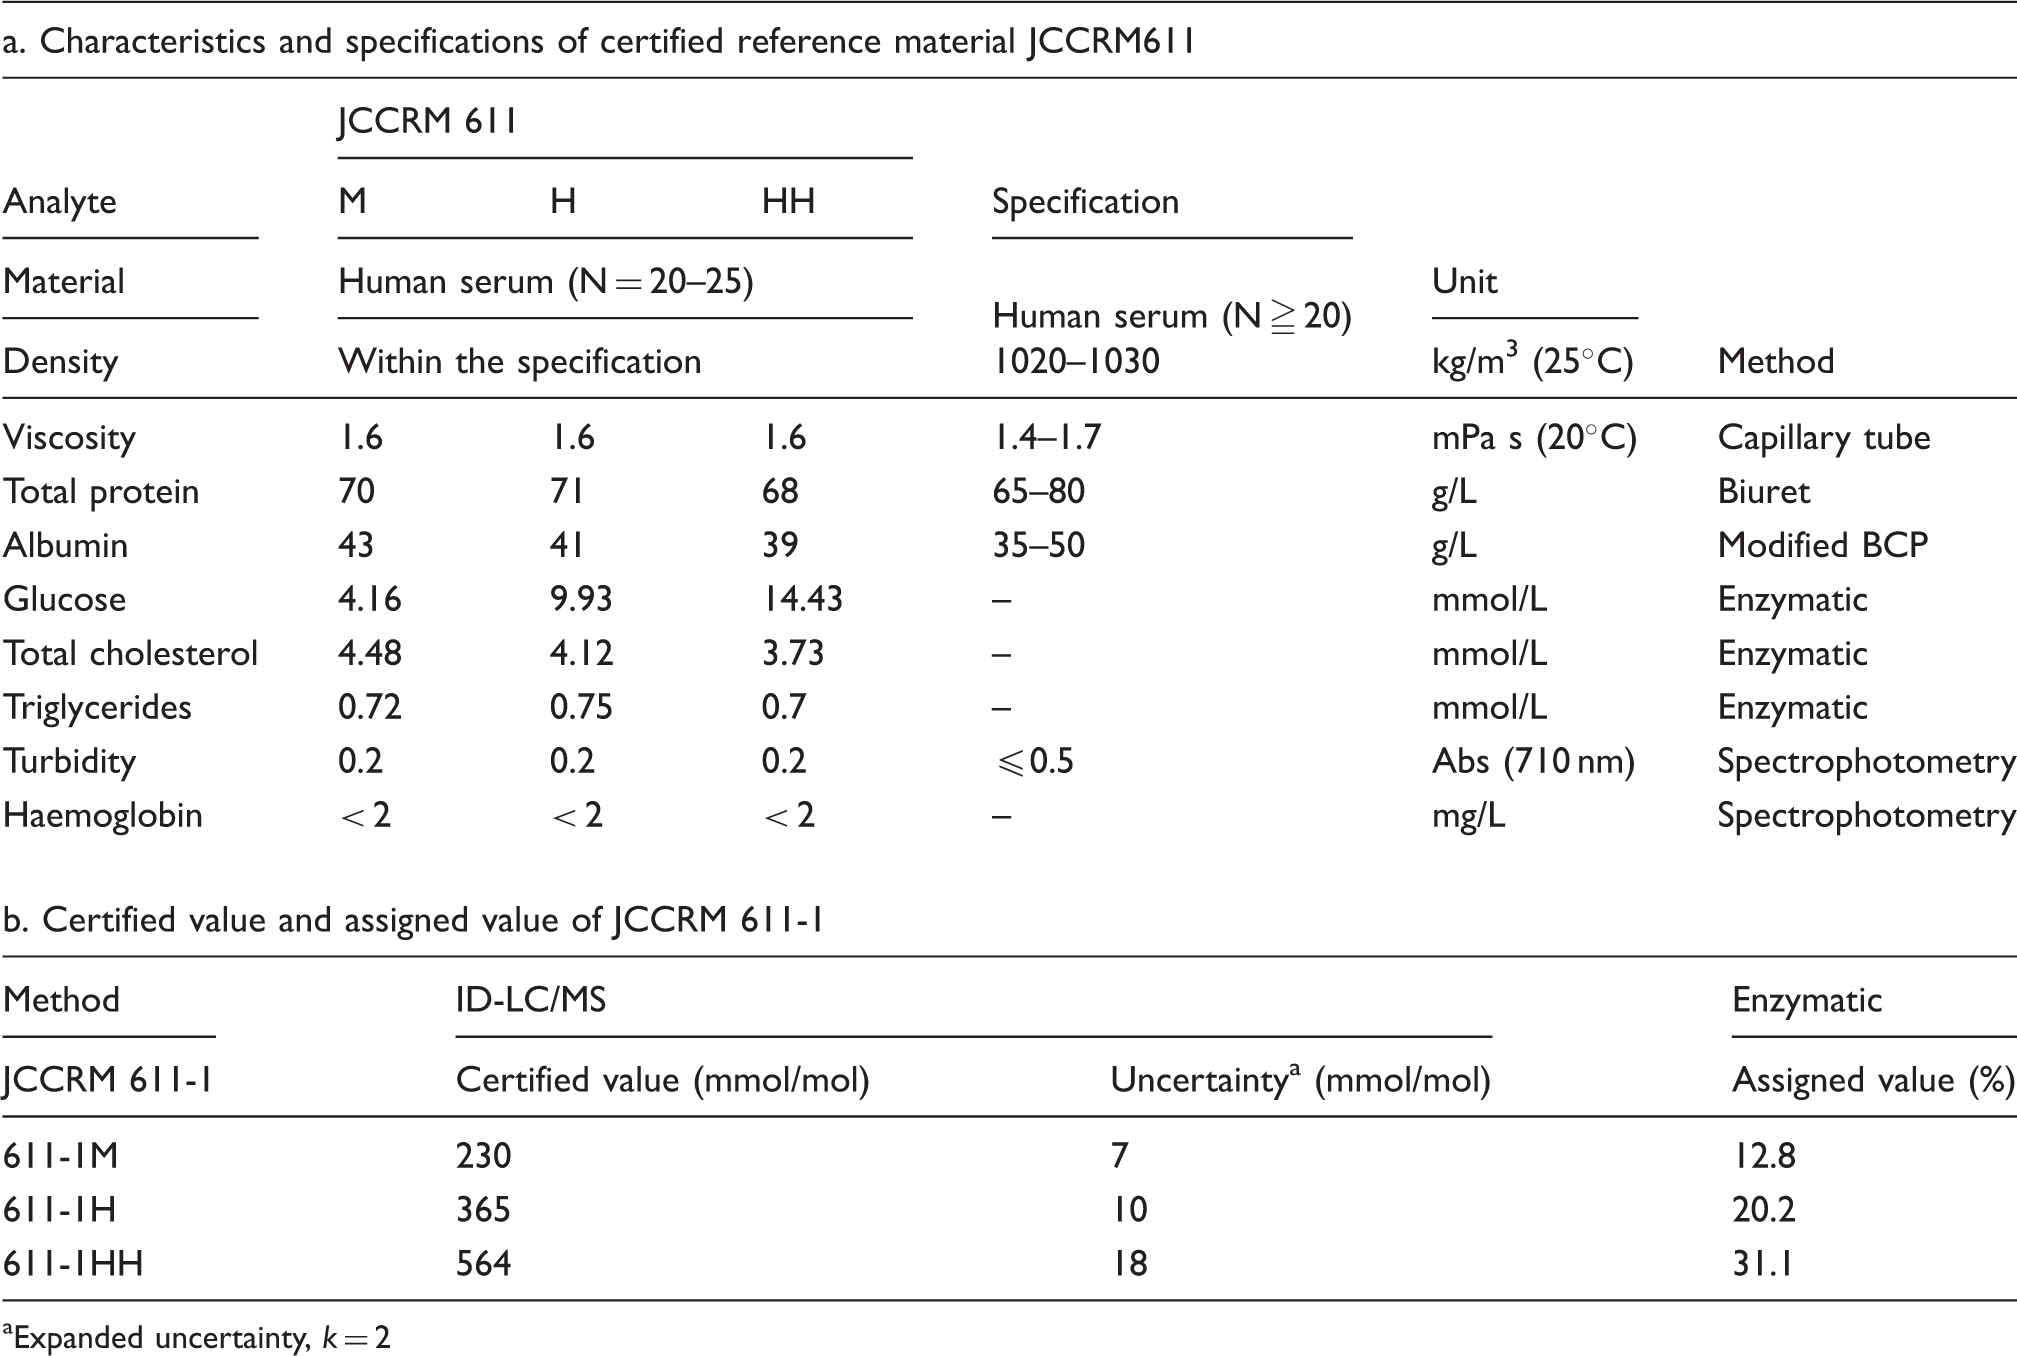
Expanded uncertainty, k = 2
Figure 4 shows the calibration hierarchy and methodological traceability of GA measurement.
Calibration hierarchy and metrological traceability of glycated albumin measurement. ARML: Accredited Reference Measurement Laboratory; ML: manufacturer’s laboratory; ReCCS: Reference Material Institute for Clinical Chemistry Standards.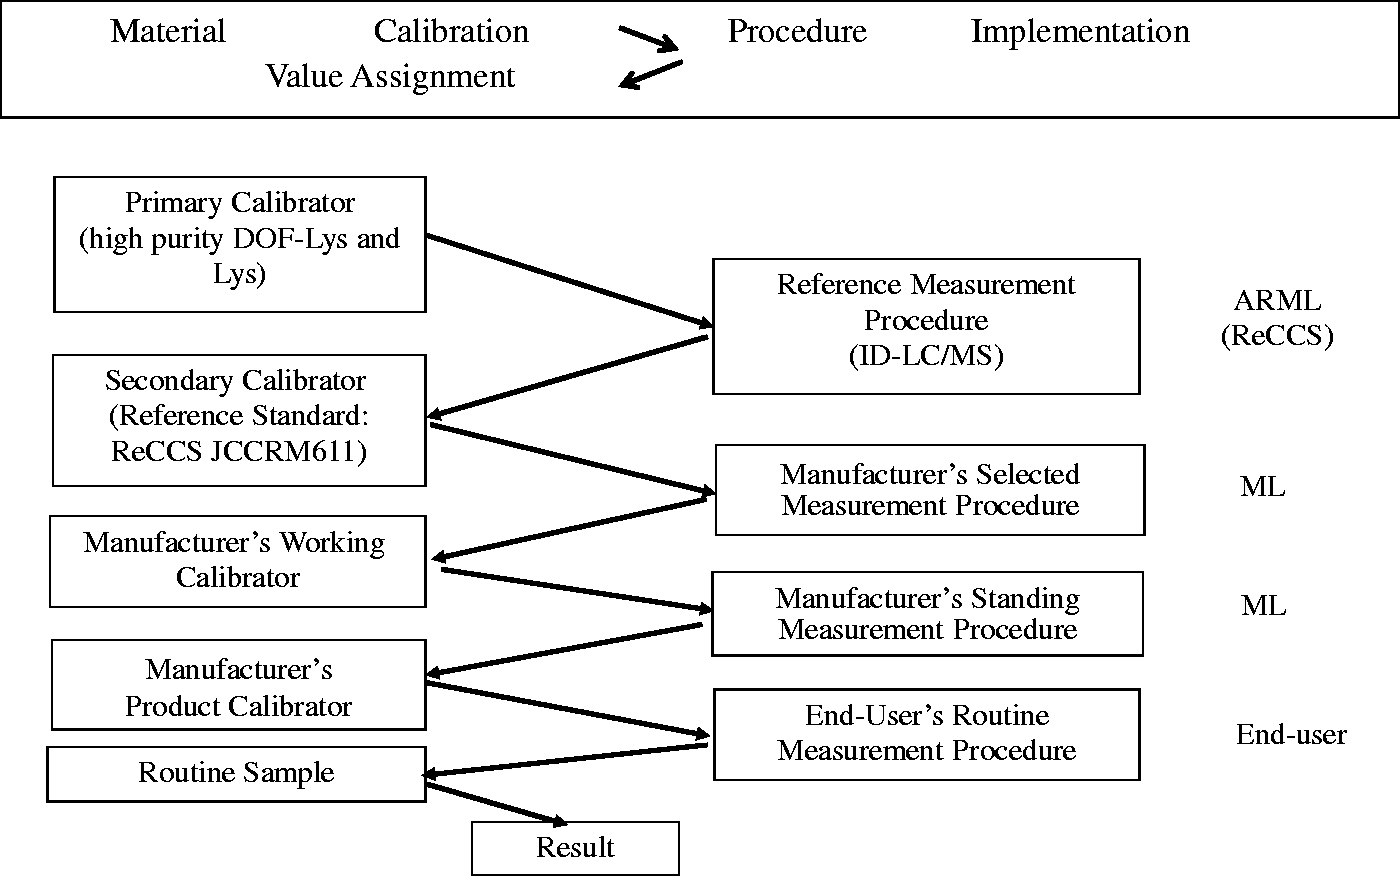
Discussion
First, the quantitative analysis of glycation at Lys-525, a major glycation site of albumin, was performed as a reference measurement procedure for GA evaluation. The reason for conducting quantitative analysis first is that HbA1c is defined as a haemoglobin β-chain with glycated valine residues at its N-terminal, and its quantification is based on the glycation concentrations of these valine residues. It is known that the Lys-525 residue is the major glycation site of the 59 lysine residues in the albumin molecule. However, the glycation rate at this residue is less than 50% of all the lysine residues in the albumin. In the present study, GA was defined as ‘albumin containing lysine residues bound to glucose DOF-Lys’, and we investigated the optimum measurement procedure to quantify the total glycated lysine in the albumin molecule.
The present procedure is highly accurate and highly reproducible, despite being based on the ID-LC/MS method, a complex measurement technique. There is a strong correlation between the GA values obtained by this method and the GA values obtained by a widely used enzymatic method (r = 0.997). We propose the present ID-LC/MS as the reference method for a traceable means of GA standardization. It will be possible to compose the methodological traceability chain for GA expressed in terms of mmol/mol (Figure 4).
Several methods for GA measurement are currently used in clinical practice, and the GA values vary greatly for each method. If GA is to be widely used as a marker, the measurement values must be standardized and expressed in SI units of mmol/mol.
In conclusion, the DMI Committee of JSCC recommends the ID-LC/MS as a reference measurement procedure, and JCCRM611 as a certified reference material for GA measurement. Furthermore, we recommend the traceability system for GA measurement.
Footnotes
Acknowledgements
We would like to express our appreciation to Yoshihiro Hishinuma, Maki Sato and Eri Shimizu for their assistance in this study. We would also like to thank the Reference Material Institute for Clinical Chemistry Standards (ReCCS) for corroborating of the results.
Declaration of conflicting interests
TK is an employee of Asahi Kasei Pharma Co., Ltd. There is no conflict of interest with other authors.
Funding
The authors received no financial support for the research, authorship, and/or publication of this article.
Ethical approval
No ethical approval was required for this study.
Guarantor
TK.
Contributorship
IT, TH and MT managed and organized this study for the JSCC project. MI and KK conceived the study and contributed to discussions. WT contributed to the development of the new ID-LC/MS method for glycated albumin, and MO studied the glycation sites of albumin, TK supported the study of WT and MO. MU and KY wrote the first draft of the manuscript, edited it and discussed it. AS contributed to the discussions about the manuscript. All authors reviewed and edited the manuscript, and approved the final version.