
Abstract
Background
The soluble form of the receptor for advanced glycation end-products (sRAGE) has been studied in various diseases. It is not clear why sRAGE levels vary between studies, with controversial results. What also remains to be determined is whether receptor for advanced glycation end-products (RAGE) ligands could affect sRAGE assessment by epitope masking. Recently described anti-sRAGE autoantibodies may play an interfering role. The aim of this study was therefore to investigate the influence of RAGE ligands and anti-sRAGE autoantibodies on sRAGE quantification.
Methods
The RAGE ligands carboxymethyllysine (CML; AGEs with a high affinity for RAGE), S100 proteins, high-mobility group protein B1 (HMGB1) and β-amyloid peptide (aβ) were tested by enzyme-linked immunosorbent assay (ELISA) with recombinant sRAGE (rHu-sRAGE) or serum from healthy controls. Using ELISA, anti-sRAGE autoantibodies (IgGs) were identified in haemodialysis (HD) patients, then purified and incubated with rHu-sRAGE or serum to investigate their effects on sRAGE levels.
Results
RAGE ligands, either alone at three different concentrations (CML was also tested at different glycation levels) or a mixture of all these ligands, did not affect sRAGE levels when incubated with rHu-sRAGE or control serum. Compared with healthy controls, HD patients had higher levels of sRAGE (P < 0.001) and anti-sRAGE IgGs (P < 0.05). However, incubation of rHu-sRAGE with purified IgGs from HD patients had no effect on sRAGE quantification.
Conclusions
RAGE ligands or anti-sRAGE autoantibodies did not interfere with sRAGE quantification. Further studies are required to elucidate the variability in sRAGE levels reported in the literature and to define the potential of sRAGE for use as a reliable biomarker.
Introduction
Metabolic and inflammatory disorders constitute a major health problem, and thus an additional socio-economic burden, and are among the leading causes of mortality and morbidity throughout the world.1–5 Although much progress has been made in the fields of prognosis and diagnosis, effective and reliable biomarkers are still needed. 6 Triglycerides and LDL-cholesterol (associated with dyslipidemia, caused by abnormally high levels of lipids and lipoproteins in the blood), glycated haemoglobin and, more recently, C-reactive protein (CRP) are well identified as vascular risk biomarkers. 7 A large number of vascular complications may occur in the course of diseases that do not have specific vascular biomarkers (e.g. renal failure, hypertension and vascular aging). To prevent and more easily manage such risk, new vascular biomarkers need to be found.
RAGE, the receptor for advanced glycation end-products (AGEs) is a multiligand receptor belonging to the immunoglobulin superfamily of cell-surface molecules. 8 It is known to play a major vascular role in metabolic (e.g. diabetes mellitus and renal failure) and inflammatory disorders, and RAGE activation is followed by pro-inflammatory, pro-thrombotic and neoangiogenic cell responses.9–13 RAGE contains an intracellular domain, a short transmembrane domain and an extracellular domain consisting of three immunoglobulin-like regions, i.e. one ‘V’ type followed by two ‘C’ types. The ‘V’ type is essential for most ligand binding. 14
Soluble RAGE (sRAGE) corresponds to the extracellular domain and is able to act as a decoy to avoid interaction between RAGE and its pro-inflammatory ligands. Carboxymethyllysine (CML, the AGE with highest affinity for RAGE),
15
S100/calgranulins, high-mobility group protein B1 (HMGB1/amphoterin) and β-amyloid peptide (aβ) are the most widely studied RAGE ligands.16,17 These ligands bind to different sites of sRAGE (Figure 1).
14
RAGE ligands bind to different sites of sRAGE. As a pattern-recognition receptor, RAGE has different binding sites depending on which ligand is involved. The preferential binding sites for anti-sRAGE autoantibodies have not yet been determined. Carboxymethyllysine (CML), S100A6, S100A12 or S100B, high-mobility group protein B1 (HMGB1), amyloid beta peptide (aβ).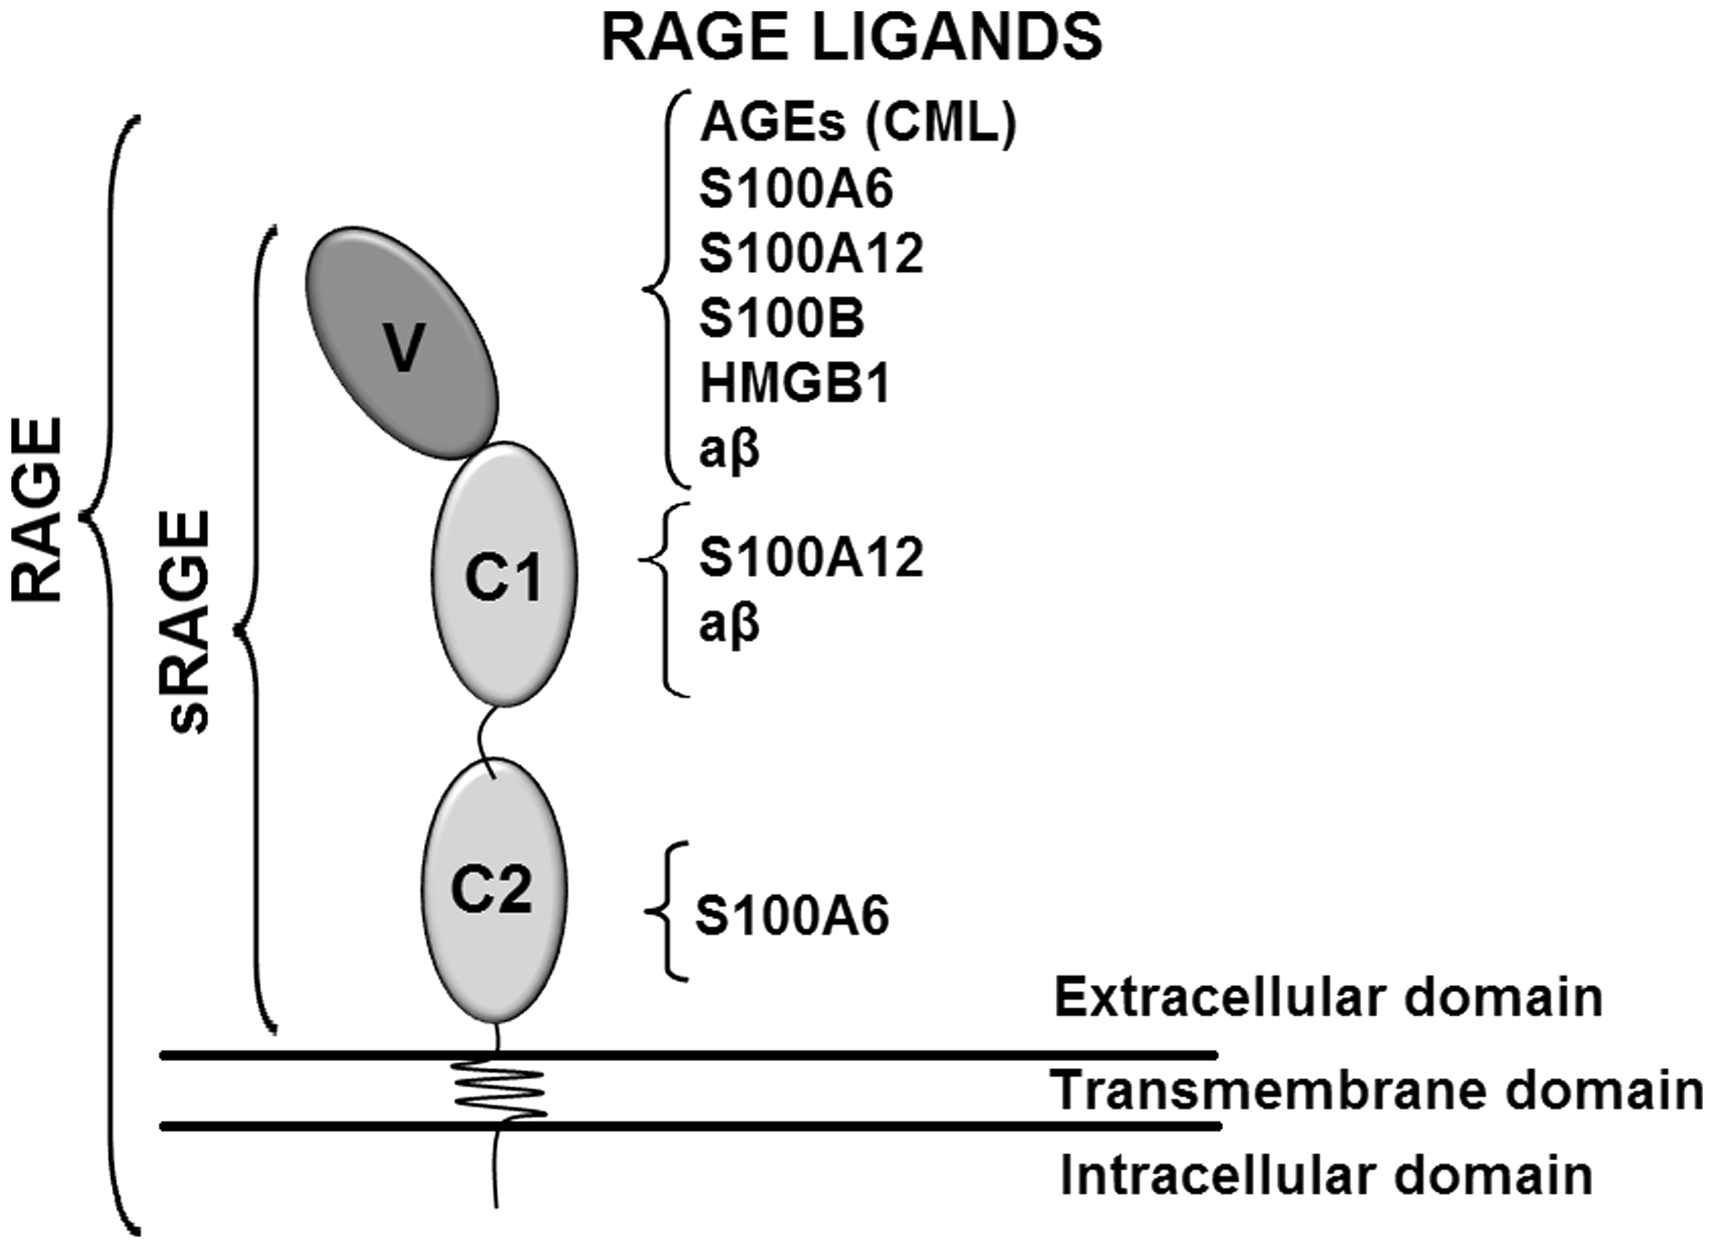
sRAGE has been extensively studied in patients with diabetes or renal failure and in subjects with certain inflammatory vascular diseases.18–20 Although sRAGE may play a potential role as a decoy receptor and vascular biomarker, its quantification remains a subject of controversy. While associations between sRAGE levels and disease severity/complications are often observed, it is surprising to note that for the same disease, the results regarding such associations are frequently conflicting: some are negative, others positive.18,21–26 Certain factors are also considered to modulate sRAGE levels, including drug intake, renal failure, RAGE polymorphisms and advancing age.
As sRAGE quantification is performed worldwide by enzyme-linked immunosorbent assay (ELISA), in this study, it was hypothesized that RAGE ligands might impair its quantification by masking its epitopes. In addition, the role of anti-sRAGE autoantibodies was also investigated (their activity has been described in Alzheimer’s disease and in the course of rheumatoid arthritis),27,28 thereby increasing the range of RAGE-binding molecules studied.
The aim of this study was to evaluate the effect of CML, S100 A6, A12 or B, HMGB1 and aβ binding on the three domains of sRAGE, and that of anti-sRAGE autoantibodies on sRAGE quantification by ELISA.
Materials and methods
Chemicals
HMGB1 (ab82100), S100 A6 (ab104645), A12 (ab103393) and B (ab54050) were purchased from Abcam (Cambridge, UK). Anti-CML antibodies (MAB3247) and crystallizable fragment (Fc)-free recombinant human sRAGE (Fc-Free-rHu-sRAGE) (SRG00) were purchased from R&D Systems (Minneapolis, MN, USA). Human recombinant sRAGE without the IgG Fc was used to avoid non-specific antibody interactions in the quantification of anti-sRAGE autoantibodies. The other experiments were performed using Fc-conjugated sRAGE (rHu-sRAGE) (1145-RG-050) from R&D Systems (Minneapolis, MN, USA). Anti-human IgG antibodies (A3187), aβ (A1075), glyoxylic acid (G10601), human serum albumin (HSA) (A3782) and sodium cyanoborohydride (156159) were purchased from Sigma–Aldrich (St Louis, MO, USA). Para-nitrophenylphosphate (pNPP) (EU1-2001-100) was purchased from Euromedex (Strasbourg, France). CML-modified human serum albumin (CML–HSA) was obtained as previously described. 29 Briefly, HSA (50 mg/mL) was incubated for 16 h at 37℃ in the presence of glyoxylic acid (60 mM) and sodium cyanoborohydride (20 mM) in phosphate-buffered saline (PBS), pH 7.8. The solution was then extensively dialysed against PBS and the level of glycation was analysed by 2,4,6-trinitrobenzenesulfonic acid free lysine assay. 30 HSA–CML glycation levels were obtained with between 5% and 60% of modified lysine residues.
Effect of RAGE ligands on sRAGE quantification using rHu-sRAGE or control serum
To assess the effect of RAGE ligands on sRAGE quantification, rHu-sRAGE (625, 1250 and 2500 pg/mL) was incubated in triplicate for 1 h at room temperature (RT) with CML-HSA (10, 100 and 1000 µg/mL), S100A6 (10, 100 and 1000 ng/mL), S100A12 (10, 100 and 1000 ng/mL), S100B (10, 100 and 1000 ng/mL), HMGB1 (1, 10 and 100 ng/mL) or aβ (1, 10 and 100 ng/mL), respectively, at concentrations ranging from physiological to supra-physiological. Since the extent of glycation affects RAGE binding affinity, 31 all the tested incubations of CML–HSA were also performed at three levels of glycation (5, 30 and 60%). One experiment was also carried out with a mixture of all these ligands at their highest concentration, and also at the highest glycation level for CML–HSA. All ligand solutions were prepared in PBS containing 1 mM CaCl2 and 10 µM ZnCl2. To investigate the presence of a possible matrix effect resulting in stronger interactions between sRAGE and its ligands, the effects of the aforementioned RAGE ligands (under the same conditions) on serum sRAGE quantification were analysed. Serum samples from four healthy control subjects were incubated for 1 h at RT with CML–HSA, S100A6, S100A12 or S100B, HMGB1 or aβ. Each serum sample was also incubated with a mixture of all the selected ligands at their highest concentration.
sRAGE measurement
sRAGE quantification was performed using a Quantikine Human RAGE ELISA kit (R&D Systems, Minneapolis, MN, USA) according to the manufacturer’s instructions. Briefly, a 50 µL sample (rHu-sRAGE sRAGE + ligand; or serum + ligand) was added to anti-sRAGE-coated wells and incubated at RT for 2 h. The wells were then washed in rinsing buffer, following which 200 µL of peroxidase-conjugated anti-sRAGE solution were added and incubated for 2 h. The wells were washed again and the substrate solution (200 µL) was incubated for 30 min and kept away from the light. The reaction was stopped with 50 µL of stop solution, and optical density (OD) was measured at 450 nm in a microplate reader (Multiskan Ascent 354, Thermo Scientific).
Study subjects
Patient characteristics.
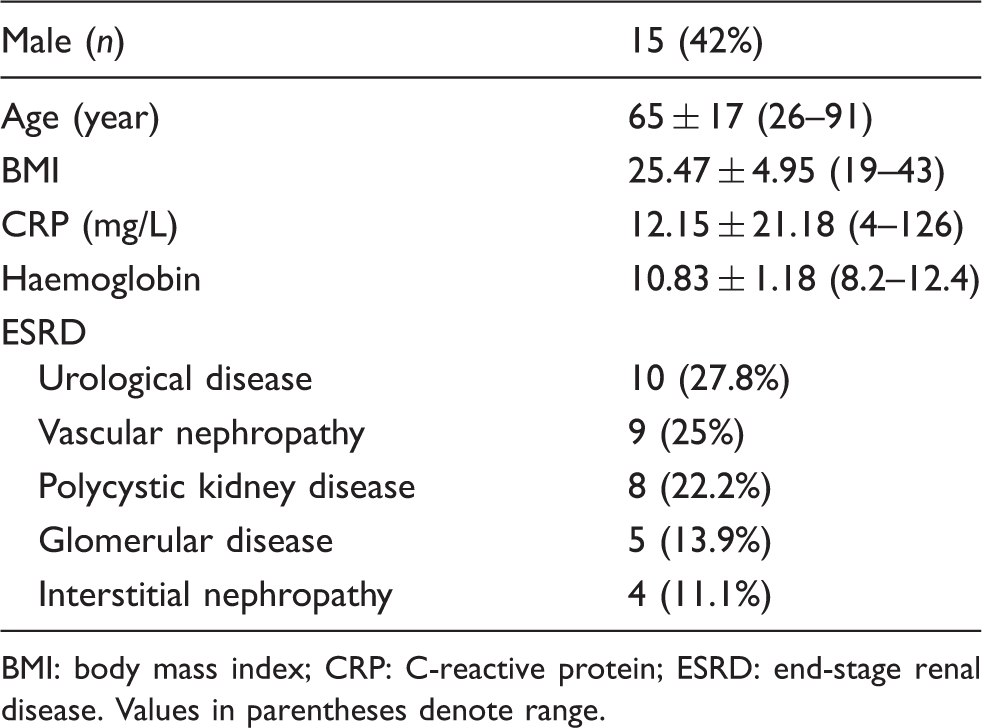
BMI: body mass index; CRP: C-reactive protein; ESRD: end-stage renal disease. Values in parentheses denote range.
Anti-sRAGE autoantibody quantification by ELISA
The quantification of anti-sRAGE autoantibodies (IgGs) was adapted from a previously reported protocol. 28 Nunc Maxisorp™ F8 96-well microplates (Thermo Scientific) were coated with Fc-Free-rHu-sRAGE (0.5 µg/well) in PBS overnight at 4℃. After coating, the wells were washed and then saturated with 10% fetal bovine serum in PBS saturation buffer for 45 min at RT. The buffer was then removed, the wells were washed again and the serum samples diluted (1:100) in saturation buffer. Samples (100 µL/well) were incubated for 2 h at RT. Following this, the wells were washed four times and then 100 µL alkaline phosphatase-conjugated anti-human IgG was added to each well (1:2000 in saturation buffer) and incubated for 45 min at RT. The wells were washed five times in saturation buffer, and 100 µL of 1 mg/mL pNPP was added to each well and incubated for 1 h at 37℃. Optical density was measured at 405 nm in a microplate reader. Samples were measured in duplicate, and anti-sRAGE IgG titers were calculated by subtracting the blank control sample (wells not coated with Fc-Free-rHu-sRAGE) from the duplicate mean.
The specificity of the ELISA was confirmed by Western blot using serum from HD patients with low and high anti-sRAGE IgG levels (migration of rHu-sRAGE in SDS–PAGE, transfer to a polyvinylidene difluoride membrane, incubation of serum within the membrane and revelation using peroxidase-conjugated anti-human IgG antibody) (not shown).
To confirm that anti-sRAGE autoantibodies were not just glycated IgGs which could bind to sRAGE as it is a glycated protein receptor, IgG glycation level was assessed by dot–blot (anti-CML antibody) (Figure 2(a)) and liquid chromatography coupled to linear ion-trap tandem mass spectrometry (LC–MS/MS), as previously described (Figure 2(b)).
33
Dot–blot and LC–MS/MS were performed with purified IgGs from HD patients with high (n = 8) and low (n = 8) anti-sRAGE IgG levels.
Glycation levels of purified IgGs are independent of anti-sRAGE activity. Carboxymethyllysine (CML) content was analysed in purified IgGs from HD patients with low (n = 8) and high (n = 8) anti-sRAGE IgG levels. Serum IgGs were purified using a protein G–sepharose column. IgG fractions were spotted onto a nitrocellulose membrane and blotted with anti-CML antibody (a). Spot intensity was analysed with ImageJ software (a). The CML content of purified IgGs was also analysed by LC–MS/MS (b). Mean + SEM (n = 8). No statistically significant difference was observed (Student’s t-test).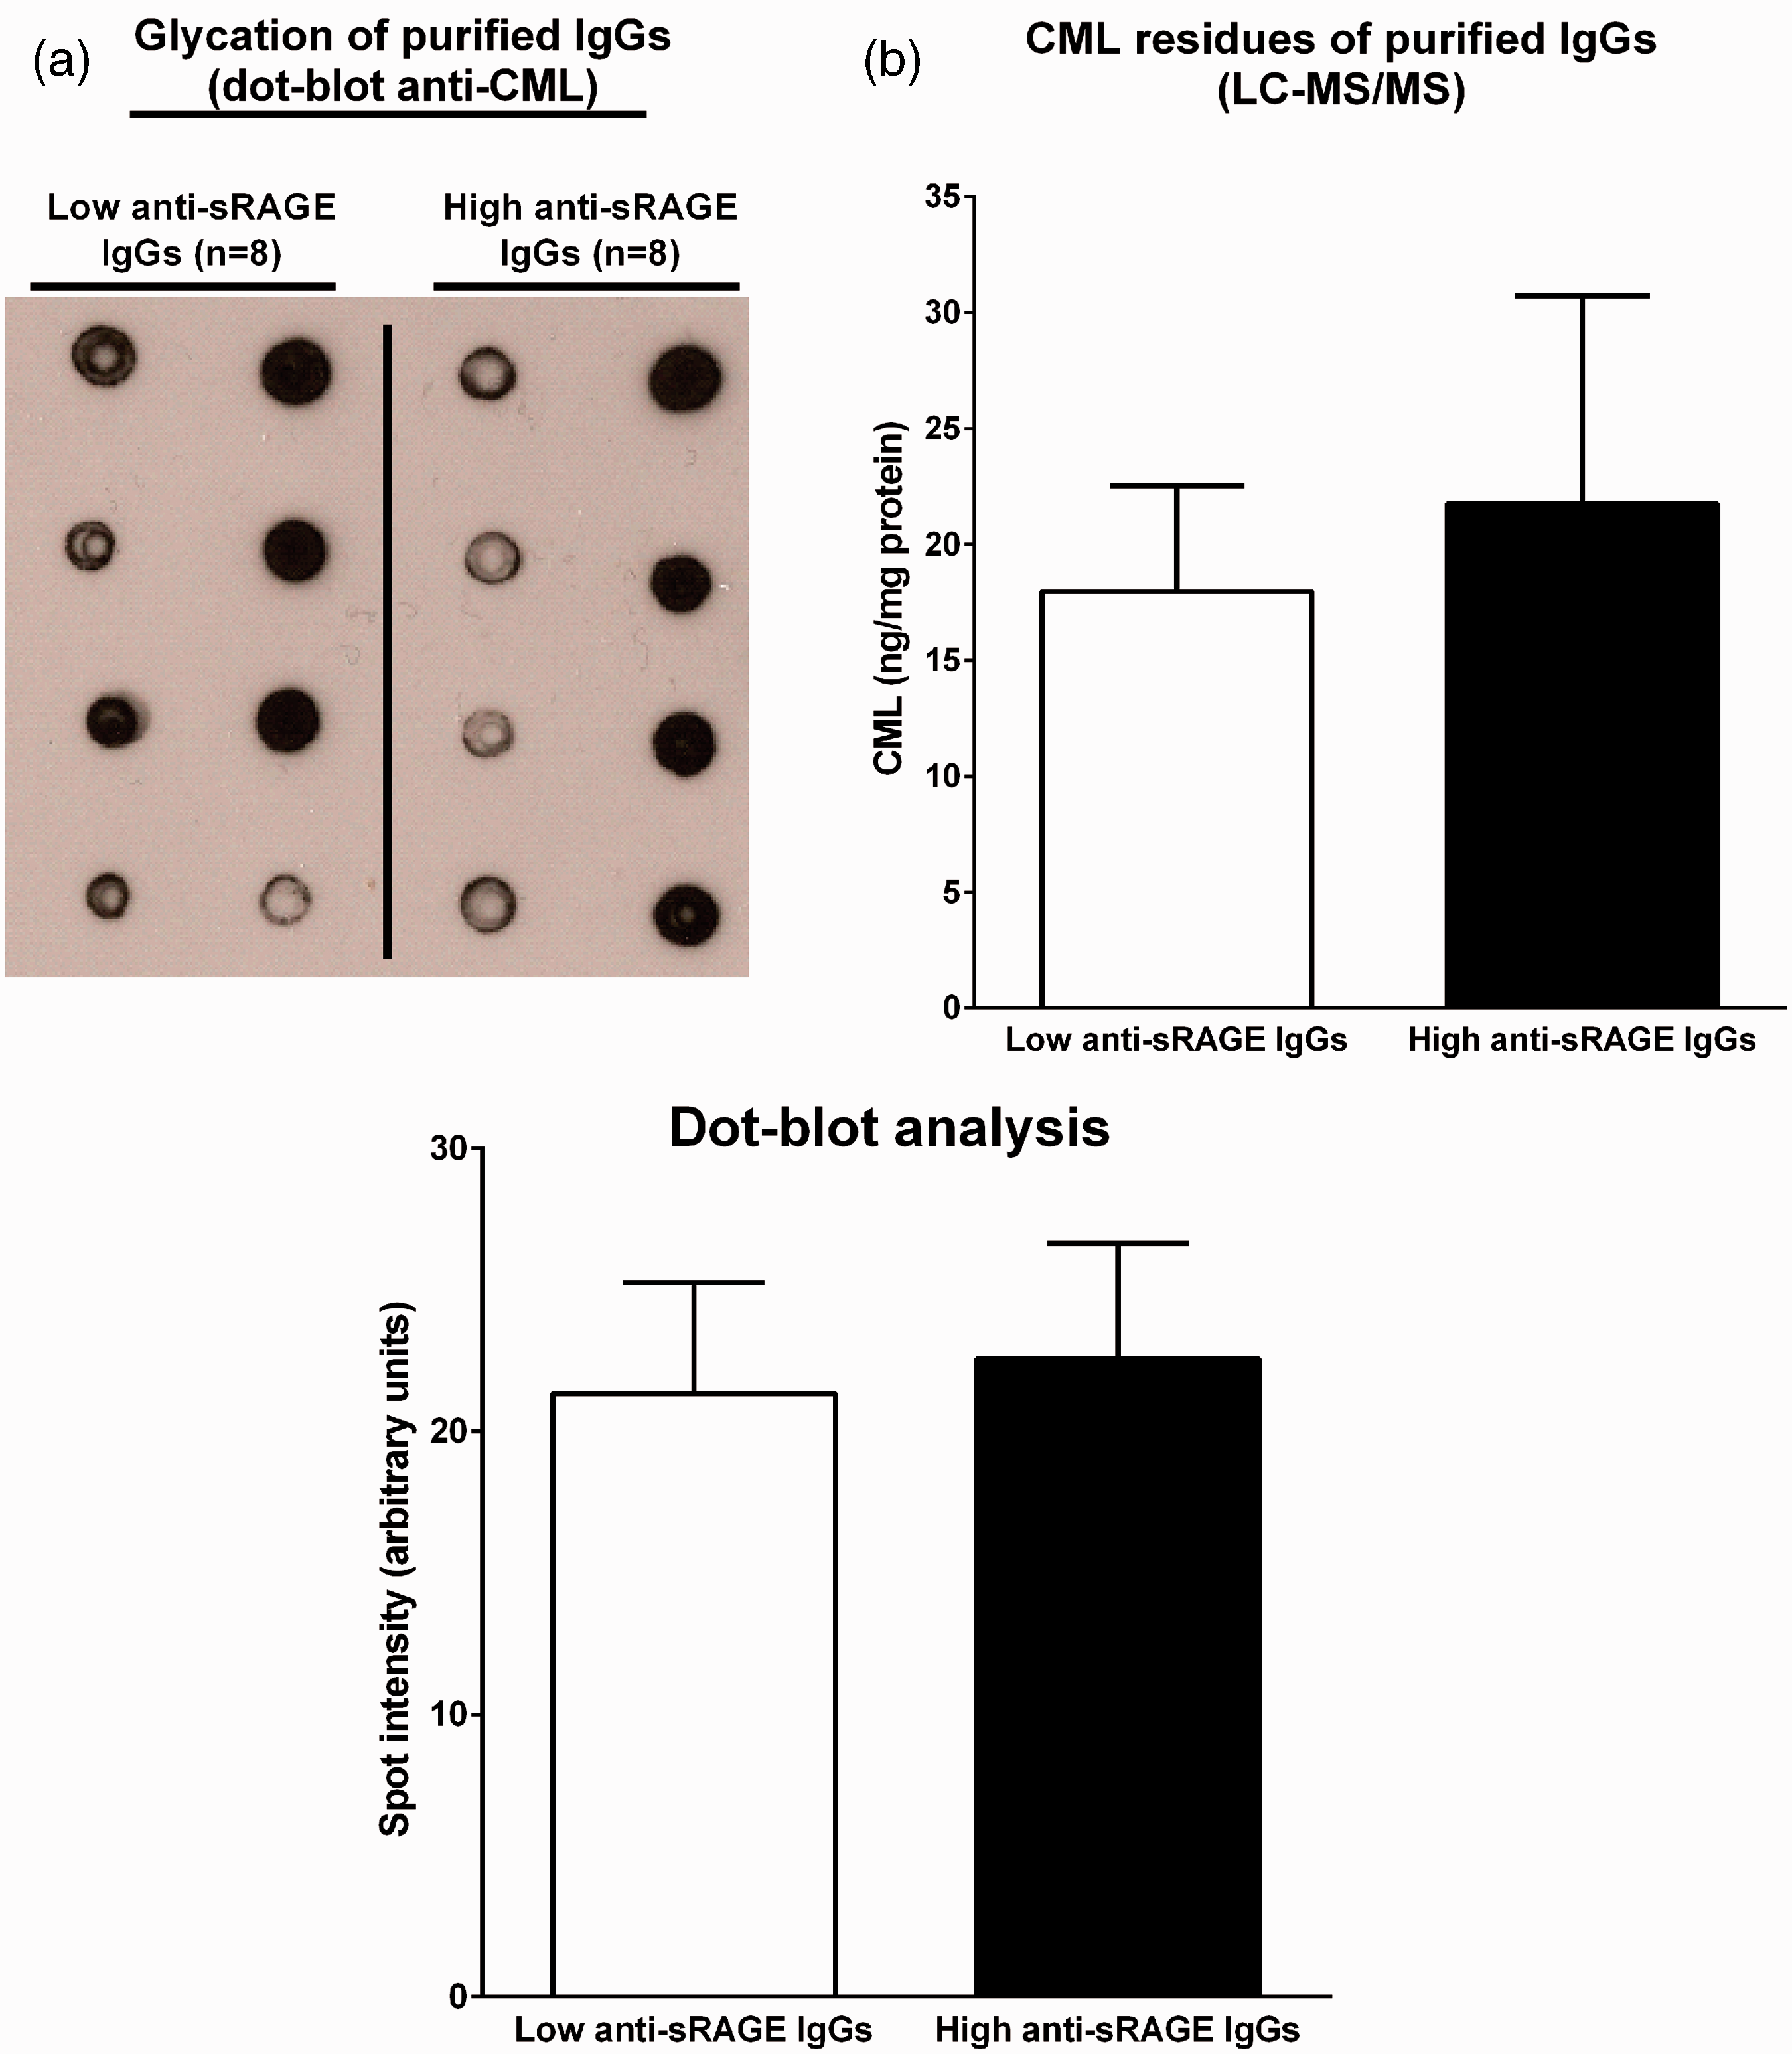
Effect of purified IgGs on sRAGE quantification using rHu-sRAGE or control serum
The effect of IgGs on sRAGE quantification was assessed by incubating rHu-sRAGE or serum from healthy controls with purified IgGs from HD patients with the lowest (n = 8) and highest (n = 8) anti-sRAGE IgG titers (Quantikine). IgG fractions were obtained using a MAb-Trap kit (GE Healthcare, Buc, France). Briefly, serum (0.5 mL) was filtered (0.2 µm) and diluted 1:1 in binding buffer, applied to a protein G–sepharose column and washed in binding buffer. Bound IgGs were eluted with elution buffer into tubes containing 200 µL/mL neutralizing buffer. The eluted fractions were dialysed against PBS, and the protein content was assayed using a BCA Protein Assay (Thermo Scientific).
Purified IgGs (0.1, 0.5 and 1 mg/mL) from patients with low and high anti-sRAGE autoantibody levels were incubated in triplicate with rHu-sRAGE at 625, 1250 and 2500 pg/mL and also with serum samples from four healthy controls for 1 h at RT (Quantikine).
Statistical analysis
Anti-sRAGE autoantibodies and sRAGE levels were compared between the control group and HD patients using Student’s t-test. The effect of RAGE ligands and anti-sRAGE autoantibodies on sRAGE quantification was analysed by one-way analysis of variance (ANOVA), followed by Tukey’s test. A P < 0.05 value was considered as being statistically significant.
Results
RAGE ligands do not affect sRAGE quantification (using rHu-sRAGE or control serum)
When incubated singly with rHu-sRAGE, CML–HSA (10, 100 and 1000 µg/mL), S100A6 (10, 100 and 1000 ng/mL), S100A12 (10, 100 and 1000 ng/mL), S100B (10, 100 and 1000 ng/mL), HMGB1 (1, 10 and 100 ng/mL) or aβ (1, 10 and 100 ng/mL) or mixed together (at the highest concentration for each above-mentioned RAGE ligand), this had no effect on recombinant sRAGE quantification at 625, 1250 or 2500 pg/mL. Figure 3(a) shows the sRAGE levels after incubation with the highest concentrations of these ligands. However, since other serum components could also affect ligand-binding affinity, the influence of the matrix effect was investigated by incubating the same RAGE ligands with serum samples from healthy control subjects. None of the tested concentrations were found to alter the serum levels of sRAGE as quantified by ELISA (Figure 3(b)). In addition, no effect of CML–HSA on sRAGE quantification was observed, whatever the level of glycation (not shown). Figure 3(a) and (b) shows the results obtained for CML–HSA with 60% modified lysine residues.
Effect of RAGE ligands on sRAGE quantification. After incubation of rHu-sRAGE with CML–HSA, S100A6, S100A12, s100B, HMGB1 or aβ alone and then with a mixture of all these ligands combined at their highest concentration (All), no effects on sRAGE quantification were observed (a). The same RAGE ligands were incubated with serum samples from healthy control subjects. Serum sRAGE levels were normalized to the normal values of each patient (serum + PBS), represented by the dashed line. No statistically significant effects were observed (b). Mean + SEM.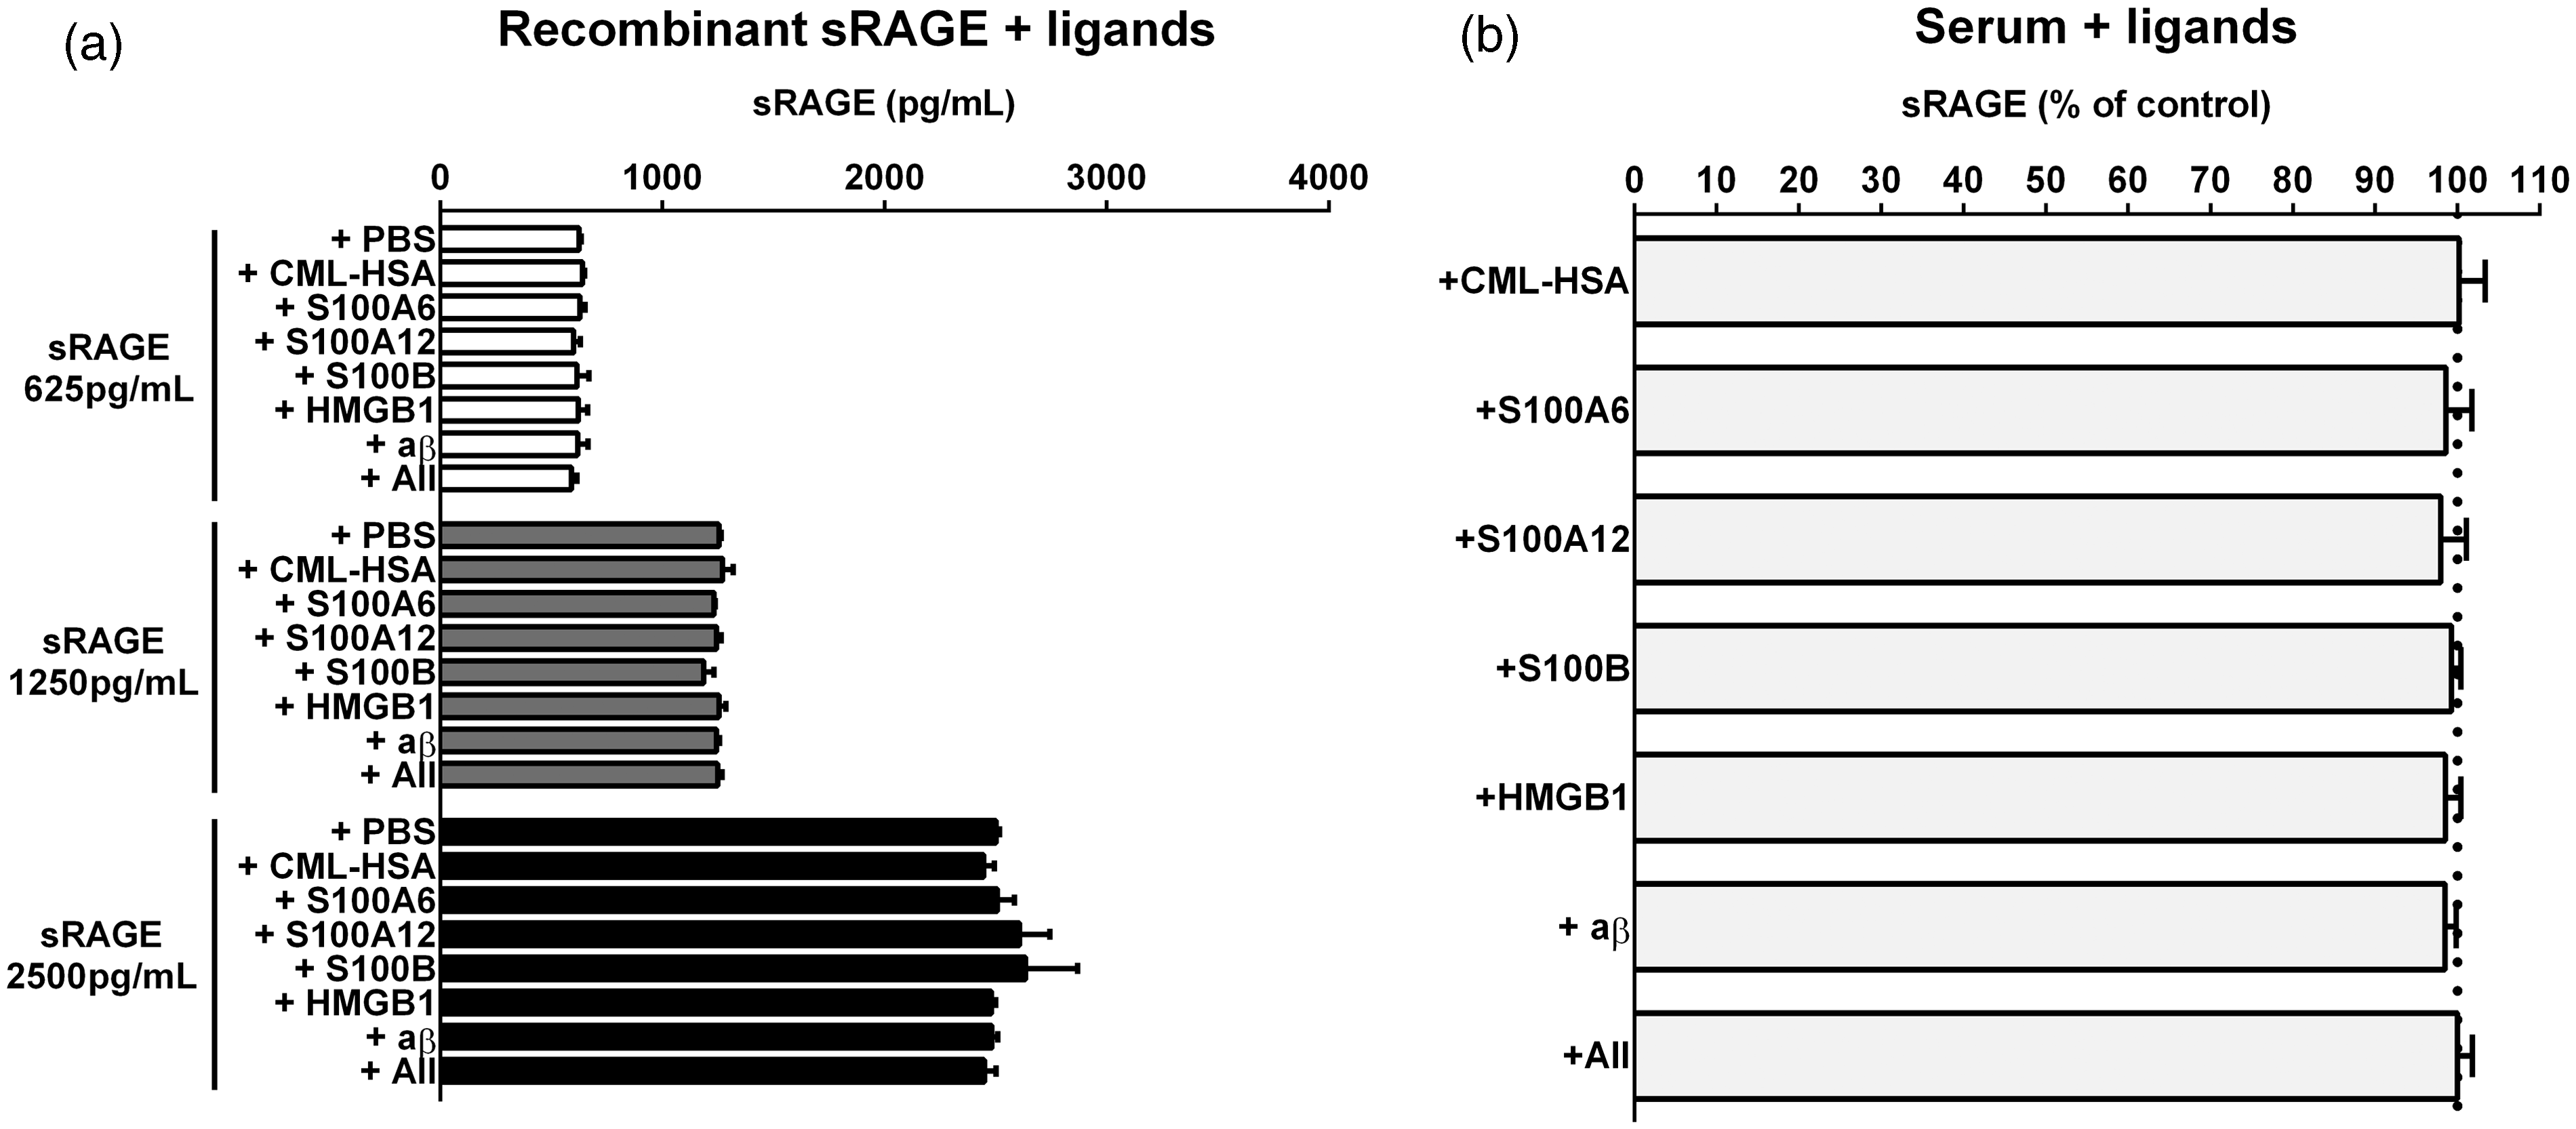
sRAGE and anti-sRAGE autoantibody levels are increased in HD patients
Compared with healthy control subjects, HD patients had significantly higher serum sRAGE levels (3449 ± 1752 pg/mL vs. 1113 ± 456 pg/mL, P < 0.0001) (Figure 4(a)). In addition, it was possible to identify HD patients with anti-sRAGE autoantibodies; the titers of anti-sRAGE IgGs were significantly higher in HD patients than in controls (OD 0.29 ± 0.26 vs. OD 0.19 ± 0.13, P < 0.05) (Figure 4(b)). However, no correlation between sRAGE and anti-sRAGE autoantibody levels was observed (Figure 4(c) and (d)) either in the control group or in the HD patient group, although the latter presented significantly higher levels of these two biomarkers. The absence of an inverse correlation between sRAGE and anti-sRAGE autoantibody levels, particularly in the HD patient group, was not in favour of the hypothesis which initially put forward that anti-sRAGE antibodies might mask sRAGE epitopes and thus affect sRAGE quantification by ELISA (r2 = 0.01).
sRAGE and anti-sRAGE antibody levels in HD patients. Serum sRAGE levels in control subjects (n = 46) and HD patients (n = 36) (a). These levels were measured twice for each patient. (b) Anti-sRAGE autoantibody titers in HD patients and control subjects. No significant association between sRAGE and anti-sRAGE levels was observed in control subjects (c) or in HD patients (d). Bars indicate the means in panels A and B.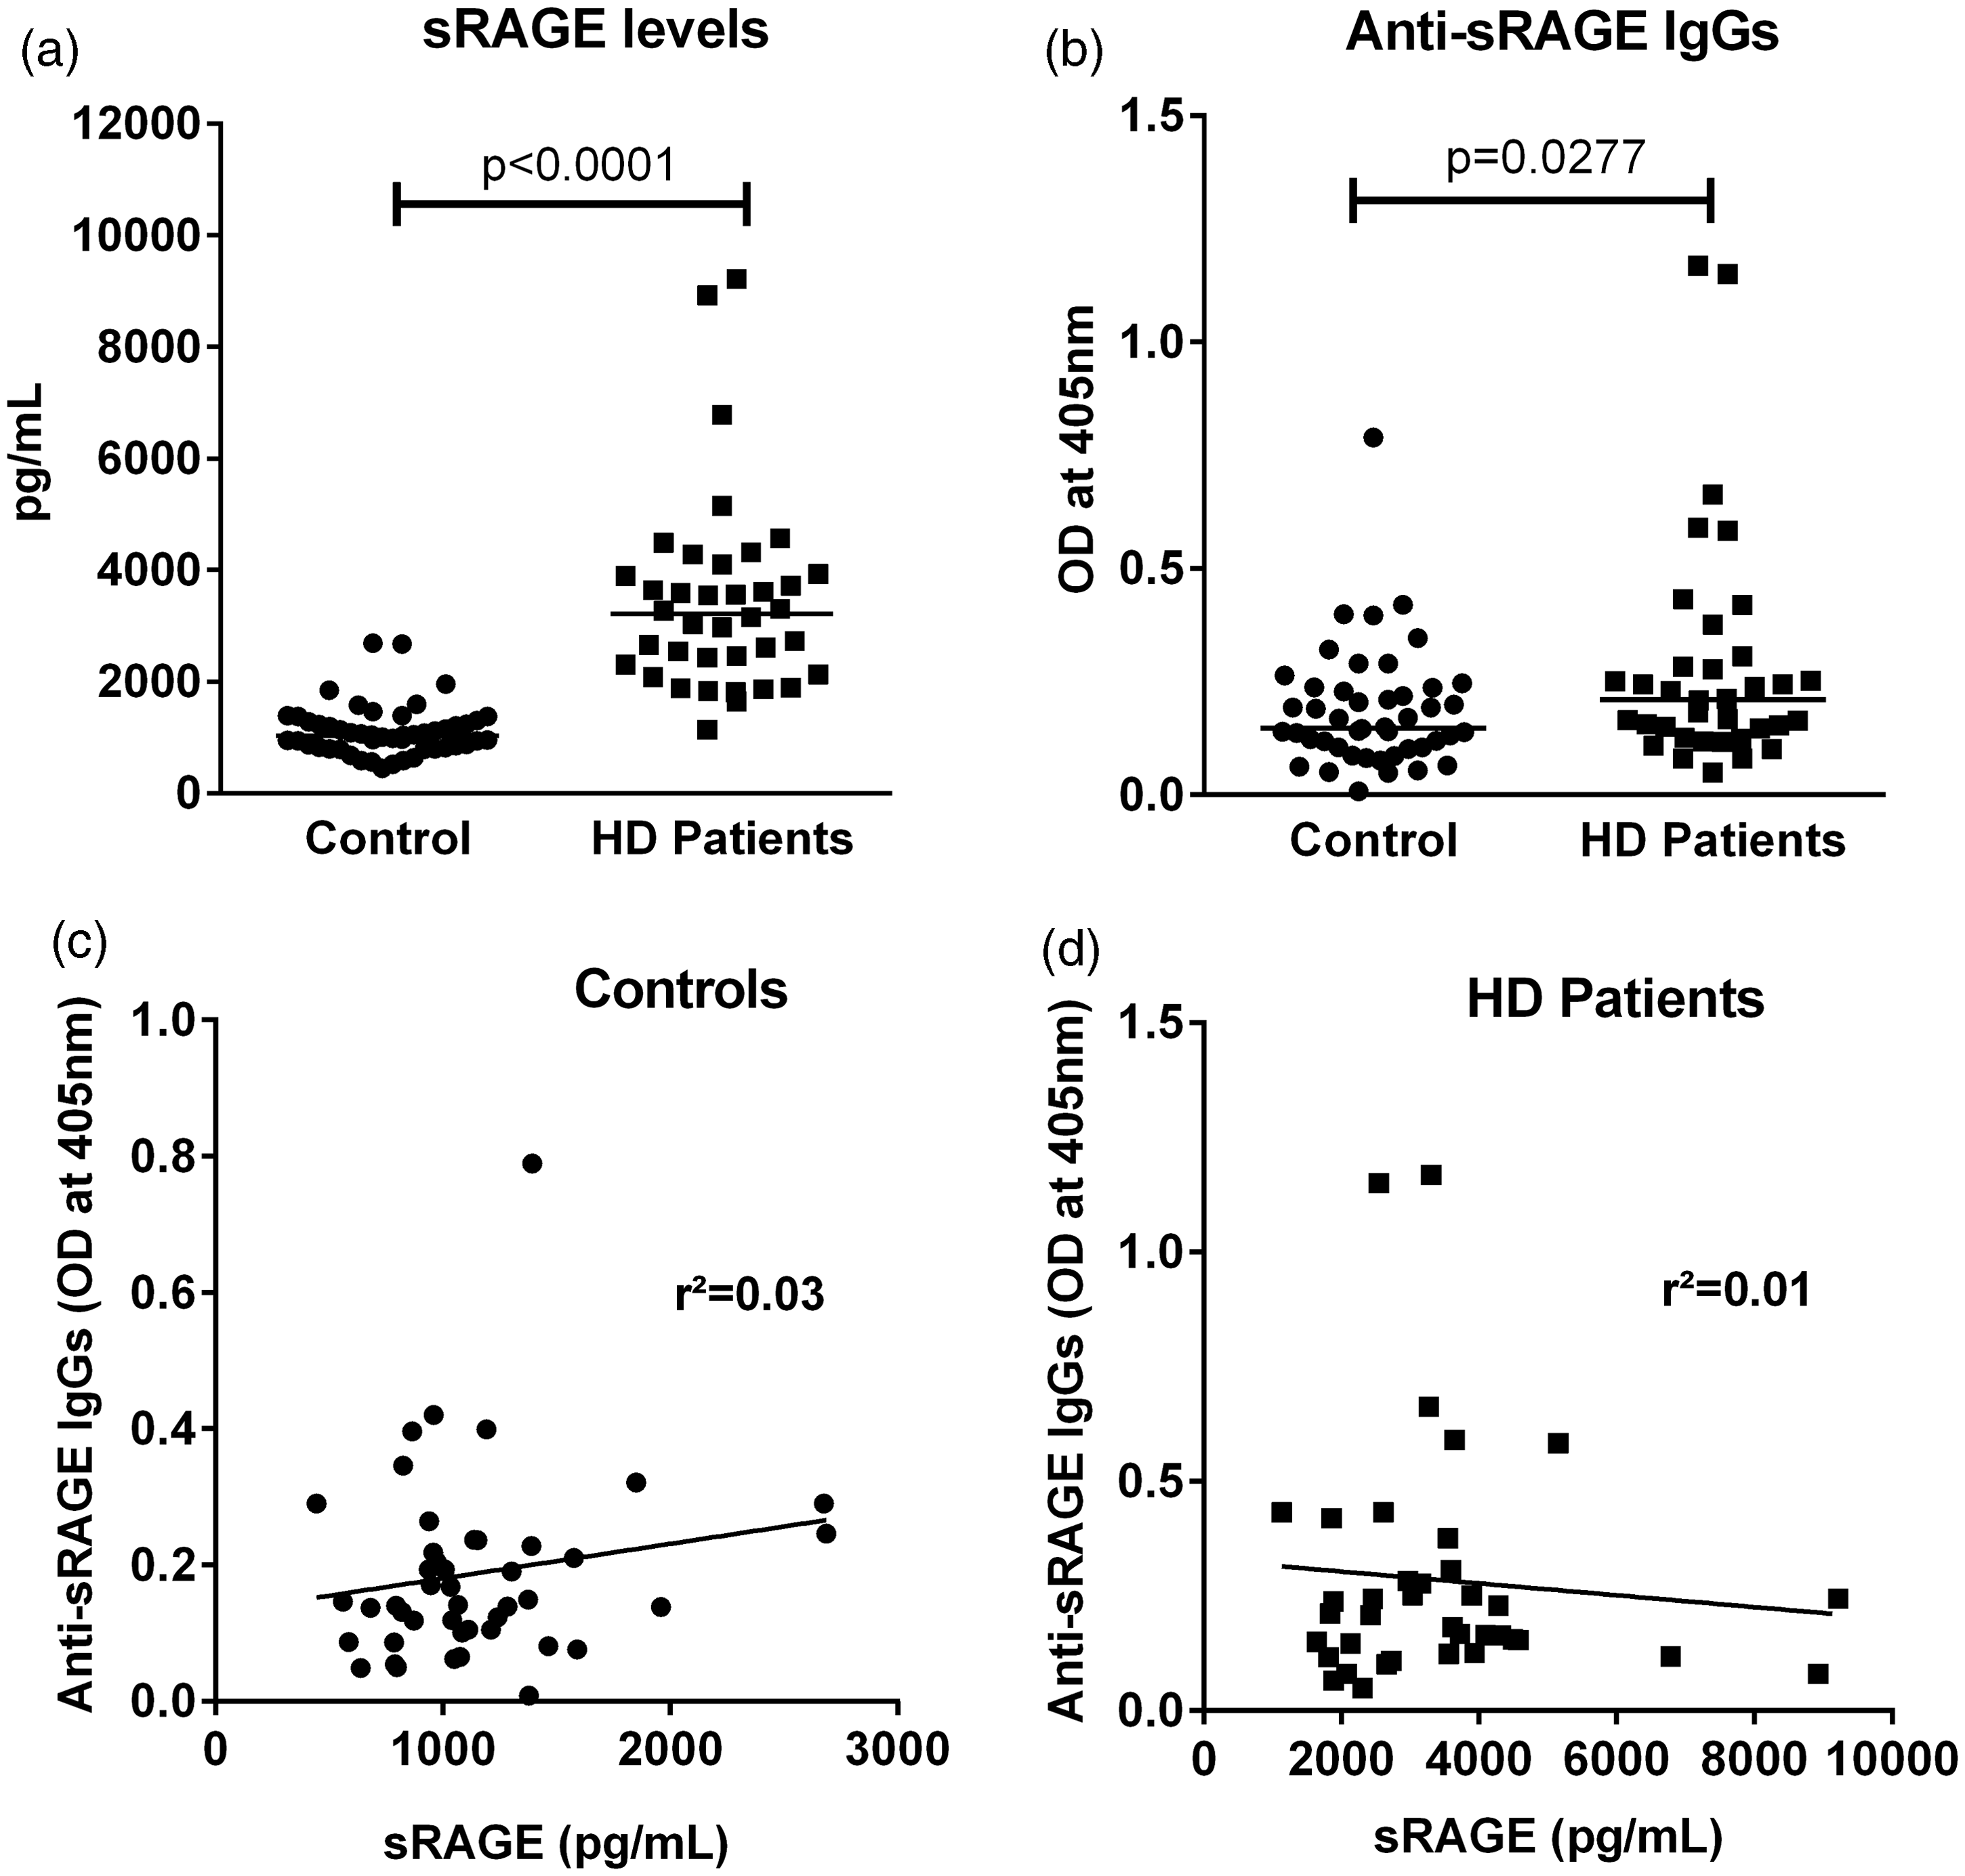
Purified IgGs do not affect sRAGE quantification (using rHu-sRAGE or control serum)
The effect of purified IgGs on sRAGE quantification was further analysed. Purified IgGs (0.1, 0.5 and 1 mg/mL) from HD patients with low (n = 8) or high (n = 8) anti-sRAGE IgG levels did not affect recombinant sRAGE quantification at 625, 1250 or 2500 pg/mL (Figure 5(a)). However, since other serum components could also have an impact on ligand-binding affinity, the possible influence of the matrix effect was investigated by incubating purified IgGs with serum samples from healthy control subjects (n = 4). None of the purified IgGs tested and obtained from patients with low or high anti-sRAGE IgGs was found to affect serum sRAGE levels as quantified by ELISA (Figure 5(b)). Figure 5(a) and (b) shows the results following incubation with 1 mg/mL of purified IgGs.
Effect of purified IgGs on sRAGE quantification. Purified IgGs from HD patients with low and high auto-sRAGE IgG levels were incubated with rHu-sRAGE (a) or with serum from healthy control subjects (b). Serum sRAGE levels were normalized to the normal values of each patient (serum + PBS), represented by the dashed line. No statistically significant difference was observed. Mean + SEM.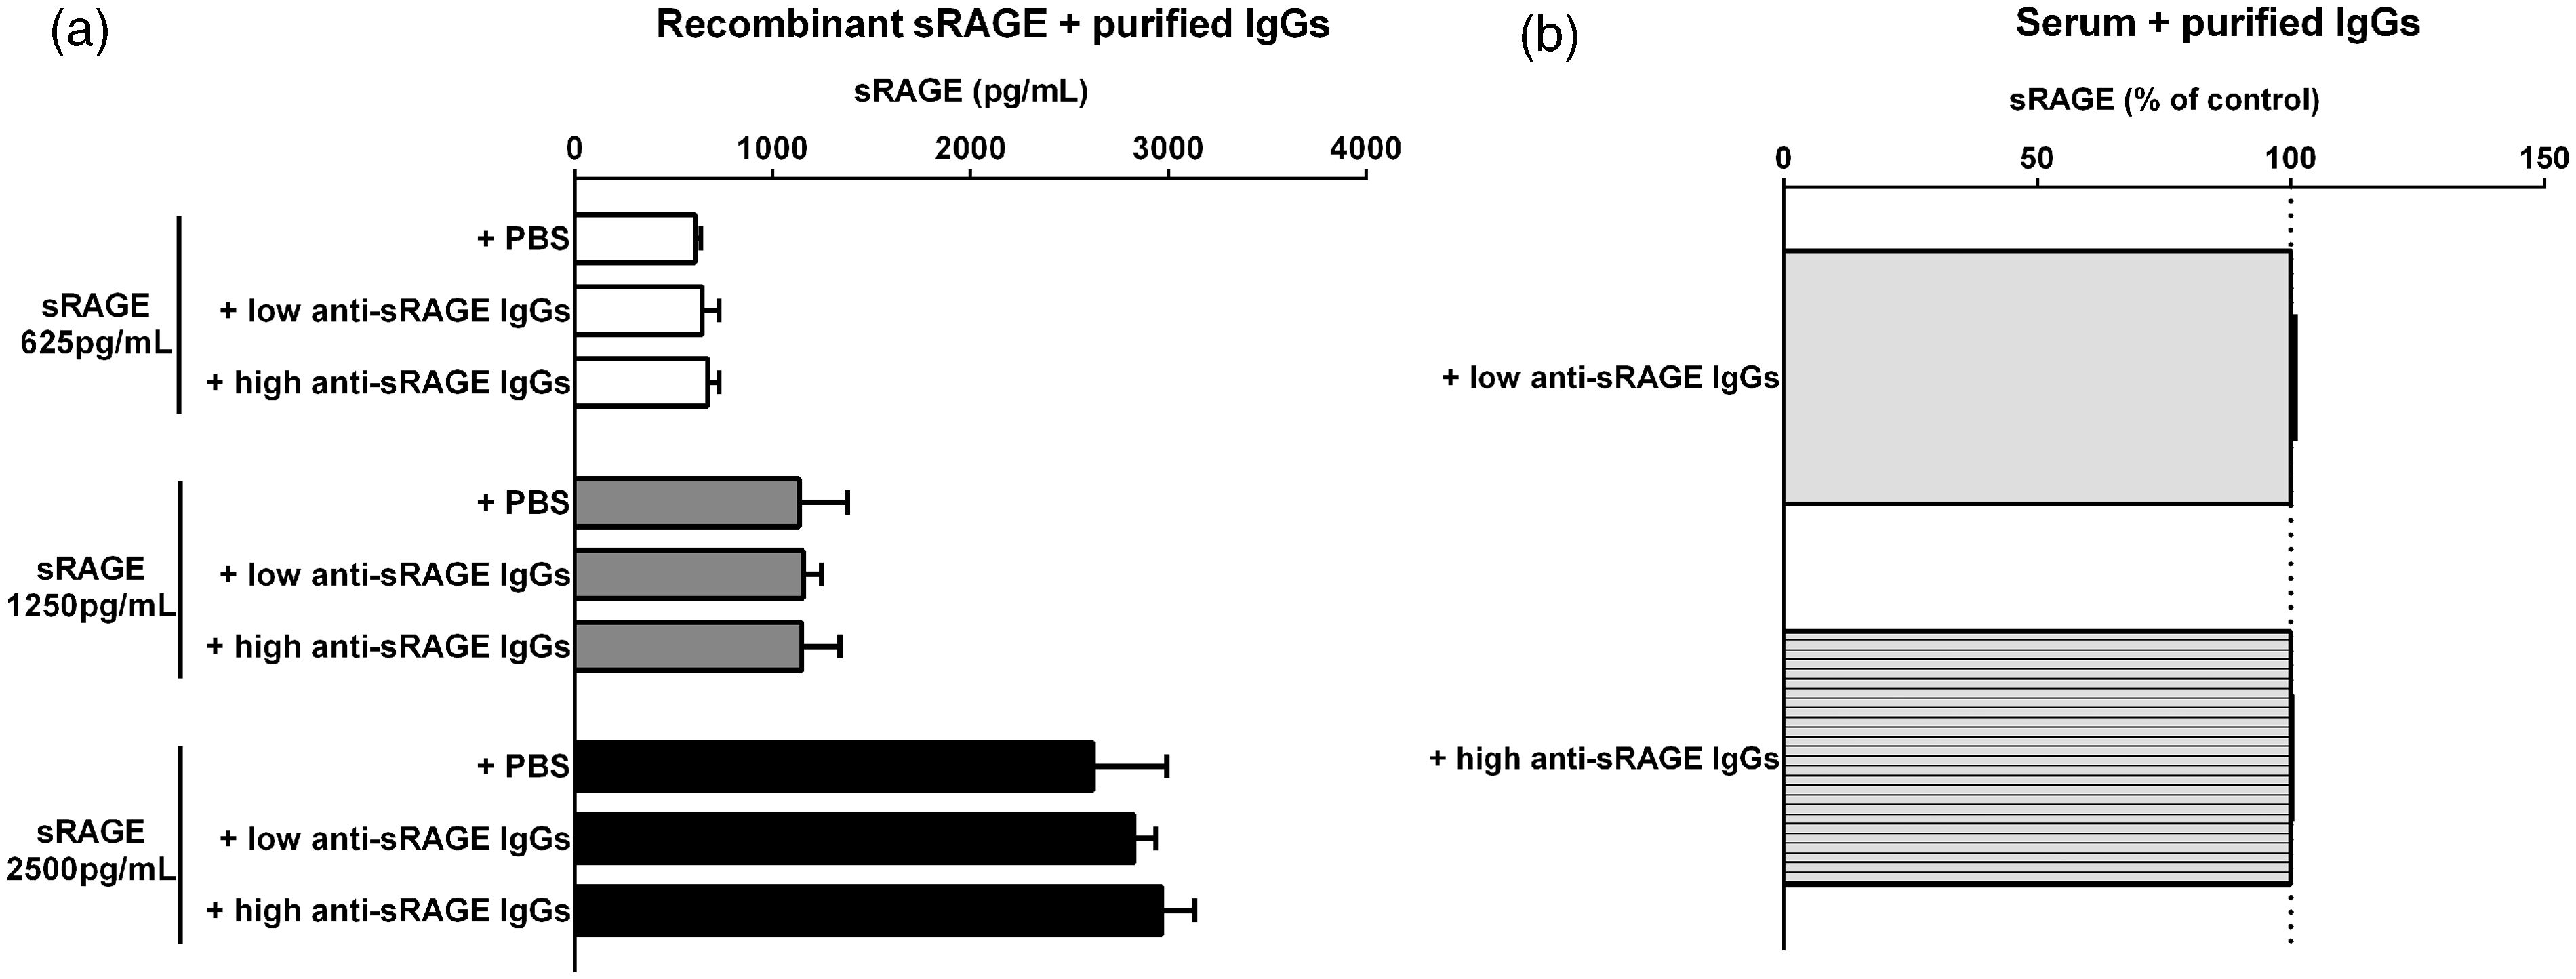
Discussion
In this study, it has been demonstrated that RAGE ligands CML–HSA, S100A6, S100A12, S100B, HMGB1 and aβ, or a mixture of all these ligands at their highest concentration, do not affect sRAGE quantification. While not considered as being RAGE ligands, the activity of anti-sRAGE autoantibodies has already been investigated in the literature
RAGE was first described as a binding protein for AGEs and was later found to be a pattern-recognition receptor that binds to several members of the S100/calgranulin family, HMGB1 and aβ. 8 More recently, lipopolysaccharides (LPS) and phosphatidylserine have also been reported to bind to RAGE.34,35 However, in the present work, LPS and phosphatidylserine were not tested because their RAGE binding sites have not yet been identified and these two groups of molecules have not been fully studied as RAGE ligands. As regards RAGE, ligand binding takes place independently of a specific amino-acid sequence. 36
Ligands can bind to RAGE in different domains, suggesting that simultaneous molecular binding is possible. AGEs and HMGB1 mainly bind to the V-domain while S100B, 37 S100A6 and S100A12 bind to the VC1 and C1C2 domains, and aβ to the V and C1 domains (Figure 1). 38 HMGB1 is the ligand with the highest binding affinity for RAGE, followed by CML. The absence of effect of HMGB1 alone on sRAGE quantification has been previously reported. 39 All the sRAGE domains were investigated in the present study using CML–HSA, S100A6, S100A12, S100B, HMGB1 or aβ. Moreover, epitope masking has been described in the literature as a problematical issue in ELISA protocols, e.g. resulting in lower anti-aβ binding in the presence of aβ fibrils and aggregates.30,31,40,41 Furthermore, epitope masking via phosphorylation has also been demonstrated for the DO-1 domain of p5342 as well as for the binding of cardiolipins to anti-β2-glycoprotein 1 antibodies. 43
The evaluation of sRAGE blood levels is solely based on ELISA tests. Therefore, it is possible that epitope masking via steric hindrance could interfere with the results of the ELISA test and lead to an under-assessment of serum sRAGE levels. Moreover, the amino-acid sequences recognized by the antibodies of the most commonly used ELISA kits are not available, making it difficult to predict the effect of epitope masking on the quantitative evaluation of sRAGE levels. On the other hand, sRAGE quantification has been shown to be stable through time and to vary minimally between serum and plasma. 44 Wittwer et al. 45 also demonstrated that sRAGE levels are comparable between EDTA and heparin sampling, with no loss after repeated freeze-thaw cycles. These previous works, combined with the present results, corroborates the robustness of the assay. Moreover, RAGE–ligand interactions are of electrostatic in nature and antibody affinity maturation could create stronger interactions between sRAGE and commercially produced antibodies. 36
In the present study, after demonstrating for the first time that HD patients produce anti-sRAGE autoantibodies, it was shown that there was no correlation between sRAGE levels and anti-sRAGE autoantibody activity. However, since it is possible that the production of anti-sRAGE autoantibodies could be induced by glycated proteins and sRAGE itself, 46 it is not surprising that uremic patients, who have increased AGE and sRAGE levels and thus suffer from a complex inflammatory state, could develop autoantibodies. Second, when incubated with recombinant sRAGE or serum samples, the purified anti-sRAGE IgGs from these patients had no effect on sRAGE quantification as measured by ELISA. This does not rule out an interaction between anti-sRAGE and sRAGE, although it suggests that the antibodies used in the ELISA method have a higher affinity for, and/or recognize a different epitope. Moreover, purified IgGs from these patients displayed different levels of glycation which had no association with anti-sRAGE titers (Figure 2). It is important to point out this aspect, since it could represent a bias in the present study methodology. The validity of antigen–antibody binding was also confirmed by Western blot (not shown). The pathophysiology of anti-sRAGE autoantibody production has not been elucidated, and even less the relevance of these autoantibodies as biomarkers. It is suggested here that this may involve a possible autoimmune reaction to vascular dysfunction induced by RAGE ligands that stimulate sRAGE production and subsequent anti-sRAGE autoantibody formation.
The role of sRAGE as a vascular biomarker remains uncertain, since a number of factors can influence its serum levels. As mentioned earlier, depending on the authors in question, sRAGE levels have been reported as being either negatively or positively correlated with the severity of the same disease.18,21–25 Thus, the findings in this respect are contradictory. Factors capable of modulating sRAGE levels such as angiotensin-converting enzyme inhibitors or statins have not met with general consensus in the literature.47–49 Among these various factors, age, RAGE polymorphisms, smoking body-mass index and ethnicity could well play an important role in varying sRAGE levels.49–52 Furthermore, strong evidence suggests a role of kidney dysfunction in increased sRAGE levels, although the specific mechanisms are unclear.19,20,53 Compared to healthy young individuals, significantly higher sRAGE levels have been reported in healthy centenarians, 54 and a difference of around 500 pg/mL sRAGE has been associated with Gly82Ser polymorphism. 55 However, to date nothing has yet been reported on sRAGE blood levels after a high AGE-containing meal.
The sRAGE assay measures the pool formed by cleaved sRAGE (cRAGE) and endogenous secretory sRAGE (esRAGE). 56 The secreted form has also been studied as a biomarker for vascular risk. In the present study, only the cleaved form was investigated, since both molecules have the same amino-acid sequence for the ligand-binding domains.
Although the hypothesis that RAGE ligands or anti-sRAGE autoantibodies might negatively affect sRAGE quantification was not confirmed, our findings suggest that the ELISA technique for sRAGE quantification is a reliable method. The use of sRAGE as a valid biomarker has still to be determined, and in this regard, the reports in the literature remain controversial. In the present study, it was demonstrated that anti-sRAGE autoantibodies could be detected in HD patients. Nonetheless, further studies are necessary to more fully assess the role of RAGE ligands and sRAGE on anti-sRAGE autoantibody formation as well as the potential role of such autoantibodies as potential biomarker for vascular autoimmunity.
Footnotes
Acknowledgements
The authors gratefully acknowledge the assistance and invaluable technical expertise provided by Carine Hauspie and Sandrine Vuye from the laboratory of Lymphocyte Homeostasis and Deregulation, Lille2 University.
Declaration of conflicting interests
None declared.
Funding
This research received no specific grant from any funding agency in the public, commercial, or not-for-profit sectors.
Ethical approval
Recruitment and blood sampling were performed according to the Declaration of Helsinki, with informed and signed consent for all the study subjects.
Guarantor
EB.
Contributorship
All authors have significantly contributed to the development of this work by: (a) designing, conceiving and analysing, (b) manuscript drafting and reviewing and (c) approving the final manuscript.