
Abstract
Background
In recent years, a rapid-clotting serum tube, BD Vacutainer® Rapid Serum Tube (RST™), was introduced to improve turn-around times for serum samples. Previous studies reported reduced concentrations of some markers of haemolysis in RST specimens compared to other serum or plasma samples. We aimed to compare RST to plasma tubes for haemolysis markers in an emergency department (ED) setting, where increased rates of haemolysis are commonly seen.
Methods
Patients presenting to ED over an eight-day period had an RST, BD Vacutainer® PST™ II (plasma) Tube and BD Vacutainer® Heparin (non-gel, plasma) Tube collected. Blood was drawn from an intravenous cannula, and samples were promptly analysed for haemolysis index, potassium, phosphate, aspartate aminotrasferase (AST), magnesium and lactate dehydrogenase (LD).
Results
A total of 347 patient samples were included, and 9.2% of the PST samples were haemolysed. The RST tubes had small increases in all of the haemolysis markers compared to both plasma tubes (P ≤ 0.005), except LD which was lower in the RST group. There were no significant differences in the proportion of results above the upper reference limit between the tubes, except for LD which had a lower proportion in RST samples (P ≤ 0.002).
Conclusion
Compared to plasma, RST specimens show small increases in several haemolysis markers, consistent with known differences between serum and plasma, but the proportion of elevated haemolysis markers is similar to plasma. In a setting with a high haemolysis rate such as ED, RST specimens provide a non-inferior sample type for markers of haemolysis.
Keywords
Introduction
In recent years, a rapid-clotting serum tube, BD Vacutainer® Rapid Serum Tube (RST; BD, Franklin Lakes, NJ, USA) has been introduced to improve turn-around times for serum samples. RST tubes contain a thrombin-based clot activator resulting in a faster clotting time of around 5 min, compared to 30 min for standard serum tubes (BD). Previous studies reported reduced concentrations of some markers of haemolysis in RST specimens compared to other serum1,2 or plasma 1 samples. This may be explained by faster clotting giving a ‘more compact and robust clot, which results in less red cell disruption’. 2 Previous studies, however, were performed in settings with low rates of haemolysis (≤2% of samples haemolysed)1,2 and the effect has not been evaluated where higher rates of haemolysed samples may be expected.
We aimed to compare RST to plasma tubes for haemolysis markers in an Emergency Department (ED) setting, where increased rates of haemolysis are commonly seen.
Methods
Sample collection
Patients presenting to Christchurch Hospital ED over an eight-day period (5–13 June 2013) and who required a blood test, had an RST (REF368774, 5 mL), BD Vacutainer PST II (gel separator, lithium heparin plasma; REF367375, 4.5 mL) and a BD Vacutainer Heparin Tube (non-gel, lithium heparin plasma; REF367885, 6 mL) collected, unless clinically contraindicated. Blood was drawn by trained nursing staff, from an intravenous cannula (B. Braun Introcan Safety® 18 or 20 guage cannula) via a cannula connector valve (Alaris® SmartSite® needle-free valve), using an adaptor device (BD Vacutainer Luer-Lok™ access device) to which vacuum tubes could be attached. Cannulae were not flushed prior to sample collection; however, if a patient presented to ED by ambulance with a cannula already in situ, 5 mL of blood was discarded prior to collection. Correct order of draw was adhered to, with RST collected prior to the plasma samples. Samples were then promptly centrifuged at 2800 g for 10 min (at 23℃) in a swinging-bucket centrifuge (as is our current lab protocol) and analysed for six haemolysis markers. Although our centrifugation protocol uses a slightly higher relative centrifugal force (RCF) than BD recommends (i.e. 1300–2000 g and 1500–2000 g for 10 min for PST II and RST tubes, respectively), data from the tube manufacturer found haemolysis marker concentrations in RST tubes were similar at RCF 1500–3000 g (BD).
Reagents and materials
The haemolysis markers and assay methods (with reagent kit numbers) used in the study included: haemolysis index using a spectrophotometric method measured at multiple wavelengths, potassium using an ion-selective electrode (diluent 2P32-11, reference solution 1E49-20), phosphate using a spectrophotometric method with ammonium molybdate (7D71-31), aspartate aminotrasferase (AST) using an enzymatic method (7D81-21), magnesium using an enzymatic method with isocitrate dehydrogenase (3P68-31) and lactate dehydrogenase (LD) using an enzymatic method (2P56-12). All assays were from Abbott Diagnostics (Abbott Park, IL, USA) and were performed on either of two Abbott ARCHITECT i2000SR analysers.
Assay %CV from in-house QC data (and adult reference intervals used) are as follows: haemolysis index ≤ 5.5% (<0.5 g/L), potassium ≤ 2.1% (3.5–5.2 mmol/L), phosphate ≤ 4.2% (0.8–1.5 mmol/L), AST ≤ 1.9% (10–50 U/L), magnesium ≤ 2.9% (0.6–1.2 mmol/L) and LD ≤ 2.0% (110–220 U/L).
Statistical analysis
The data were tested for normality using Shapiro–Wilk normality test and differences between the groups assessed using Wilcoxon signed-rank test (for non-normally distributed data) and Paired t-test (if normally distributed). Differences in the proportion of results above the upper reference limit were assessed with Chi-square test statistic. Results were also compared using Bland-Altman plots, and statistical analyses were performed using SigmaPlot (Systat Software, San Jose, CA, USA) and SAS 9.3 (SAS, Cary, NC, USA) software.
Results
A total of 347 patient samples were included in the study (mean age 51.3 years (SD 23.1), 53.0% female) and 9.2% of the PST samples were haemolysed (free haemoglobin ≥ 0.5 g/L). The RST tubes had small but statistically significant increases in all of the haemolysis markers compared to both plasma tubes (P ≤ 0.005) except for LD which was lower in the RST group (P < 0.0001). All analyte data were non-normally distributed.
The proportion of results above the upper reference limit for the RST, PST and non-gel plasma groups, respectively, were haemolysis index 13.3% (46/347), 9.2% (32/347) and 11.0% (38/347); potassium 2.6% (9/347), 2.0% (7/347) and 3.2% (11/347); phosphate 3.5% (12/347), 2.3% (8/347) and 2.0% (7/347); AST 8.4% (29/347), 7.5% (26/347) and 8.1% (28/347); magnesium 0.6% (2/347), 0.3% (1/347) and 0.3% (1/347); and LD 52.7% (183/347), 68.0% (236/347) and 64.8% (225/347). There were no significant differences in the proportion of results above the upper reference limit between the tube groups except for LD which had a lower proportion of elevated results in RST than PST (χ2 = 16.29, P < 0.001) and non-gel plasma (χ2 = 10.00, P = 0.002) specimens.
Discussion
Our study found RST specimens had slightly higher concentrations of several haemolysis markers compared to plasma. This was supported our data showing small increases in haemolysis index, potassium, phosphate, magnesium and AST compared to plasma. The RST group, however, did not have a significantly higher proportion of haemolysis marker results above the upper reference limit than plasma.
These findings are consistent with a previous study comparing RST to PST tubes (n = 53) which found the RST group had higher mean concentrations of potassium and phosphate and lower LD compared to plasma. 1 They reported a difference between group means (RST − PST) for potassium and phosphate of 3.5% and 5.6%, respectively, but no samples in the study were haemolysed (≥0.5 g/L free haemoglobin). 1 A second recent study comparing RST to standard serum for haemolysis index, potassium and LD in a general practice setting (n = 296) found a reduction in LD in the RST group although only 2% of the samples were haemolysed. 2 Other previous studies comparing standard serum to plasma have demonstrated higher potassium and phosphate concentrations in serum, with differences in mean potassium values of 5.4–8.0%, attributed to rupture of cellular components during clot formation.1,3
In our study LD was lower in the RST group and discordant from the other markers of haemolysis. A possible explanation for this is increased frequency of outlier results in plasma samples, as duplicate errors and falsely elevated results have previously been reported for LD in plasma specimens due to microclots/cellular aggregates. 4 An on-board dilution step for plasma samples has been shown to reduce these errors 4 and is recommended by the manufacturer of our LD assay (Abbott Diagnostics), but in this study all samples were processed uniformly and assayed undiluted.
The elevated haemolysis rate of 9.2% seen in our study is consistent with a previous report in a similar ED setting. 5 This haemolysis rate is likely contributed to by collecting samples via an intravenous cannula, as is our local ED protocol, but is known to give higher rates of haemolysis compared to straight needle venipuncture. 6 The haemolysis in these samples may be attributable to the cannula itself, given that one previous study found no difference in haemolysis rates (at haemolysis index 0.8 or 1.2 g/L) in specimens collected through a cannula connector valve and those collected directly from the cannula. 7 In our study, samples were all collected via a cannula connector valve. Other collection factors such as incompletely filled collection tubes may also contribute to spurious potassium and LD elevations 2 ; however, specimens in our study were all collected by nursing staff trained in correct blood collection technique.
Comparison of results from three types of blood collection tubes, collected from 347 emergency department patients.
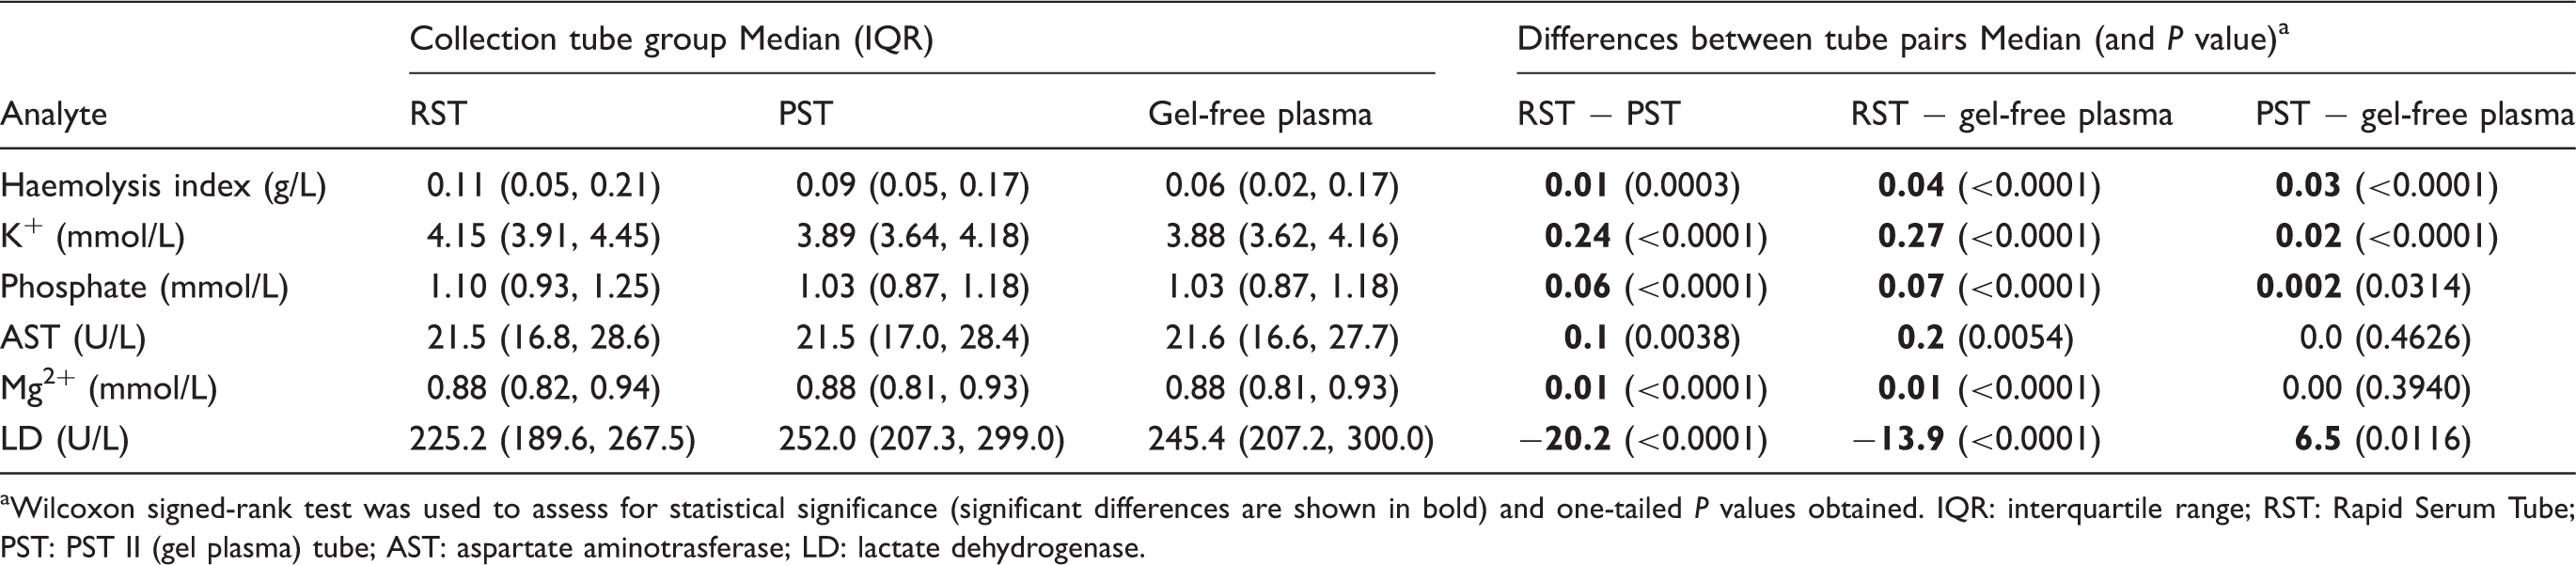
aWilcoxon signed-rank test was used to assess for statistical significance (significant differences are shown in bold) and one-tailed P values obtained. IQR: interquartile range; RST: Rapid Serum Tube; PST: PST II (gel plasma) tube; AST: aspartate aminotrasferase; LD: lactate dehydrogenase.
Footnotes
Acknowledgements
We would like to thank Ma Yi (biostatistician at Christchurch Hospital) for her assistance in analysing the data.
Declaration of conflicting interests
None declared.
Funding
BD provided sample tubes for the study but were not involved in the study design, data collection or analysis.
Ethical approval
Not required.
Guarantor
PMG.
Contributorship
All authors were involved in designing the study. JBR researched the literature, analysed the data and wrote the first draft of the manuscript. All authors reviewed and edited the manuscript and approved the final version of the manuscript.