
Abstract
Background
It has been suggested that fetuin-A may be a potential biomarker of cardiometabolic disease. However, few studies have investigated preanalytical factors that might impact the measurement of fetuin-A in the circulation. This pilot study aimed to investigate the preanalytical variables of sample type, timing of sample centrifugation and the impact of freeze–thaw cycles on the concentration of fetuin-A in serum or EDTA-plasma.
Methods
Blood samples were taken from 19 male or female healthy volunteers, aged 18–70 years, and left at ambient room temperature for 2 h or 48 h. The tubes were then centrifuged, serum and EDTA-plasma separated, and fetuin-A concentrations measured using a commercially available enzyme-linked immunosorbent assay (ELISA).
Results
There was no significant difference between the concentrations of fetuin-A in EDTA-plasma and serum following separation from whole blood at 2 h postcollection (P = 0.78). The median (interquartile range) concentrations of fetuin-A in EDTA-plasma separated at 2 h and 48 h postcollection were 589 µg/mL (484–703 µg/mL) and 767 µg/mL (687–942 µg/mL), respectively (P < 0.0005). For serum, equivalent concentrations were 606 µg/mL (501–669 µg/mL) at 2 h and 607 µg/mL (564–757 µg/mL) at 48 h postcollection (P = 0.06). Fetuin-A concentrations measured in EDTA-plasma and serum showed no significant change following three freeze–thaw cycles in samples separated at 2 h postcollection (EDTA-plasma P = 0.16; serum P = 0.89).
Conclusion
This small pilot study has shown that serum is preferable to EDTA-plasma for the measurement of fetuin-A. It has also shown that fetuin-A appears to be as stable after three freeze–thaw cycles as it is after one.
Introduction
Fetuin-A is a 60-kDa glycoprotein that is produced primarily in the liver. It is becoming an increasingly interesting potential biomarker of cardiometabolic disease. 1 Animal studies have identified its potential role in insulin resistance 2 via inhibition of the insulin receptor tyrosine kinase. 3 It is believed that elevated circulating concentrations of fetuin-A may be a risk factor for conditions such as type 2 diabetes mellitus, metabolic syndrome and non-alcoholic fatty liver disease.1,4,5 However, very few systematic studies have been undertaken and further epidemiological studies investigating fetuin-A are required so as to ascertain if this is the case. In order to facilitate future high-quality epidemiological studies that may be required to help identify the role of fetuin-A in disease, we aimed to investigate how stable this analyte was in vitro in blood samples post collection. In the present study, we describe the effect of sample type, delay before centrifugation and the effect of freeze–thaw cycles on fetuin-A concentration measured in serum and EDTA-plasma.
Methods
Blood samples were taken from 19 male or female healthy volunteers aged 18–70 years. There were no further inclusion criteria. Samples were fully anonymized, with no record to link the sample back to donor. Blood was collected using a single standard venepuncture procedure into Greiner Bio-One Vacuettes® (one of 4 mL volume containing K2EDTA and another of 5 mL volume with serum clot activator) and the collection tubes stored at ambient room temperature for 2 h or 48 h. Samples were then centrifuged at 1000 g for 15 min and EDTA-plasma or serum removed before being stored at −80℃ until use. On the day of the experiment, the frozen samples were left to thaw at room temperature for 1 h prior to analysis. All samples, regardless of sample type, underwent at least one freeze–thaw cycle.
Fetuin-A concentrations were measured using the R&D systems Quantikine® ELISA as per manufacturer’s instructions that included a 4000-fold dilution step. The method used a 7-point standard curve consisting of 1-in-2 serial dilution steps from the top standard, which had a fetuin-A concentration of 500 ng/mL, down to a bottom standard with concentration of 7.8 ng/mL. All samples, both EDTA-plasma and serum, whether separated at 2 h or 48 h post sample collection, were run on a single plate following a single freeze–thaw cycle. This was then repeated for EDTA-plasma and serum samples separated at 2 h following three freeze–thaw cycles. The positions of the samples on the plate were consecutive by patient number, and split according to whether they were separated at 2 h or 48 h post collection.
Intra and inter-assay imprecision (coefficient of variation [CV]) was determined by running 20 replicate control samples across five plates with at least two replicates on each plate.
Statistical analysis was performed on the various paired samples using non-parametric analysis (Wilcoxon signed-ranks test), since the data were not normally distributed. In addition, concentrations of fetuin-A in EDTA-plasma and serum separated at 2 h postcollection were compared using Bland–Altman analysis. All statistical analyses were performed using MedCalc v12.5.0 and Minitab v15.0 software, and P < 0.05 was regarded as statistically significant.
Ethical approval was given by the West of Scotland Research Ethics Committee (REC reference: 11/WS/0100).
Results
Two samples separated 2 h postcollection, which had a fetuin-A concentration of greater than 1200 µg/mL were excluded from analysis. This was done in order to avoid skewing the distribution as these samples represented clear outliers.
Fetuin-A concentrations in serum and EDTA-plasma (a) separated at 2 h postcollection following one freeze–thaw cycle; (b) separated at 2 h or 48 h postcollection following one freeze–thaw cycle and (c) separated at 2 h postcollection and subjected to one or three freeze–thaw cycles.
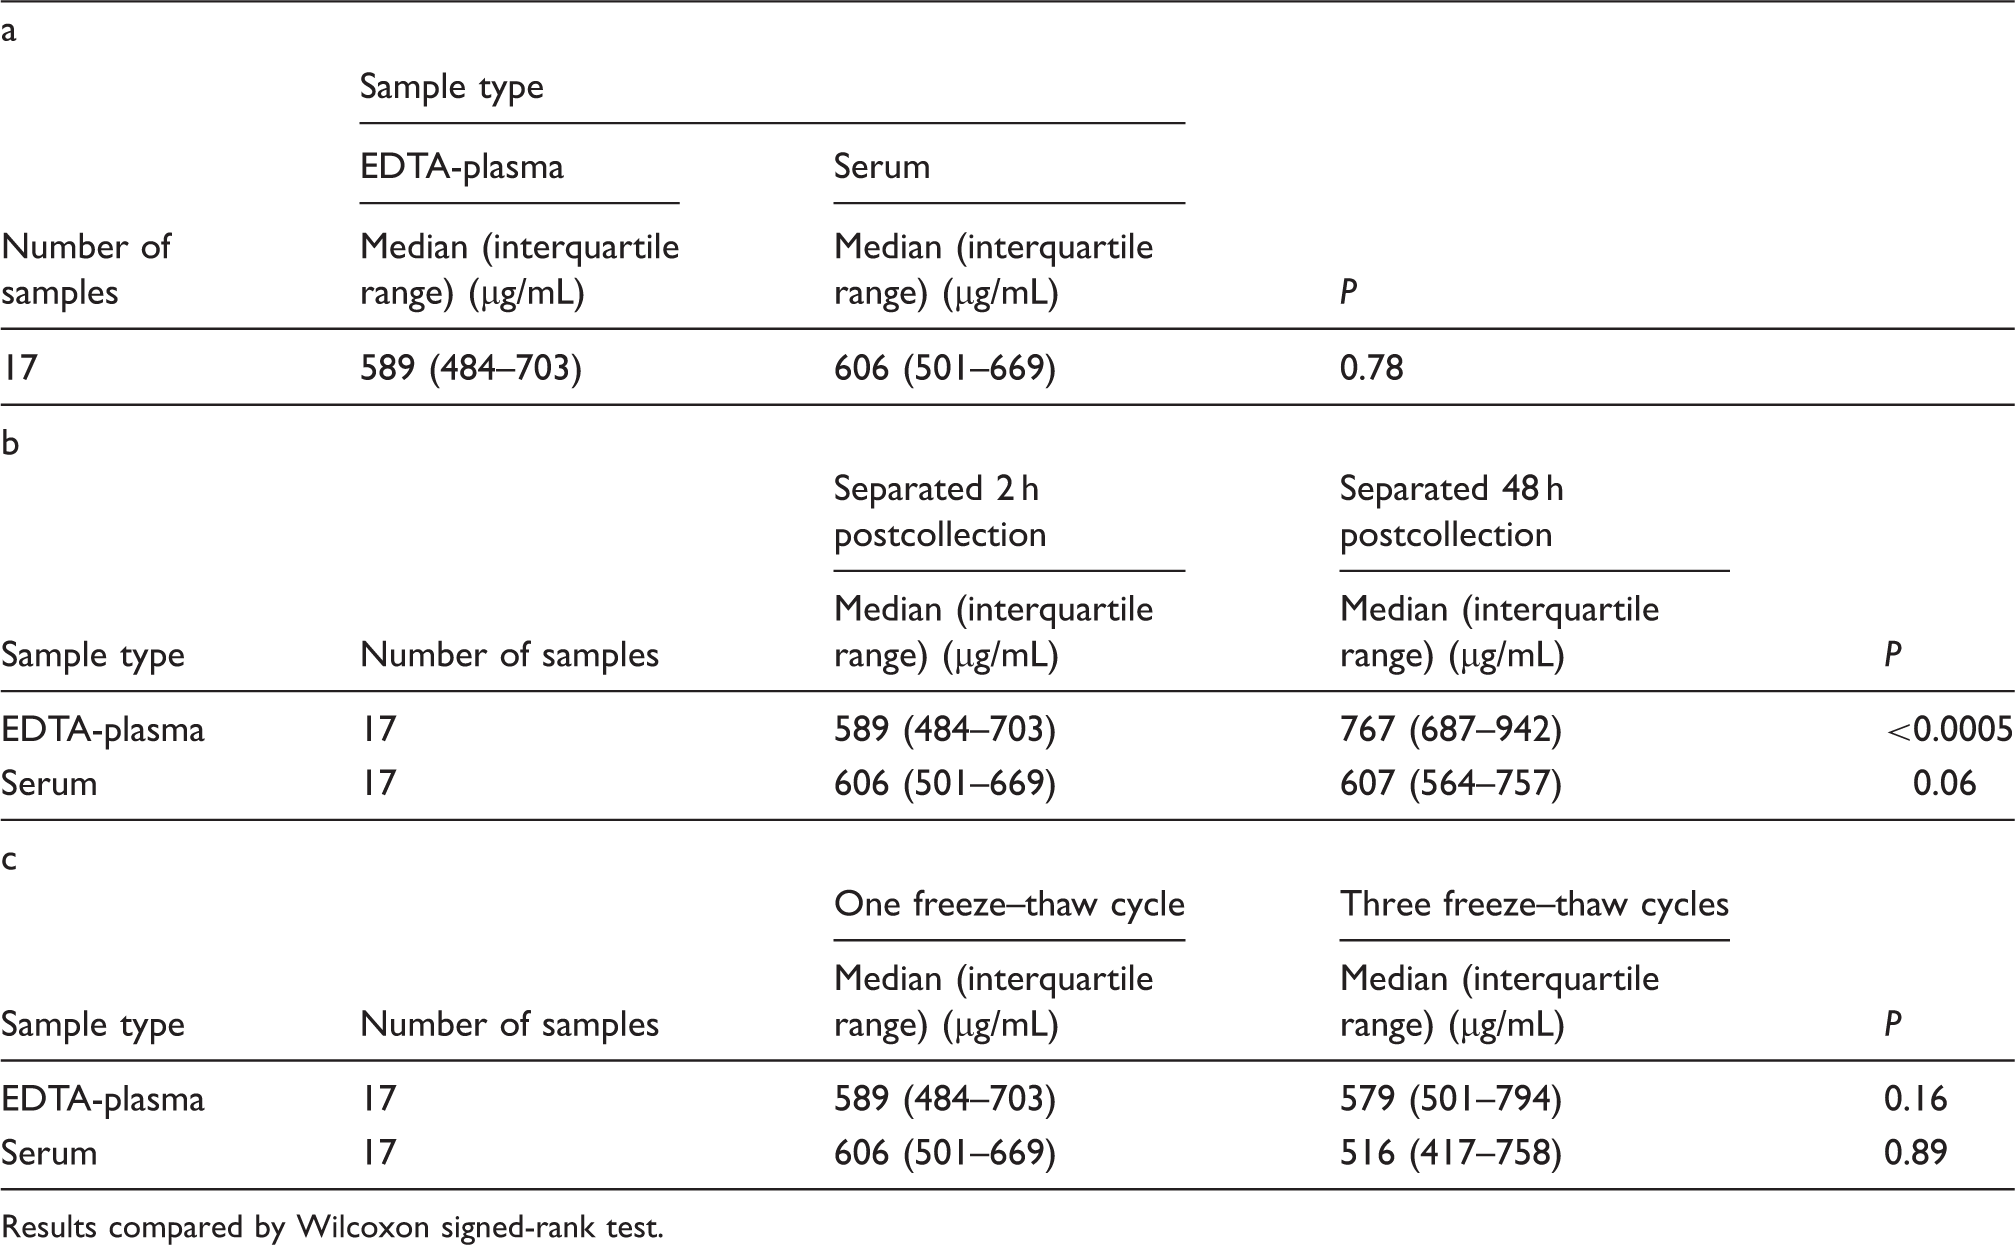
Results compared by Wilcoxon signed-rank test.
The median fetuin-A concentration in EDTA-plasma was 30.2% higher (P < 0.0005) in those samples separated at 48 h postcollection compared to its concentration in samples separated at 2 h postcollection. No such difference (P = 0.06) was observed in serum separated at these two time intervals (Table 1(b)).
Regardless of sample type, the concentrations of fetuin-A in samples separated 2 h post collection were not significantly different irrespective of whether the samples were subjected to one or three freeze–thaw cycles prior to measurement (Table 1(c); EDTA-plasma, P = 0.16; serum, P = 0.89).
Discussion
As far as we are aware, this is the first report that has investigated the effect of preanalytical variables on the measurement of circulating fetuin-A. Our findings show that there was no significant difference in fetuin-A concentrations measured in serum and EDTA-plasma, when these were separated 2 h after collection. However, in contrast to serum, concentrations in EDTA-plasma separated at 48 h after collection were significantly higher than those found in EDTA-plasma separated at 2 h post collection. Because of this, we therefore recommend that serum, rather than EDTA-plasma should be used as the preferred sample type. This is particularly important should there be any delay in samples reaching the processing laboratory, prior to separation.
The reason why fetuin-A concentrations appeared to be higher in EDTA-plasma when separated at 48 h post collection compared to plasma separated at 2 h post collection is unknown. It may be due to a release of fetuin-A from circulating cells or its dissociation from blood components enhanced by EDTA, but we have no evidence for this. Although fetuin-A is regarded as a protein primarily secreted from the liver, fetuin expression has been found in monocytes and macrophages, 6 thus identifying a possible source, which needs further investigation.
This study has also shown that, regardless of specimen type, in samples separated 2 h after collection, there were no differences in fetuin-A concentrations between samples subjected to three freeze–thaw cycles compared to those subjected to one. However, we did not compare fetuin-A concentrations in samples analysed immediately following separation, i.e. without undergoing any freeze–thaw cycle. Further work is therefore required to investigate whether fetuin-A concentrations change following a single freeze–thaw cycle.
During this study, we identified two samples with fetuin-A concentrations greater than 1200 µg/mL. Following expert statistical advice, we excluded these from the statistical analysis as gross outliers. However, we do not have a satisfactory explanation for this finding and this remains a limitation of this pilot study. In addition, this study is relatively small. Nevertheless, despite these limitations, we believe that these preliminary findings have laid the foundation for future studies, using larger populations, to confirm and extend the results described here, including the frequency of outlier values.
Footnotes
Acknowledgements
We would like to thank the British Heart Foundation for funding this work.
Declaration of conflicting of interests
None declared.
Funding
LM holds a BHF 4-year studentship FS/12/66/30003, which funded assay costs. PW is supported by BHF Intermediate Basic Scientist Fellowship FS/12/62/29889.
Ethical approval
West of Scotland Research Ethics Committee (REC number: 11/WS/0100).
Guarantor
PW.
Contributorship
JL, PW, LJ and NS designed the study. LJ and JL recruited patients and processed samples. PW and LM performed statistical analyses. LM wrote the first draft, and PW NS LJ and JL revised it for important intellectual content.