
Abstract
Background
Total reflection X-ray fluorescence is a comparably new method for the measurement of trace elements in biological samples.
Methods
Results obtained by total reflection X-ray fluorescence were compared to atomic absorption spectroscopy for Cu and Zn and inductively coupled plasma mass spectrometry for Cu, Zn and Se in patient serum. The total reflection X-ray fluorescence assay was characterized for accuracy; recovery; intra- and inter-assay imprecision (using patients’ samples, external quality assurance and quality control materials); limit of blank; limit of detection; linearity; interference and stability of prepared samples.
Results
Minimal sample preparation is required for total reflection X-ray fluorescence and simultaneous multi-elemental analysis is possible in clinical samples. There was a small positive bias for Cu and Zn measurements using total reflection X-ray fluorescence compared to atomic absorption spectroscopy and inductively coupled plasma mass spectrometry and a significant negative bias for Se measurements by total reflection X-ray fluorescence relative to inductively coupled plasma mass spectrometry. Recovery, imprecision and linearity were acceptable. The limit of detection was shown to be 1.2 μmol/L for serum Cu, 1.8 μmol/L for serum Zn and 0.2 μmol/L for serum Se.
Conclusions
Measurement of Cu and Zn in serum samples using total reflection X-ray fluorescence would be a viable alternative to atomic absorption spectroscopy or inductively coupled plasma mass spectrometry. The volatility of some Se compounds results in lower Se results being reported using total reflection X-ray fluorescence and further work would be necessary to identify whether total reflection X-ray fluorescence has an acceptable clinical sensitivity and specificity for the assessment of Se deficiency. Measurement of copper, zinc and selenium on whole blood samples is possible using total reflection X-ray fluorescence which may provide a more accurate assessment of trace element deficiency for patients with an acute phase response.
Keywords
Introduction
Total reflection X-ray fluorescence (TXRF) is a form of fluorescence spectroscopy whereby a sample is irradiated with a beam of X-rays with sufficient energy to remove an electron from one of the inner orbitals generating an unstable atomic state for the element. 1 An electron from one of the outer orbitals relocates to fill the empty space in the inner orbital releasing energy in the form of fluorescence. The wavelength of the fluorescent light which is emitted is characteristic for each element, which shows a specific K and L line pattern in the spectrum depending on the orbitals involved. The specific intensity of fluorescence is proportional to the concentration of a given element. With the addition of a known quantity of a rare element such as gallium to each sample, the concentrations of the other elements present in the sample can be determined. Because of the low fluorescence energy and excitation probability the analysis of light elements (Z < 12) is not possible with low power TXRF instruments. All other elements from Al to U can be analysed. Samples must be prepared on a reflective medium such as a polished quartz glass disc and dried to a thin microparticulate layer or film. As this is a solid-phase analysis, it is suitable for a wide variety of sample types ranging from dried solutions (whole blood, plasma, serum, urine) to solids (tissue samples, hair). Although widely used in environmental science for elemental analysis, this technology is not commonly used in clinical laboratory medicine. This study was conceived to compare the performance of TXRF analysis using the Bruker PICOFOX instrument with the reference laboratory methods for measurement of trace metals, atomic absorption spectroscopy (AAS) and inductively coupled plasma mass spectrometry (ICP-MS).
Materials and methods
Reagents and conversion factors
Gallium standard (1 g/L) and polyvinyl alcohol (PVA) (0.3 g/L) were supplied by Carl Roth GmbH, Germany, and copper (Cu)/zinc (Zn) standard solutions (1 g/L) were purchased from VWR International, Leicestershire, LE17 4XN. Serum quality control (QC) material for Cu and Zn was obtained from Technopath, Co., Tipperary, Ireland. Bovine serum albumin Heat Shock standard grade powder pH 7.0 was purchased from VWR. Nitric acid (approximately 69%) and Triton X-100 detergent were purchased from VWR. To convert μg/L units to μmol/L for Cu, Zn and selenium (Se), conversion factors of 0.0157, 0.0153 and 0.0127 were used, respectively.
Sample preparation for TXRF using the PICOFOX
Serum samples were analysed neat without any prior dilution. Whole blood samples were diluted and lysed by addition of 100 μL H2O to 100 μL whole blood collected into a tube containing EDTA or lithium heparin anticoagulant. Each test specimen contained 10 μL of gallium internal standard (stock concentration of 10 mg/L, prepared by diluting commercially available 1 g/L standard in distilled water), 10 μL PVA (stock concentration 0.3 g/L) and 100 μL of patient serum or whole blood lysate. After vortexing, 10 μL of test specimen was pipetted onto the centre of a quartz glass carrier disc supplied by Bruker. The disc was dried on a hotplate for 10 min at 40°C and then presented to the PICOFOX analyser.
Sample preparation for the AAS
A fixed volume of calibrator/control/patients’ sample was prediluted with a solution consisting of 1% Triton X-100 and 1% nitric acid. The diluted samples were vortexed prior to analysis.
TXRF method
Samples were irradiated for 1000 s for each sample during data collection. A method was programmed into the PICOFOX as per manufacturer’s instructions to enable analysis of a number of different elements simultaneously. Quantification in TXRF is based on internal standardization based on the measured set-up calibration of the applied instrument. 2 Calibrations were not adjusted for individual elements.
AAS method
Diluted samples were aspirated into an acetylene flame on the Varian AA280FS atomic absorption spectrometer. Cu and Zn concentrations are calculated automatically using fast sequential analysis on the same sample dilution from the relative absorbances using the associated SpectrAA software. Reference intervals for Cu and Zn are as follows: Cu 11.0–25.1 μmol/L, Zn 11.4–24.8 μmol/L independent of age and sex. The limit of quantification has been shown to be 2.0 μmol/L for Cu and 0.3 μmol/L for Zn. The reference intervals and limits of quantitation were derived in the laboratory from a combination of patient data and published references.
ICP-MS
Results for the ICP-MS analysis were provided by laboratories at the University Hospital of Wales, Cardiff and Southampton University Hospital. In Southampton, Cu, Zn and Se concentrations were determined by ICP-MS using a NexION300D (Perkin-Elmer, Beaconsfield). For each analyte, samples were run against a matrix-matched calibration curve, spiked with the standard solution. The elements were measured against calibrations standards of up to 50 μmol/L for plasma Cu and Zn (Cu standard solution 1000 ppm and Zn standard solution 1000 ppm, Fisher Chemicals) and 3.0 μmol/L for selenium (Se standard solution 1000 ppm, Fisher Chemicals). Sample volumes for the calibration, test and QC were diluted quantitatively one in 50 with 0.02% nitric acid for Cu/Zn and 0.5% butanol for selenium. The internal standard was rhodium and isotopes 65Cu, 66ZnI and 78Se were measured with methane used as the dynamic reaction cell gas for selenium analysis. In Cardiff, samples were analysed using an Agilent 7700 ICP-MS after dilution one in 20 in an alkaline solution using scandium and germanium as internal standards.
Method validation
Patient comparison
Forty-three patient serum samples were analysed by TXRF. The results were compared to those obtained by AAS (n = 42 for Cu and n = 43 for Zn) and ICP-MS (n = 25 for Cu, n = 22 for Zn and n = 23 for Se) using Deming regression and Altman Bland statistical analyses. Some of the patients’ samples were of insufficient volume for analysis by all three methods as indicated in the text. Samples used were those received in the laboratory for routine analysis of serum Cu and Zn by AAS or other routine analyses (e.g. serum from pregnant patients was used to provide samples with high serum Cu concentrations). All samples were anonymized prior to analysis.
Accuracy
Accuracy of the TXRF results was determined by analysis of 19 External Quality Assessment (EQA) samples supplied by UK National External Quality Assessment Scheme (NEQAS) (TEQAS) and comparison of results with the all laboratory trimmed mean (ALTM) using linear regression with the ALTM as the independent variable and also by Altman Bland analysis.
Recovery
Recovery was determined by addition of a standard solution containing both Cu and Zn to three separate patient serum samples. A 1/10 dilution of commercially available 1 g/L Cu and Zn standards was prepared by adding 100 μL of each standard to 800 μL water, 10 μL of which was added to 1 mL of patient serum. Cu and Zn were measured on both the unspiked serum and the spiked sample. The recovery for both Cu and Zn was obtained independently by subtracting the value obtained for the patients’ sample from the value obtained from the spiked sample and the recovery was expressed as a percentage of the amount of the Cu/Zn standard solution which had been added.
Assay imprecision
Intra- and inter-assay imprecision were determined by daily analysis of four patients’ samples, one external quality assurance (EQA) material, and a commercially available QC material for serum Cu and Zn over six days for inter-assay imprecision and analysis five times on the same day to determine the intra-assay imprecision. These results were used to plot precision profiles from which the limit of quantitation was determined, as defined by a CV of less than 10%.
Limit of blank and limit of detection
The limit of blank was determined from the mean + 2SD (as an approximation to the 97.5th percentile) of replicate (n = 5) analyses of a solution containing 40 g/L bovine serum albumin dissolved in 0.9% saline solution which had negligible concentrations of 1 μmol/L Cu, 0.4 μmol/L Zn and 0.1 μmol/L Se as measured by TXRF. The limit of detection was calculated from 2SD obtained from repeated analysis of a sample containing low concentrations of Cu, Zn and Se, added to the mean concentration of Cu, Zn and Se reported for the solution containing 40 g/L bovine serum albumin in 0.9% saline.
Linearity
Linearity was determined for Cu by taking a serum sample from a postpartum patient and preparing a series of samples containing different concentrations of Cu by adding different amounts of this serum to an EQA sample containing minimal concentrations of Cu. The linearity for Zn and Se was determined from adding different amounts of the Technopath QC material to an EQA sample containing minimal concentrations of Zn and Se.
Interference from haemolysis
Interference from haemolysis was determined by centrifugation and removal of some of the plasma from a whole blood sample collected into lithium heparin preservative and then passing the remainder of the sample repeatedly through a narrow bore needle and syringe to haemolyse the red blood cells. The sample was then centrifuged a second time to remove intact red blood cells and other cellular debris and the haemolysed plasma and original plasma mixed in variable amounts to produce a range of samples with different degrees of haemolysis. Cu and Zn were measured on these samples using the TXRF. The degree of haemolysis was quantified by the method used to generate a haemolytic index on the Roche Cobas automated chemistry analytical equipment.
Sample stability
The stability of samples was determined by repeated analysis of serum samples to which internal standard and PVA had been added before and after storage at 4°C for four days.
Acute phase response
The difference between serum and whole blood Cu and Zn concentrations for patients with an acute phase response was determined by analysis of Cu and Zn on both serum and whole blood samples for patients with a serum C-reactive protein (CRP) concentration over 300 mg/L. CRP was measured using the Roche Cobas particle-enhanced immunoturbidimetric assay.
Statistical analysis
Data were processed using Analyse-IT version 2.30 method validation version for Excel and the Variance Function Program version 12.0, released August 2014, WA Sadler, New Zealand.
Results
Comparison between TXRF and results obtained by AAS and ICP-MS for patients’ samples
There were no significant differences between Cu and Zn measurements using TXRF compared to results obtained by AAS using Deming regression (P > 0.05), but there were significant positive biases for both Cu and Zn using Altman Bland analysis, P = 0.0018 for Cu, bias +4.6% and P < 0.0001, bias +6.8% for Zn. There were significant positive biases for Cu and Zn measurements using TXRF compared to ICP-MS using both Deming regression and Altman Bland analysis (7.4 and 9.6%, respectively). There was a 28.1% negative bias for Se measurements using TXRF compared to those obtained using ICP-MS. Results are shown in Figure 1.
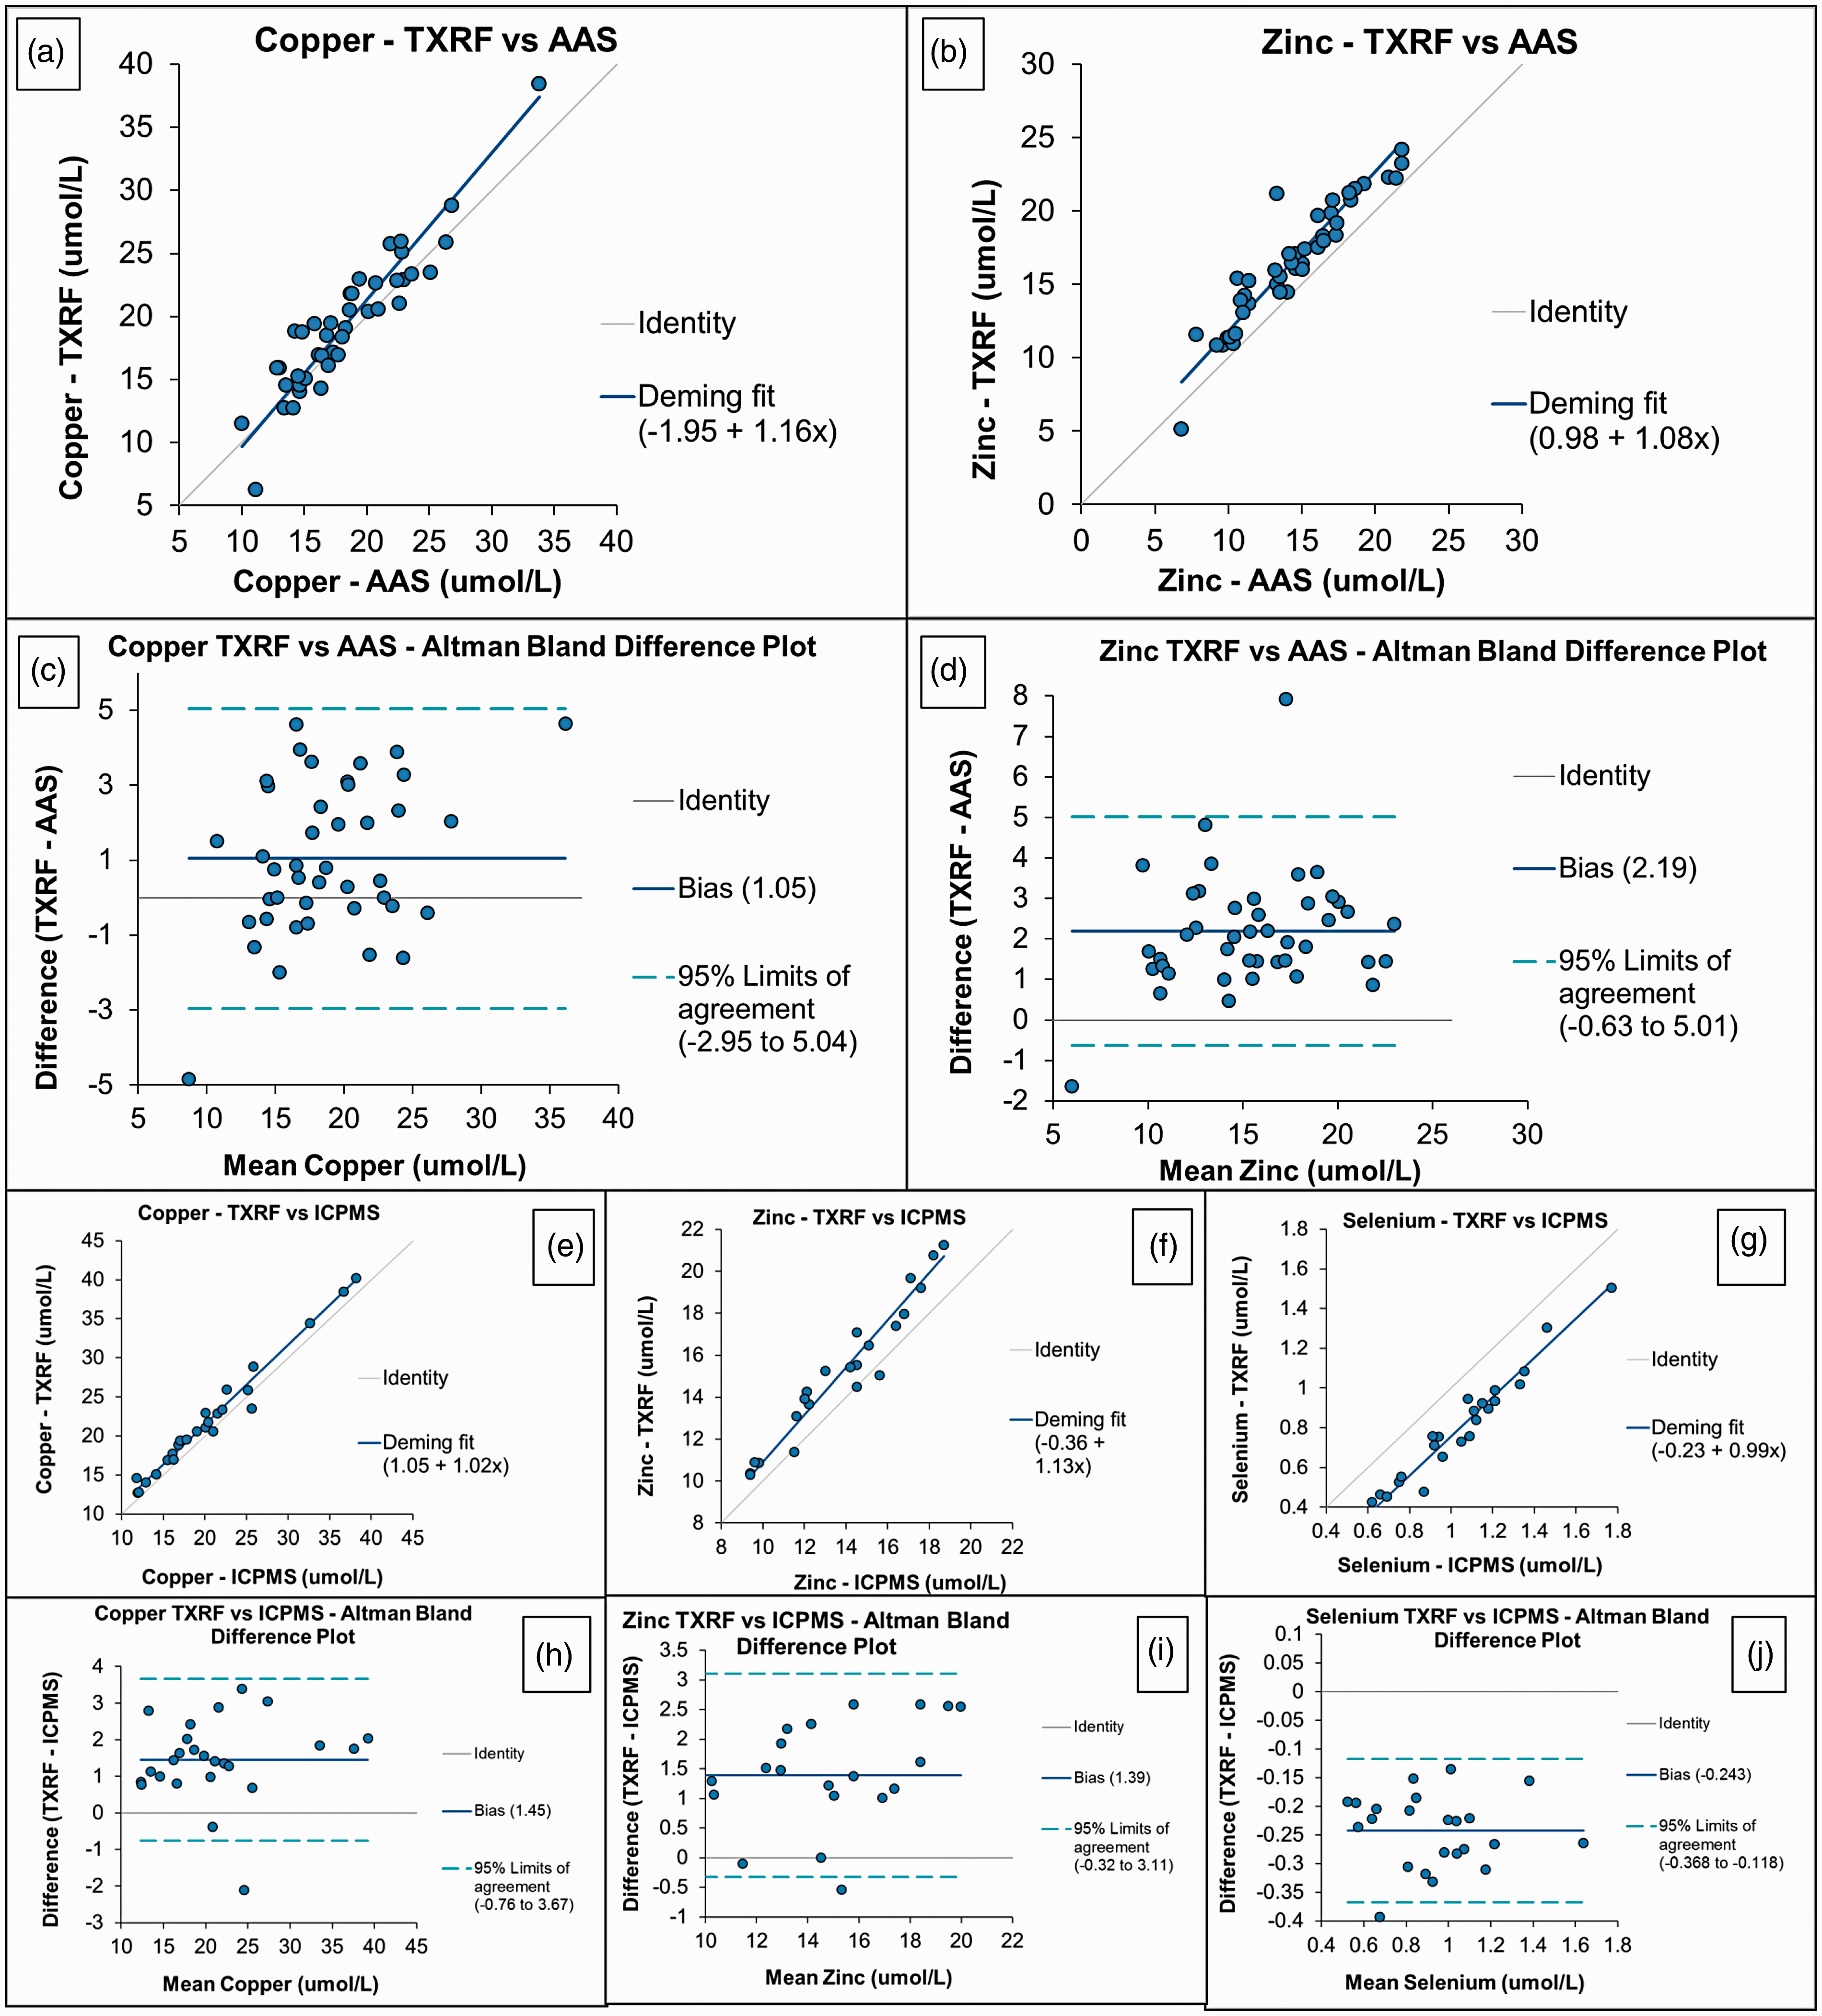
Comparison between TXRF and AAS results for Cu and Zn in patient serum samples. (a) and (b) Deming regression, (c) and (d) Altman Bland plots. Comparison between TXRF and ICP-MS results for Cu, Zn and Se in patient serum samples. (e) to (g) Deming regression. (h) to (j) Altman Bland plots. (a) Copper – TXRF versus AAS, (b) zinc – TXRF versus AAS, (c) copper TXRF versus AAS – Altman Bland difference plot, (d) zinc TXRF versus AAS – Altman Bland difference plot, (e) copper – TXRF versus ICP-MS, (f) zinc – TXRF versus ICP-MS, (g) selenium – TXRF versus ICP-MS, (h) copper TXRF versus ICP-MS – Altman Bland difference plot, (i) zinc TXRF versus ICP-MS – Altman Bland difference plot and (j) selenium TXRF versus ICP-MS – Altman Bland difference plot. AAS: atomic absorption spectroscopy; ICP-MS: inductively coupled plasma mass spectrometry; TXRF: total reflection X-ray fluorescence.
Accuracy of measurement of serum Cu, zinc and selenium using TXRF
There were no significant differences between TXRF and the ALTM for EQA samples for Cu (P = 0.1282) and Zn (P = 0.2397) on Altman Bland analysis, but a significant negative bias for Se results (P < 0.0001) obtained using TXRF relative to the ALTM on EQA. Results are shown in Figure 2.
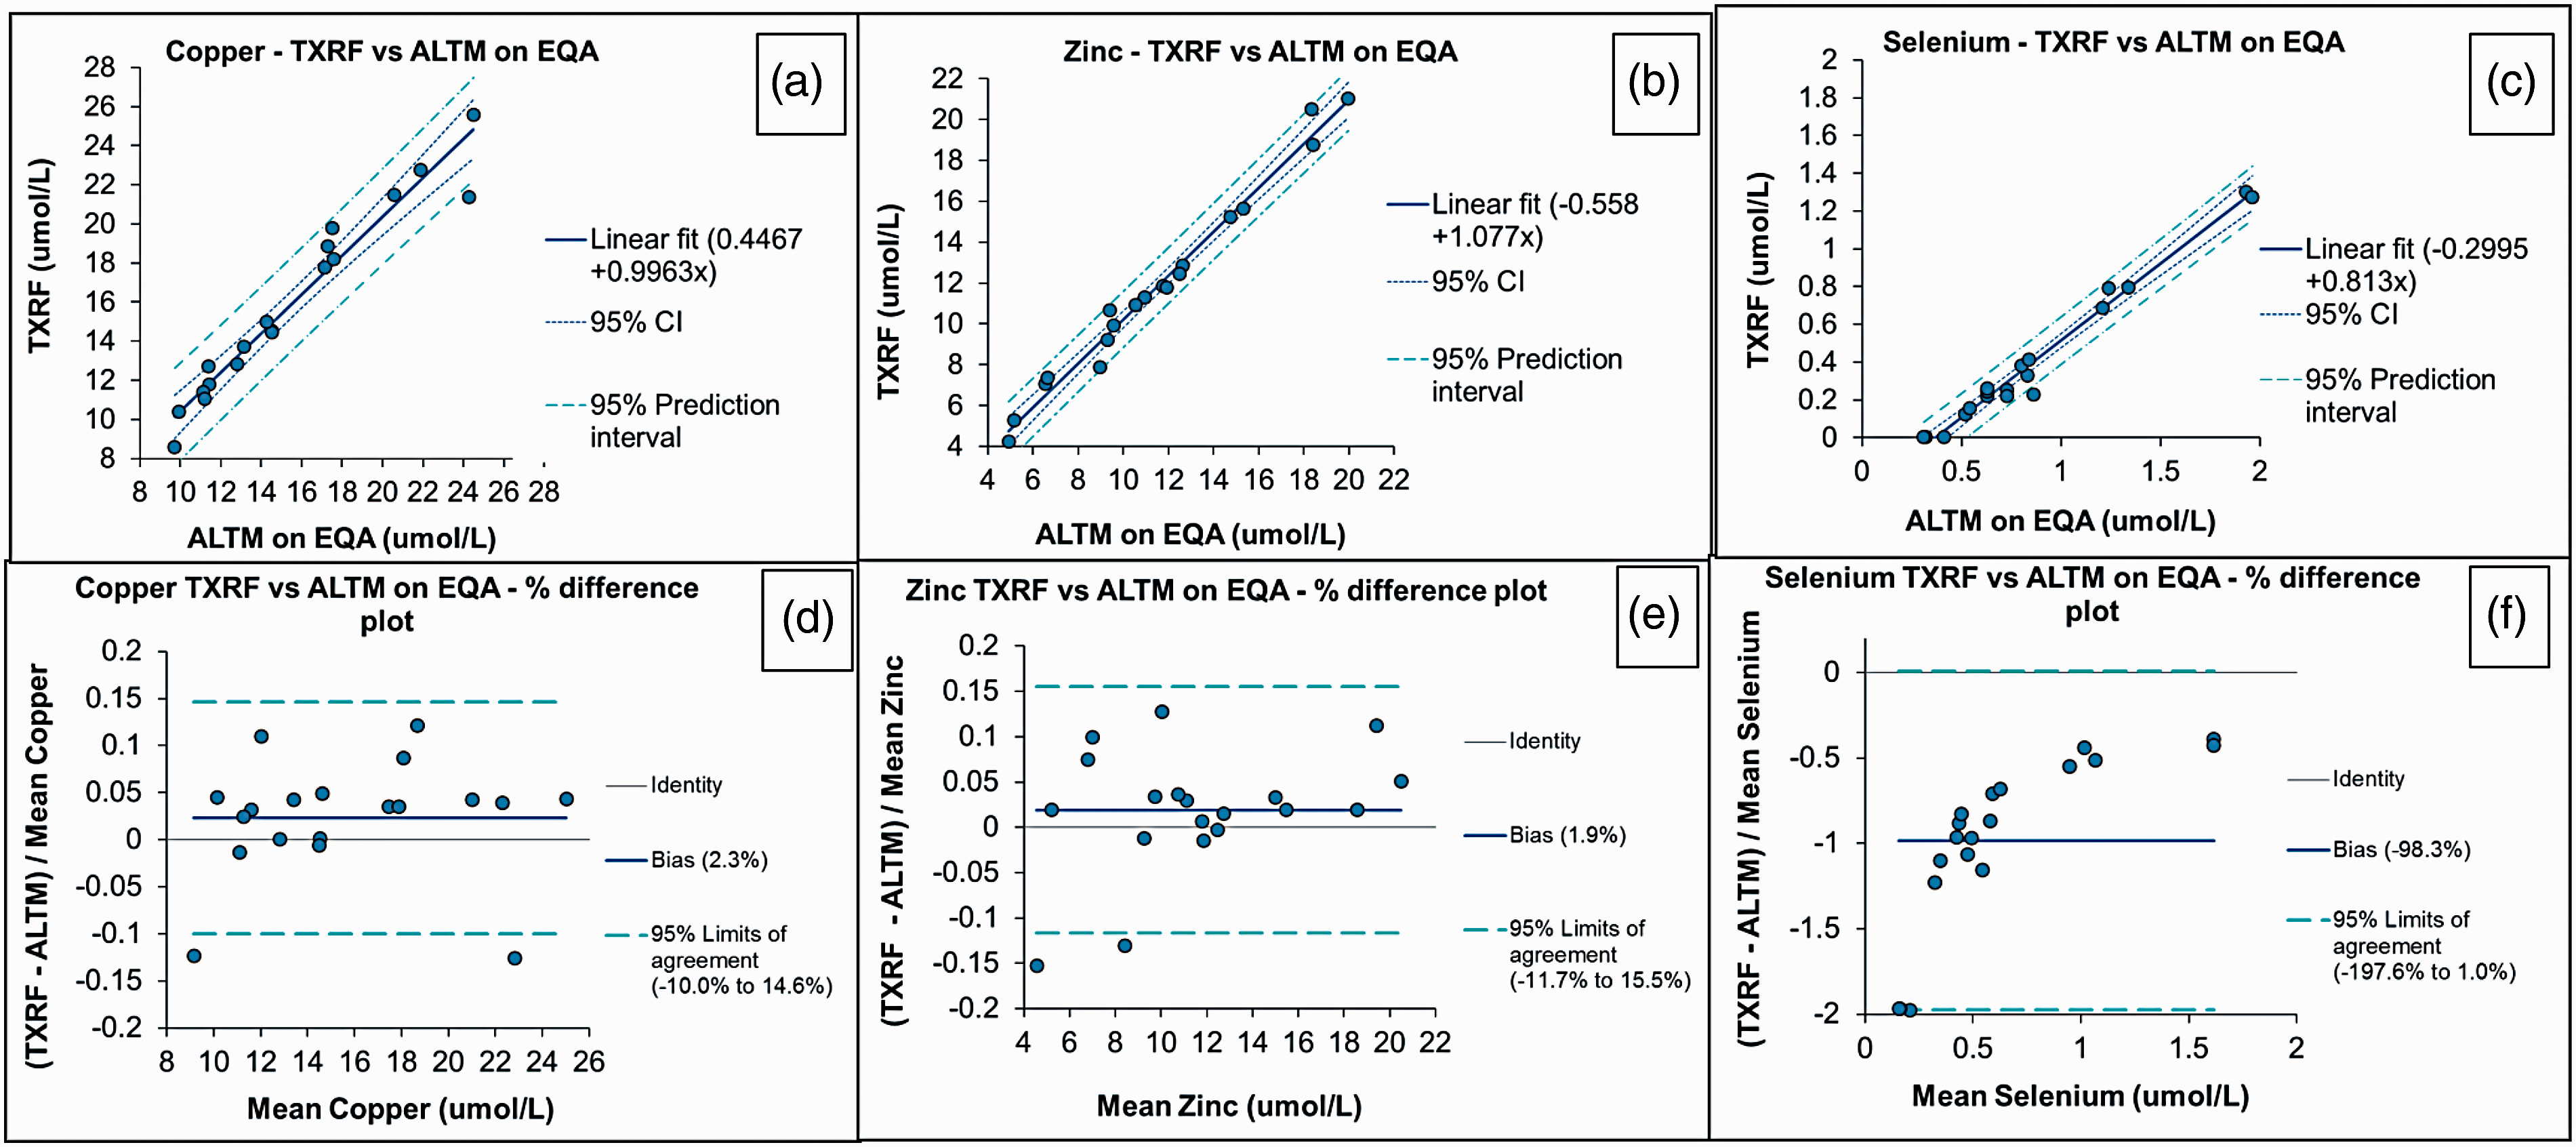
Accuracy of TXRF analysis as determined using EQA material for serum Cu, Zn and Se. (a) to (c) Deming regression. (d) to (f) Altman Bland plots. (a) Copper – TXRF versus ALTM on EQA, (b) zinc – TXRF versus ALTM on EQA, (c) selenium – TXRF versus ALTM on EQA, (d) copper TXRF versus ALTM on EQA – % difference plot, (e) zinc TXRF versus ALTM on EQA – % difference plot and (f) selenium TXRF versus ALTM on EQA – % difference plot. ALTM: all laboratory trimmed mean; EQA: External Quality Assessment; TXRF: total reflection X-ray fluorescence.
Recovery
Recovery data show an over recovery for Cu and Zn in serum samples which correlates with the positive bias shown for results for Cu and Zn obtained using TXRF relative to those obtained by AAS and ICP-MS. Recovery data for Cu and Zn using spiked serum samples from three separate patients are shown in Table 1.
Recovery data for serum copper and zinc using TXRF.
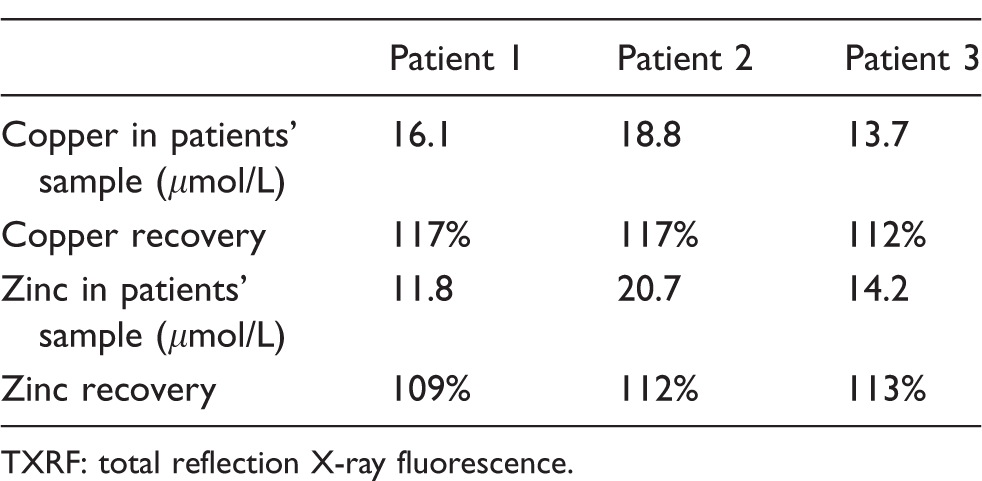
TXRF: total reflection X-ray fluorescence.
Imprecision and limit of quantitation
Intra- and inter-assay CVs were less than 10% over the concentration range 7.3–34.5 μmol/L for Cu, 7.4–30.9 μmol/L for Zn and 0.8–3.1 μmol/L for Se and a CV of 11.1% was obtained for a QC sample with a Se concentration of 0.2 μmol/L. There was insufficient data to formally assess the limit of quantitation below a concentration of 7.3 μmol/L for Cu, 5.2 μmol/L for Zn and 0.2 μmol/L for Se. Precision profiles for inter and intra-assay imprecision for serum Cu, Zn and Se are shown in the Supplementary Information (Supplementary Figure 1).
Limit of blank and limit of detection
The limit of blank was shown to be 1.1 μmol/L for serum Cu, 1.4 μmol/L for serum Zn and 0.13 μmol/L for serum Se. The limit of detection for the assay was shown to be 1.2 μmol/L for serum Cu, 1.8 μmol/L for serum Zn and 0.2 μmol/L for serum Se.
Linearity for measurement of serum Cu, Zn and Se
The TXRF measurement of serum Cu was linear over the range 10–35 μmol/L, over the range 5–33 μmol/L for serum Zn and over the range 0.2–1.1 μmol/L for serum Se (0.2 μmol/L being the limit of detection for the Se assay). Graphs are provided in the Supplementary Information (Supplementary Figure 2).
Interference from haemolysis
Progressive haemolysis up to a haemoglobin concentration of 400 mg/dL has no effect on serum Cu concentrations, but serum Zn concentrations increase and serum Se concentrations decrease proportionally in relation to the degree of haemolysis. Results are shown in Figure 3.
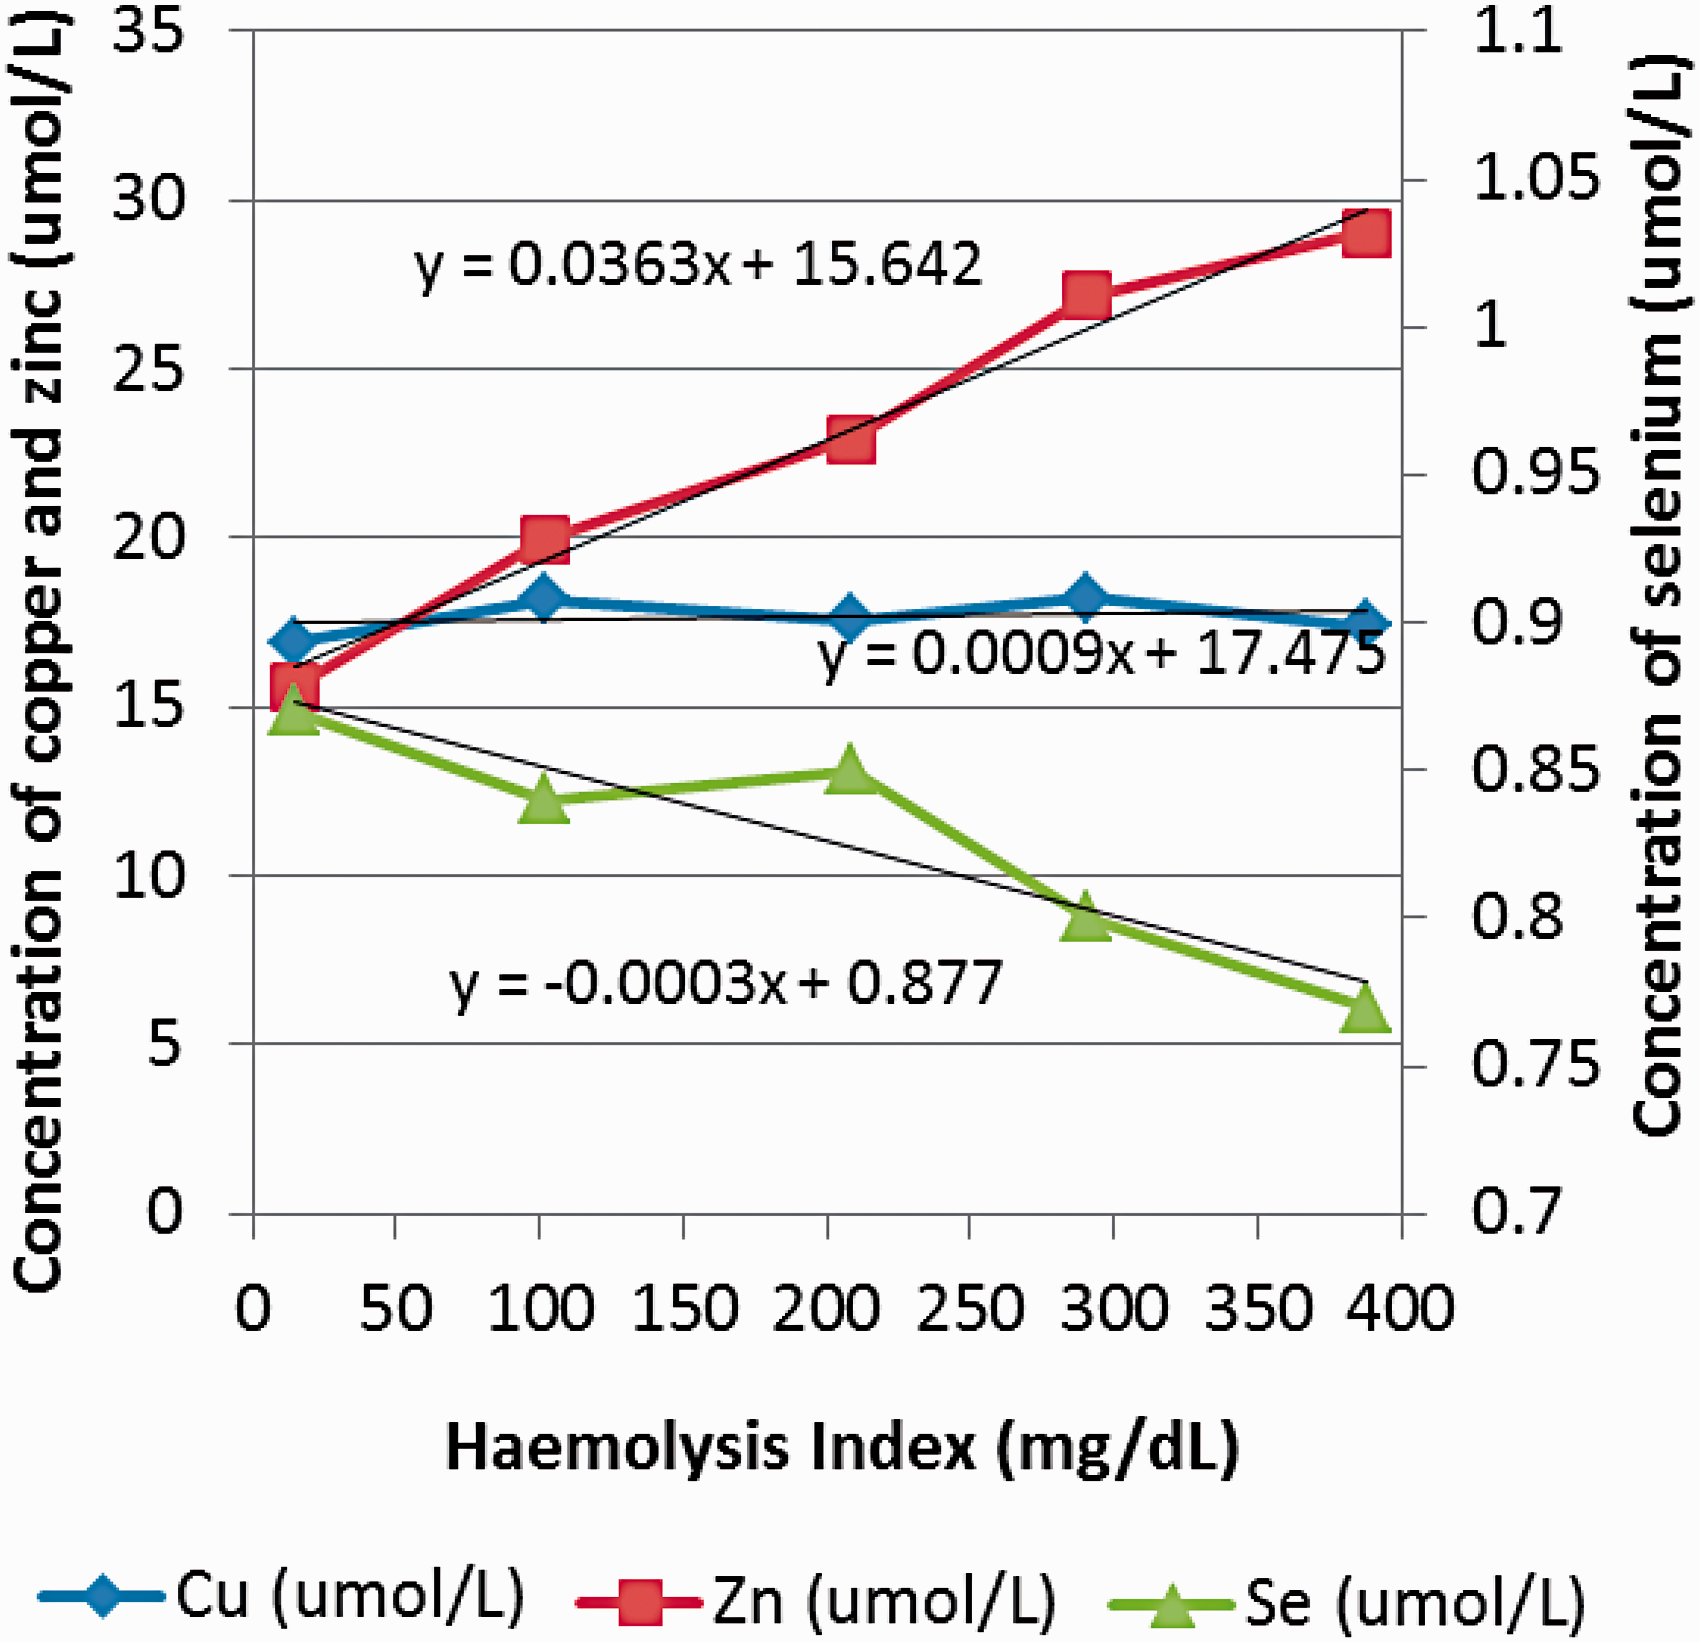
Effect of increasing haemolysis on serum Cu, Zn and Se concentrations.
Sample stability
After addition of gallium internal standard and PVA the concentrations of Cu, Zn and Se show variable increases over four days storage at 4°C. Results are shown in Figure 4.
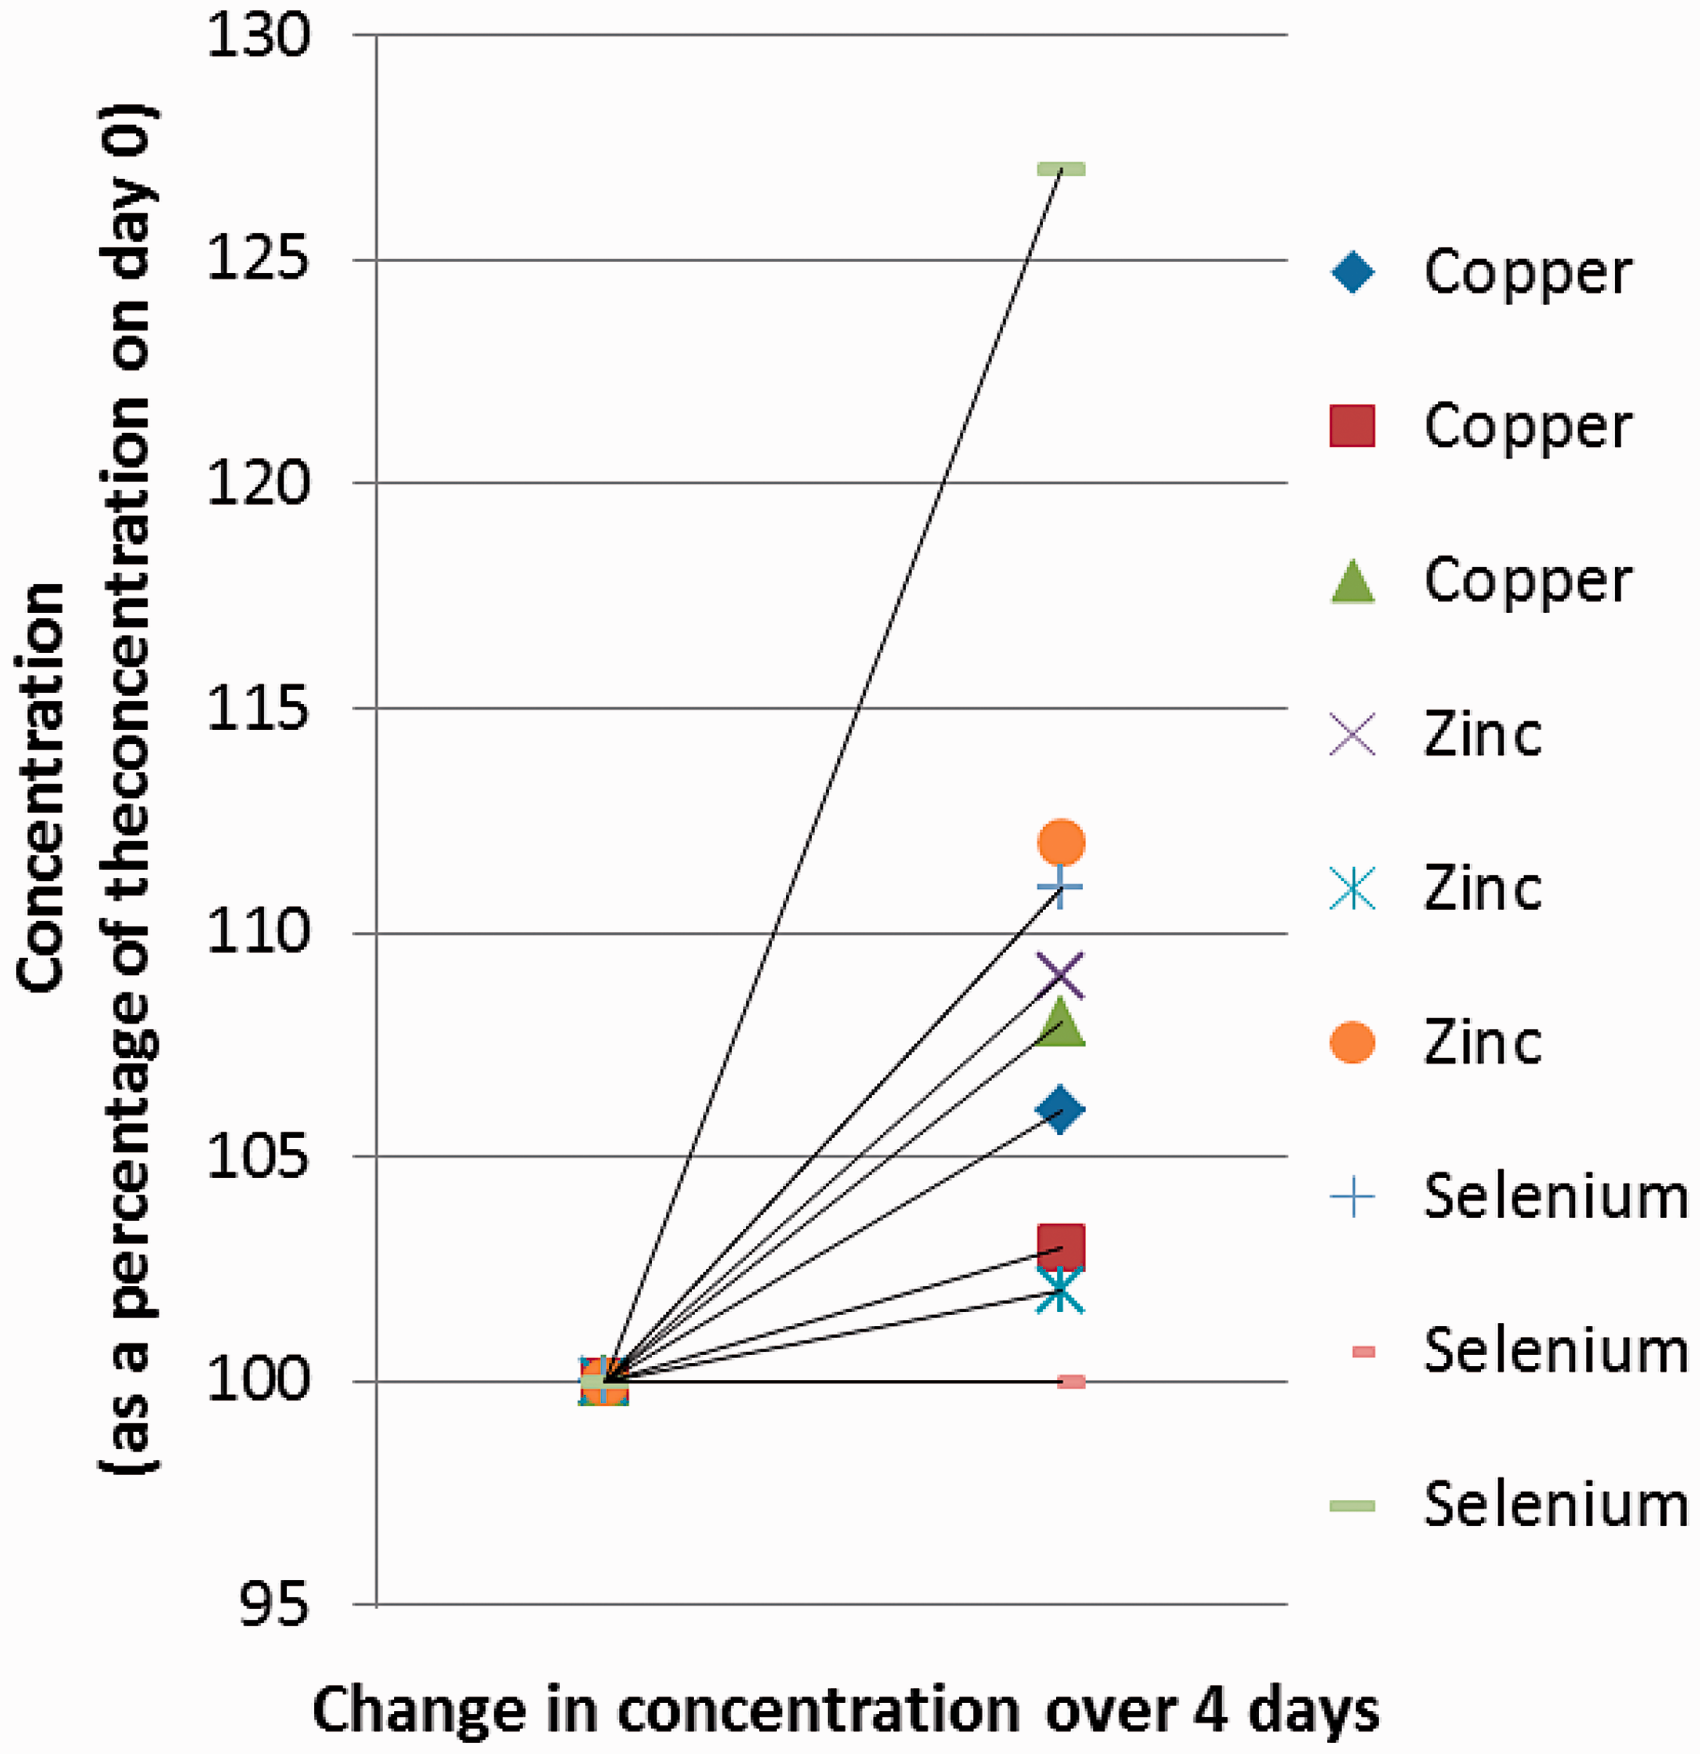
Stability of Cu, Zn and Se measured on serum samples after the addition of internal standard and PVA following storage at 4°C for four days.
Effect of the acute phase response on Cu, Zn and Se measurements
Cu concentrations are higher in serum compared to whole blood for patients with an acute phase response and Se concentrations are lower. It is difficult to evaluate the effect of the acute phase response for Zn because the concentration of these elements is different in whole blood samples relative to serum. Results are provided in Table 2.
Effect of the acute phase response on copper, zinc and selenium measurements.
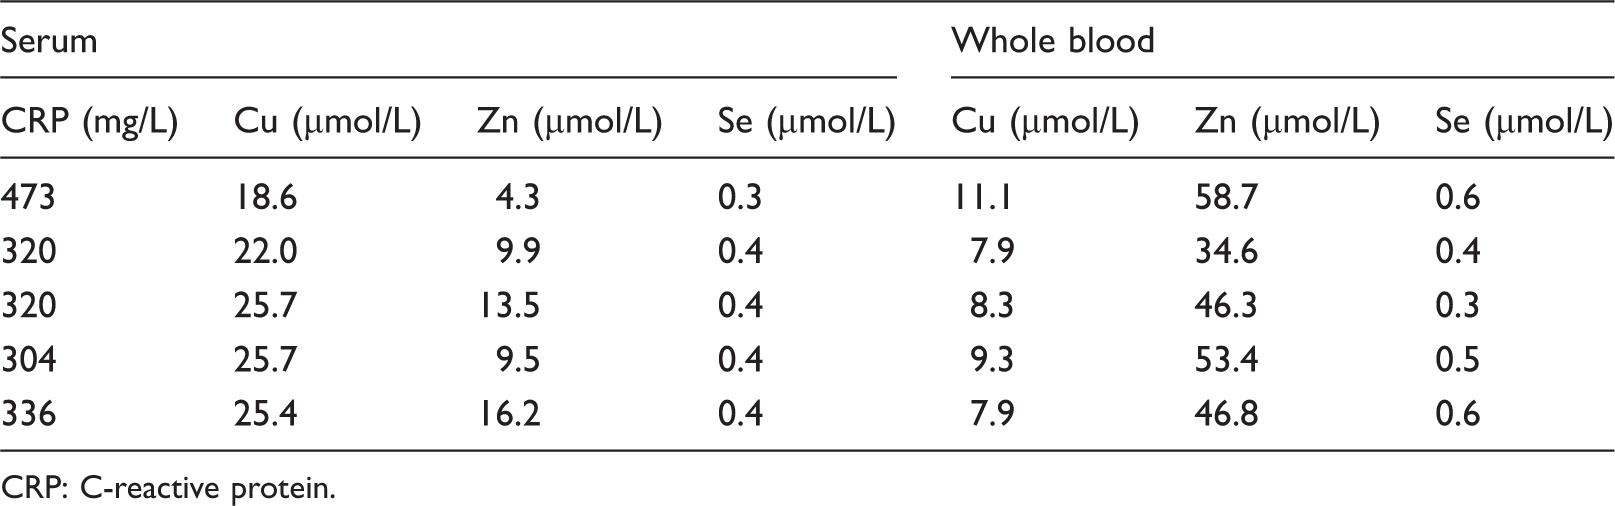
CRP: C-reactive protein.
Discussion
The data in this paper were acquired during a short-term loan of a TXRF instrument. Further work is required to confirm the suitability of this technology for measurements of trace metals. For instance, the effects of acute phase proteins are not adequately addressed by serum trace metal analysis and measurement of trace metals in whole blood samples is possible using TXRF, although there is the possibility of matrix effects causing a difference in results between whole blood and serum and this would be an interesting area for further study. The recovery experiment was designed to evaluate the recovery of Cu and Zn in the clinically relevant reference ranges, but it would be beneficial to evaluate recovery over the complete working range for the assay. To determine recovery of Se in samples with low concentrations of the elements would be difficult without a suitable low concentration sample for spiking. There are geographical reasons for the incidence of trace metal deficiency and this is less commonly encountered in the Plymouth area.
There was a small positive bias for Cu and Zn results obtained by TXRF relative to those obtained by AAS and ICP-MS. The calibration on the instrument could be adjusted to correct for this positive bias. The results obtained for Cu and Zn for EQA samples using TXRF were not significantly different to those reported for the ALTM (n = 19). There was an 80% negative bias for Se results obtained by TXRF relative to the ALTM for EQA samples (n = 40, with ICP-MS the most widely used method and a small minority of laboratories using AAS). The systematic underestimation of Se by TXRF is thought to be related to the loss of volatile Se species during the drying process, which accounts for about 20% of the serum Se. The majority of EQA samples are prepared by the addition of a solution of 0.5 M Se oxide (SeO2) in HNO3. Current investigations by Hoeflich et al. 3 indicate that the accurate analysis of Se in medical samples is possible with optimized instrument and sample preparation settings. There would be two ways to compensate for the loss of volatile Se compounds during preparation of samples for TXRF, either to create a customized calibration for serum Se or to redefine the reference interval for serum Se measured using the TXRF method. Further studies would be necessary to identify whether the loss of volatile Se species during the sample preparation stage compromises the ability of TXRF to determine Se deficiency for patients’ samples. It is likely that the samples currently distributed by the NEQAS EQA scheme for Se would be unsuitable for EQA of the Se assay by TXRF. Good performance for EQA samples is one of the criteria used to establish whether an analytical approach is fit for purpose.
The imprecision data obtained for measurement of serum Cu, Zn and Se suggest that TXRF would be an acceptable technique for use in the analytical clinical chemistry laboratory.
The working range for the TXRF assay is 1.2–35 μmol/L for serum Cu, 1.8–33 μmol/L for serum Zn and 0.2–1.1 μmol/L for serum Se. The linearity of the assay for measurement of serum Cu, Zn and Se is acceptable within the working range. Further work may be necessary to assess the suitability of the assay to investigate patients with Se toxicity. 4
Sample haemolysis has a significant effect on concentrations of serum Zn and Se and analysis of these elements in haemolysed serum samples should be avoided.
The increase in concentrations of serum Cu, Zn and Se on storage of samples at 4°C after the addition of gallium internal standard and PVA may be due to the evaporation of PVA, hence it is recommended that samples are analysed as soon as possible after addition of internal standard and PVA.
Cu and Se concentrations in serum are typically similar to those found in whole blood,5,6 and this is supported by the data in Figure 3 showing that progressive haemolysis has no effect on serum Cu concentrations although it is unclear why haemolysis causes negative interference in measurement of serum Se. In the presence of an acute phase response (as defined by a serum CRP >300 mg/L) results have shown that the Cu concentration in serum may be 1.7–3.2 times higher than that measured in whole blood, as supported by data in Shenkin. 7 Zn concentrations 8 are higher in whole blood compared to serum; hence it is difficult to assess the effect of the acute phase response from the limited amount of data obtained by TXRF.
Measurement of Cu, Zn and Se on whole blood samples using TXRF requires minimal sample preparation and the ability to easily measure trace elements on both whole blood samples and serum might be one of the advantages of TXRF over AAS/ICP-MS. TXRF has the ability to analyse small sample volumes and urine and hair samples are also suitable for analysis. TXRF, like ICP-MS, has the ability to simultaneously measure many elements using a single internal standard. TXRF is a very simple piece of equipment to use for routine laboratory analysis; there is no consumable or clinical waste requiring disposal (other than the pipette tips used for sample preparation) as the glass carrier discs can be washed and reused and the reagent running costs are low. Being a benchtop analyser there are no modifications necessary to a standard laboratory area to accommodate the analyser with regard to the need for a supply of gasses, coolants, extraction fans or exhausts. The X-ray source is isolated well within the machine so there is no need to monitor staff for X-ray exposure. The analyser can easily be relocated from one area of the laboratory to another, transferred to another hospital or even used at the Point-of-Care. The disadvantages of TXRF relative to AAS/ICP-MS are that even toxic concentrations of Hg/Cd/Cr are generally too low for direct measurement and the fluorescence peak from iron may cause interference in the measurement of Co 9 which may limit the utility of the method for assessment of side effects of metal-on-metal joint replacements, which would be of interest to many clinical biochemistry laboratories. The sample analysis time (1000 s) may be slightly longer than AAS, but this is compensated for by the shorter sample preparation time. TXRF is currently not an automated laboratory technique and the batch size is limited as the sample carrier can currently only accommodate 25 samples at any one time.
In conclusion, measurement of Cu and Zn in serum samples using TXRF would be a viable alternative to AAS or ICP-MS and further work is required to investigate the suitability of this technology for the measurement of other elements.
Supplemental Material
Supplemental material for Method for measurement of serum copper, zinc and selenium using total reflection X-ray fluorescence spectroscopy on the PICOFOX analyser: Validation and comparison with atomic absorption spectroscopy and inductively coupled plasma mass spectrometry
Supplemental material for Method for measurement of serum copper, zinc and selenium using total reflection X-ray fluorescence spectroscopy on the PICOFOX analyser: Validation and comparison with atomic absorption spectroscopy and inductively coupled plasma mass spectrometry by Jinny Jeffery, Amy R Frank, Stephanie Hockridge, Hagen Stosnach and Seán J Costelloe in Annals of Clinical Biochemistry
Footnotes
Acknowledgements
To laboratory staff working in the Special Investigations Section of Derriford Combined Laboratory for the analysis of serum Cu and Zn using atomic absorption spectrophotometry. To staff in the laboratories at Southampton and Cardiff for measurement of serum Cu, Zn and Se using ICP-MS with particular thanks to Christine Sieniawska and Paul Bramhall for providing details of their methodology for measurement of trace metals by ICP-MS.
Declaration of conflicting interests
The authors declared the following potential conflicts of interest with respect to the research, authorship, and/or publication of this article: Dr Hagen Stosnach is employed by Bruker, the manufacturer of the instrument under evaluation.
Funding
The authors disclosed receipt of the following financial support for the research, authorship, and/or publication of this article: This work was carried out using a PICOFOX instrument which was provided to the laboratory for demonstration purposes by Tom Warwick, Director of Blue Scientific Ltd. Gallium and polyvinyl alcohol were provided by Bruker, the cost of other reagents was met by Derriford Combined Laboratory.
Ethical approval
Not required.
Guarantor
JJ.
Contributorship
JJ designed the project and wrote the manuscript; ARF, SH and JJ collected the data on the PICOFOX, HS demonstrated the use of the instrument and provided technical support; ARF, SH, HS and SJC have all reviewed the manuscript prior to publication.
References
Supplementary Material
Please find the following supplemental material available below.
For Open Access articles published under a Creative Commons License, all supplemental material carries the same license as the article it is associated with.
For non-Open Access articles published, all supplemental material carries a non-exclusive license, and permission requests for re-use of supplemental material or any part of supplemental material shall be sent directly to the copyright owner as specified in the copyright notice associated with the article.