
Abstract
Background:
The serum-angiotensin I converting enzyme (s-ACE) activity is influenced by a genetic insertion/deletion (I/D) polymorphism in the ACE gene, and the resulting large interindividual variation in s-ACE limits the use of normal reference intervals in the evaluation of sarcoidosis. In this study, we developed a new method for genotyping the I/D polymorphism in ACE and established genotype-specific reference intervals in order to improve the diagnostic accuracy and the value for treatment of sarcoidosis.
Methods:
The new genotyping assay is based on high-resolution melting (HRM) using LCGreen + and was used to genotype 400 healthy Danish individuals. The assay was compared to a real-time polymerase chain reaction (RT-PCR) assay in a validation set of 86 samples. Enzyme activity in serum was measured using the Infinity™ ACE Liquid Stable Reagent from Thermo adapted for the ABX Pentra analyzer.
Results:
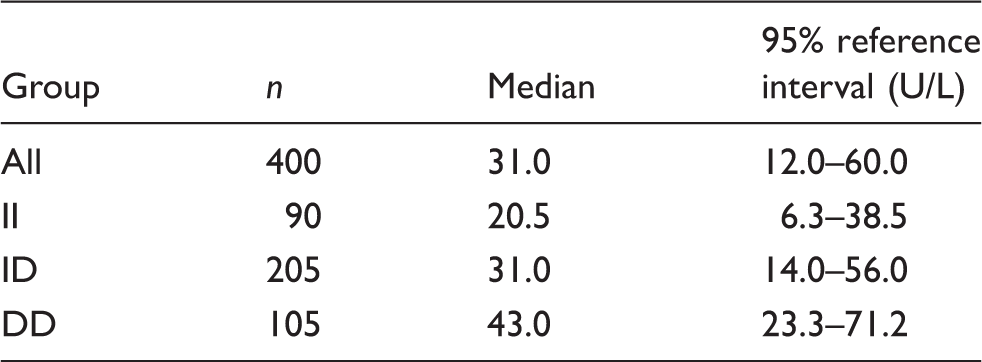
There was full concordance between genotyping assays. The three genotypes II, ID and DD were present with a frequency of 0.23, 0.51 and 0.26. The distribution of s-ACE values in the total population was non-Gaussian (non-parametric 95% reference interval 12.0–60.0 U/L). The median activities of the genotypes differed significantly (P<0.0001). Ninety-five per cent non-parametric reference intervals for the subpopulations were determined to 6.3–38.5, 14.0–56.0 and 23.3–71.2 U/L for II, ID and DD, respectively.
Conclusion:
We have developed a simple and robust method for ACE genotyping and determined genotype-specific reference intervals for s-ACE concentrations in the Danish population. The new reference intervals may increase the value of s-ACE measurements.
Keywords
Introduction
Serum-angiotensin I converting enzyme (s-ACE, peptidyl-dipeptidase A, EC 3.4.15.1), plays an important role in the regulation of blood pressure by converting the inactive angiotensin I to the active angiotensin II, a potent vasoconstrictor and crucial molecule of the renin-angiotensin system. Furthermore, ACE metabolizes other molecules including the strong vasodilator bradykinin. Genetic variation in the ACE gene has been associated with numerous different outcomes, e.g. blood pressure and heart disease. 1
The s-ACE activity has been shown to be under genetic influence. The trait is associated with an indel (insertion/deletion) variant involving the presence (I, insertion) or the absence (D, deletion) of a 287 base pair (bp) ALU sequence in intron 16 of the ACE gene. 2 Individuals homozygous for the D allele (DD) had approximately twice the s-ACE activity as compared to individuals homozygous for the I allele (II). The polymorphism was shown to explain 47% of the variance in s-ACE activity. 2 Others have suggested that the variation is due to a polymorphism other than the I/D, but that the I/D polymorphism is in linkage disequilibrium, and serves as a marker for s-ACE activity. 3
In sarcoidosis, an immune–mediated multiorgan disease with frequent pulmonary involvement, s-ACE activity is often elevated. 4 When using standard reference values, approximately 60% of cases have elevated s-ACE activity, and in these cases, it normalizes in response to therapy. 5 Hence, low s-ACE activity corresponds to disease remission, while high concentrations of s-ACE are associated with disease progression. This makes ACE activity measurement a useful marker for detecting clinically active pulmonary sarcoidosis, and more importantly, to monitor therapy in diagnosed patients. Due to the large interindividual variation in the s-ACE activity, that is predominantly associated with the I/D polymorphism, a diagnostic approach combining measurement of s-ACE activity and ACE I/D genotype has been shown to significantly improve the diagnostic accuracy of sarcoidosis. 6 On the basis of this idea, genotype-specific reference intervals have been established for a few populations.6,7
Several methods have been suggested to establish the genotype of the ACE I/D polymorphism. However, traditional polymerase chain reaction (PCR) methods were shown to be prone to mistyping ID heterozygotes as DD homozygotes. 8 Several groups have suggested alternative methods to avoid the issue of mistyping, e.g. inclusion of dimethyl sulfoxide (DMSO) and a second round of PCR on DD homozygous samples,9,10 stepdown PCR, 11 real-time (RT)-PCR using SYBR green and dissociation curves, 12 probe-based methods such as TaqMan 7 and fluorescent hybridization probes 13 and indirect methods using nearby single nucleotide polymorphism's (SNPs) in linkage disequilibrium with the I/D variant. 14
Here, we describe a high-resolution melting (HRM) method for the detection of the I/D polymorphism of the ACE gene and we established genotype-specific reference intervals for s-ACE, based on 400 Danish healthy controls.
Materials and methods
Samples
Serum and ethylenediaminetetraacetic acid (EDTA)-blood samples were obtained from 400 blood donors from the local blood bank. The validation set consisted of 86 archived DNA samples, previously collected from healthy blood donors.
According to the Danish law on ethics, the present study did not require approval from the Central Denmark Region Committees on Health Research Ethics.
Biochemistry
The ACE activity was measured in the serum samples using the Infinity™ ACE Liquid Stable Reagent enzymatic kit (thermo scientific) on a Pentra 400 chemistry analyzer (Horiba Medical, Montpellier, France), using calibrator and control samples from the kit supplier. The inter-assay precision (coefficient of variation, CV) was 4.4% and 5.2%, respectively, at 31.6 and 102 U/L. In addition, we have participated in the ACE quality assessment scheme organized by INSTAND e.V. (www.instand-ev.de) and have met the performance targets set by the organizers.
Molecular methods
Isolation of DNA
Genomic DNA was isolated from EDTA-stabilized blood samples, using the Maxwell 16 instrument and the Maxwell® 16 Blood DNA purification kit (Promega Biotech AB, Sweden) (reference interval samples) or the Puregene Genomic DNA purification kit (Qiagen, Copenhagen, Denmark) (validation set).
Real-time PCR
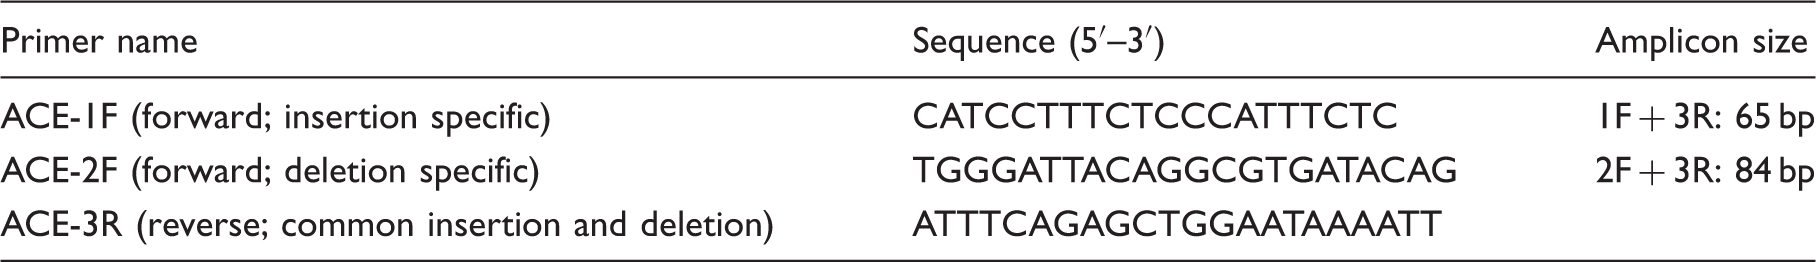
Primer sequences for the realtime and HRM assay.
High-resolution melting
We next developed an HRM assay, using the same primers and primer concentrations as above. PCR was carried out in a total volume of 11 µL, with application of 20 µL of mineral oil overlay, in BioRad C1000 or S1000 thermal cyclers, using the LightScanner Master Mix (BioFire Diagnostics, Salt Lake City, USA) with LCGreen + . Due to the annealing temperature increasing properties of LCGreen + , the annealing temperature was optimized. Following this, PCR was performed with initial denaturation at 95℃ for 2 min followed by 30 cycles of denaturation at 95℃ for 30 s, annealing at 64℃ for 20 s and extension at 72℃ for 30 s. Thermocycling was finalized by denaturation at 95℃ for 2 min and heteroduplex formation at 55℃.
PCR products were analysed in a LightScanner HR96 instrument (BioFire), and melting data collected in the temperature range of 60–95℃. Data were analysed using LightScanner 2.0 software with Call-IT (BioFire), using the small amplicon function for genotyping.
Statistics
Since genotyping errors are a frequent cause of Hardy–Weinberg equilibrium deviation, 15 we used the Chi square test to estimate if the two genotyping data sets were in Hardy–Weinberg equilibrium. The distributions of the ACE activity values were tested for normality using D’Agostino–Pearson test and Shapiro–Wilk test using GraphPad Prism® version 4.0. Both tests support that the distributions of II and DD individuals were normally distributed, whereas the ID individuals and the total group of donors were not (P < 0.05). For consistency, both reference interval for the total group of donors and reference intervals for each genotype were calculated as non-Gaussian non-parametric 95% reference intervals; using Analyze-IT for Excel, ACE activity by genotype was expressed as median. Differences by genotype group were calculated by Kruskal–Wallis test and Dunn's Multiple Comparison test using GraphPad Prism® version 4.0.
Results
Molecular methods
We first validated the HRM assay and compared it to the RT assay described by Lin et al.
12
with slight modifications, as we used different RT-PCR reagents and thermocycler. We used a validation set of 86 DNA samples (Figure 1 shows results of 11 samples). Genotyping using the RT assay failed in 23 samples. The HRM assay was more robust and resulted in 84 genotypes. Full genotype concordance was observed in 63 validation samples with complete genotype data for both methods.
Real-time PCR genotyping of the I/D polymorphism in the ACE gene. Real-time PCR using SYBR Green. The data represent dissociation curve data of 11 samples.
Next, we genotyped 400 blood donor samples, collected for this study, employing the HRM genotyping assay. Genotyping by the HRM assay was successful in all samples. Results from a series of samples are illustrated in Figure 2.
High-resolution melting genotyping of the I/D polymorphism in the ACE gene. Data represent 89 samples. The upper panel displays the melting profile of the samples, while the lower panel shows the change in melting profile. Samples homozygous for the insertion allele (II, red lines) melts at approximately 80,5℃, samples homozygous for the deletion allele (DD, blue lines) melts at approximately 82℃, while heterozygous samples (grey lines) melts at a temperature interval spanning 80,5–82℃.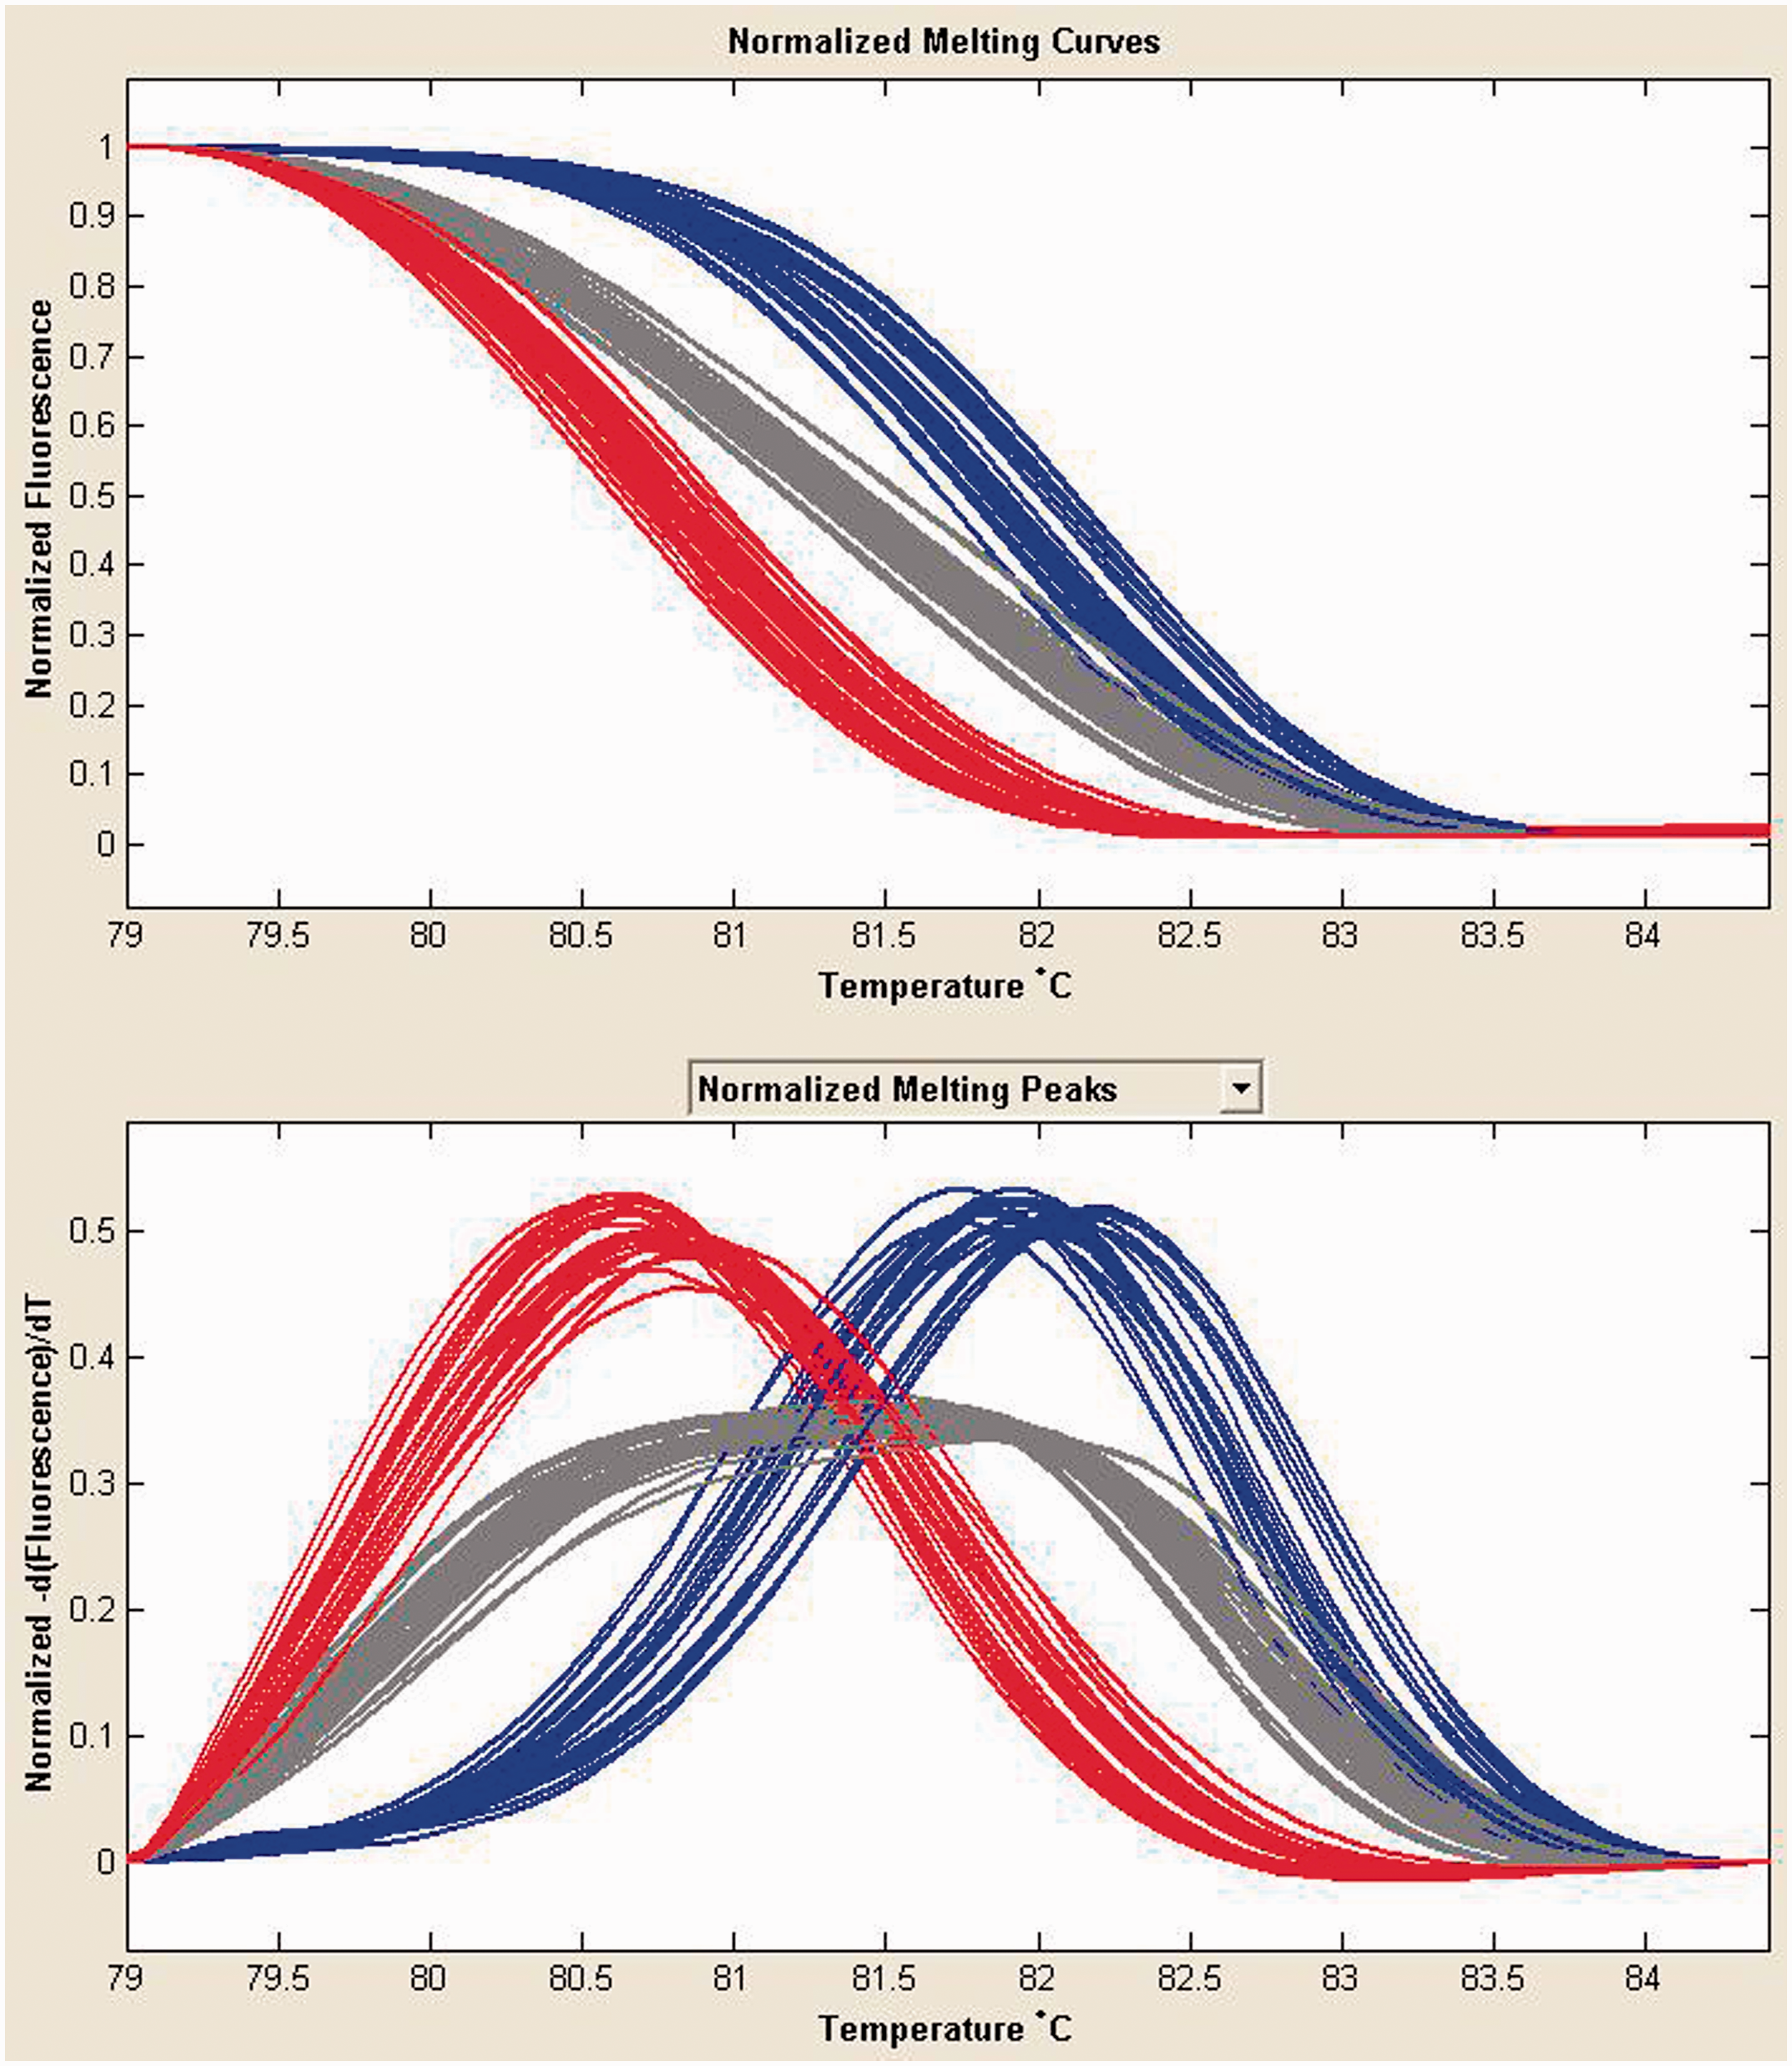
The three genotypes II, ID and DD were present with a frequency of 0.23 (n = 90), 0.51 (n = 205) and 0.26 (n = 105), respectively, corresponding to an allele frequency of 0.48 and 0.52, respectively, for the I and D alleles. We did not detect deviation from Hardy–Weinberg equilibrium, indicating correct genotyping.
Reference intervals
The median levels in the three genotypes were significantly different (Kruskal–Wallis P < 0.0001, Dunn's Multiple Comparison test, P < 0.001 for all comparisons). As expected, the DD group had the highest ACE activity (median 43.0 U/L) and the II group the lowest (median 20.5 U/L), with the heterozygous ID group showing an intermediate (median 31.0 U/L) activity. The distribution of the s-ACE activity in the different groups is illustrated in Figure 3. Reference intervals for the entire sample and the genotype subgroups are summarized in Table 2.
Frequency of s-ACE activity according to ACE I/D genotype. (a) s-ACE activity for the total dataset ungrouped, (b–d) s-ACE activity for the three individual subgroups II, ID and DD, respectively, and (e) s-ACE activity overlaid for all three genotype subgroups. Non-parametric 95% reference intervals of s-ACE activity in 400 Danish blood donors and divided in genotype subgroups.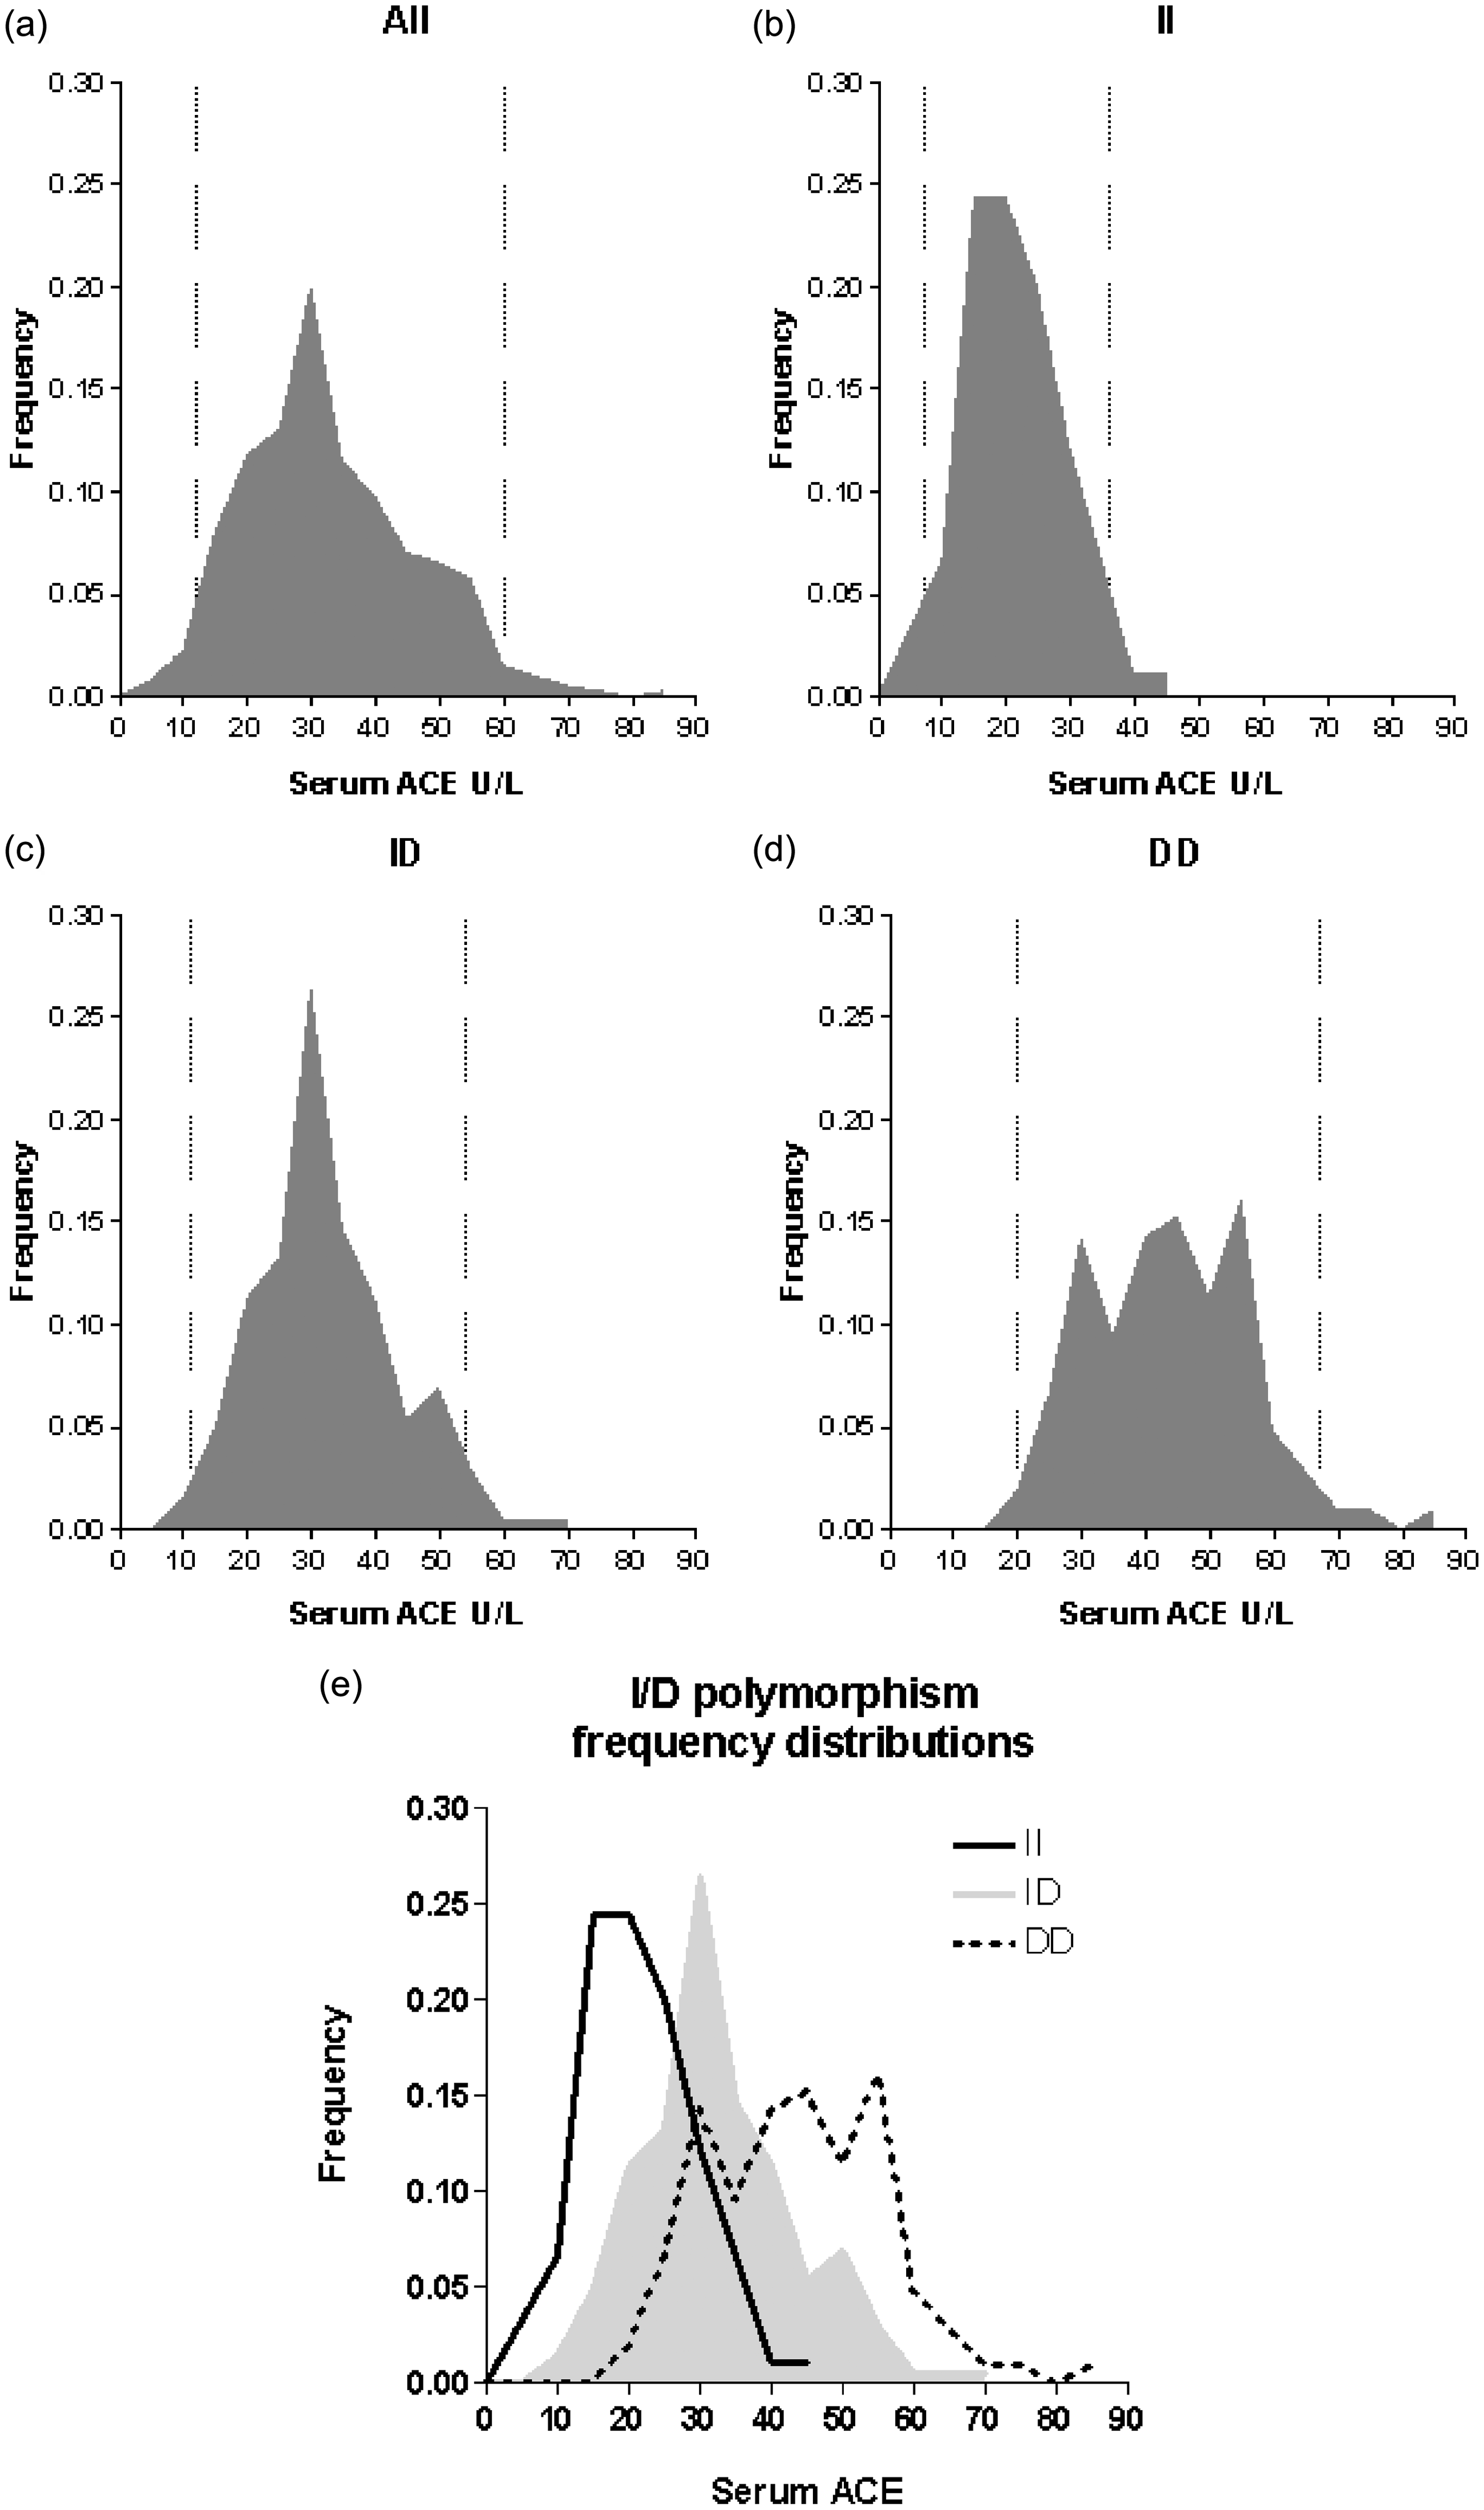
Discussion
In this study, we developed an HRM method for genotyping of the I/D polymorphism in the ACE gene and validated it against a previously published RT-PCR method. 12 The HRM method was more robust than the RT-PCR method, as assessed from the validation set. This difference might rely on the fact that the cycling profile of the RT-PCR method used 25 cycles, whereas the cycling profile of the HRM method used 30 cycles. The number of cycles was determined to be able to distinguish the dissociation curves and melting curves, of the three genotypes, unambiguously.
We applied the HRM method to a sample of 400 healthy Danish individuals to establish genotype-specific reference intervals for s-ACE activity. To our knowledge, this is the largest population sample used for genotype-specific reference intervals for the ACE I/D polymorphism and s-ACE activity. We found that the three genotypes, II, ID and DD were present with a frequency of 0.23, 0.51 and 0.26, respectively, which is in accordance with previously published frequencies in Caucasians.2,6,16,17
The median activities of s-ACE in the three genotype groups were significantly different (P < 0.0001), with the upper reference value of II and ID genotypes being only 54 and 79% of the DD upper value. This supports the introduction of genotype-specific reference intervals, and emphasizes that those individuals with the II genotype will especially benefit from the genotype-specific reference intervals, since the II group is clearly distinguished from the other groups. Using reference intervals not grouped by I/D genotype leads to a substantially lower sensitivity of s-ACE in this group, as II individuals have a naturally occurring lower level of s-ACE. As the diagnosis and clinical evaluation of sarcoidosis is challenging, this leads to a risk of delayed or failed diagnosis, or misjudgement of activity in sarcoidosis.
Our results are comparable to German 16 and Spanish 7 populations. However, differences between s-ACE methods have been observed, 18 and even when applying traceable calibrators and external quality control programmes, it is necessary to verify the described intervals locally.
The originally reported genotyping method by Rigat et al. 19 was based on PCR amplification, using primers flanking the I/D sequence and gel eletrophoresis separating amplification products of approximately 490 and 190 bp. Later, Shanmugam et al. 8 showed that, in some heterozygous samples, the D allele was preferentially amplified, resulting in a DD result rather that ID. Following this finding, methods to overcome this problem were described. Common for a range of these methods was increased complexity, e.g. additives and/or more PCR runs per sample.9,10 Inspired by the RT-PCR method described by Lin et al., 12 we developed an HRM method, using the same primers as used in their study. The HRM method has several advantages to the traditional PCR and to RT-PCR: (1) it is a single tube assay, avoiding the need for post-PCR electrophoresis, (2) HRM data using saturating dyes are much more precise and robust than RT-PCR using non-saturating dyes such as SYBR green, 20 (3) The data format generated by the LightScanner software is easy to convert to a format applicable for the laboratory information management system (LIMS) in our setting.
In conclusion, we have developed a simple, robust and specific method for ACE genotyping and determined genotype-specific reference intervals for s-ACE activities in the Danish population. These new reference intervals may increase the clinical value of s-ACE measurements, especially for individuals homozygous for the II polymorphism.
Footnotes
Acknowledgements
None.
Declaration of conflicting of interests
None declared.
Funding
This research received no specific grant from any funding agency in the public, commercial, or not-for-profit sectors.
Ethical approval
According to the Danish law on ethics, the present study did not require approval from the Central Denmark Region Committees on Health Research Ethics.
Guarantor
PHN.
Contributorship
PHN, HJM, SAL, OH and HJH conceived the idea and planned the project. NBC and PHN carried out molecular studies and performed data analysis. CSH and HJM performed biochemistry studies and performed data analysis. AF and PHN researched the literature. PHN drafted the manuscript. All authors approved the final version of the manuscript.