
Abstract
Background
A problem when producing reference intervals for elderly individuals is that they often suffer from a number of diseases and they are most often on medication. If all such persons are excluded, there is a risk that the residual subgroup may not be representative of the population, we therefore wanted to compare the effects different exclusion criteria has on the reference intervals.
Methods
We measured parathyroid hormone (PTH), calcium, albumin and cystatin C in a cohort of 70-year-old males and females (n = 1003). Reference intervals for PTH for males and females were calculated for the entire population and after exclusion of persons with calcium >2.60 mmol/L, calcium >2.51 mmol/L, diabetes, reduced glomerular filtration rate (GFR), and cardiovascular diseases.
Results
The calculated PTH reference interval 16 (CI 14–17) to 94 (CI 87–101) ng/L. Exclusion of study subjects resulted in smaller reference sample groups, but the reference limits remained within the 90% confidence intervals of the original reference limits. The selections thus had a very limited effect on the calculated reference interval for PTH.
Conclusions
Exclusion of elderly individuals with high calcium concentrations, diabetes, reduced GFR or cardiovascular disease has little effect on the reference interval for PTH. It is better not to exclude these individuals, as it will provide a broader base for the reference interval.
Keywords
Introduction
Parathyroid hormone (PTH) and calcium are clinically important markers that are used for case-finding and diagnosis of hypercalcaemia and hyperparathyroidism.1–3 The tested patients are elderly and often in the range 60–80 years old. 4 The tests are used in large numbers and variations in the upper reference limit have a clear impact on the number of patients with test results outside the reference intervals. 5
Hyperparathyroidism (HPT) is often associated with non-specific clinical manifestations. Thus, there is a need to screen large numbers of subjects to find the patients, and this emphasises the importance of the reference intervals used for evaluation of the test results of the individual patient. Appropriate reference intervals are important to be able to interpret test results correctly. The reference intervals are often based on healthy individuals usually 20–50 years old. The reference interval is thus made for individuals who are younger than the average patient seeking health care. A problem when using an elderly population to establish reference intervals is that these elderly individuals often suffer from a number of diseases and they are often on some kind of medication. It is a difficult balance to decide which individuals to include and which to exclude prior to calculation of the reference interval. If we exclude large groups, we will be left with a small subpopulation of ‘healthy’ individuals that may or may not be representative for an elderly population. If we on the other hand include all individuals, we may include individuals with pathological values for a specific marker, which may reduce the discriminative power of that biomarker.
The aim of the present study was to calculate reference intervals for PTH and calcium in a population of 70-year-old males and females and to study the effect of variations in the study populations on the reference intervals.
Materials and methods
Setting and participants
Data were retrieved from the project Prospective Investigation of the Vasculature in Uppsala Seniors (PIVUS), 6 a population-based prospective cohort study that initially included 1016 (50% females) individuals aged 70 years living in the community of Uppsala, Sweden.
The ethics committee of the Faculty of Medicine, Uppsala University, approved the study and all participants gave their written informed consent prior to inclusion. The study was conducted according to the Declaration of Helsinki.
Clinical and biochemical investigation
All blood samples were collected in the morning after an overnight fast. No medication or smoking was allowed after midnight. The serum samples were collected in Vacutainer® tubes without additives (Becton Dickinson, Franklin Lakes, NJ, USA). The plasma samples were collected in K2-EDTA tubes (Becton Dickinson, Franklin Lakes, NJ, USA). The serum and plasma samples were spun in a refrigerated centrifuge, frozen in multiple tubes to avoid repeated freezing and thawing and stored at −80℃ until analysis. The serum samples were used for calcium, albumin and cystatin C measurements and the EDTA-plasma samples were used for PTH testing. The samples were analysed in batch mode and approximately 100 samples were analysed per day for each marker. Calcium and albumin was analysed in one subset of serum tubes and cystatin C in another subset of serum tubes. Total assay period for each marker was less than one month. The CV estimates represent the total CV for a one-month period. Routine methods at the Department of Clinical Chemistry and Pharmacology (Uppsala University Hospital) were used for analysing samples. The laboratory is accredited according to SS-EN-ISO/IEC 15189. As part of the accreditation procedures, the laboratory participates in interlaboratory external quality assessment schemes from EQUALIS AB (Uppsala, Sweden). Albumin was measured with spectrophotometry using bromcresol purple (reference interval 40–69 years 36–45 g/L; ≥70 years 34–45 g/L). 7 Calcium was measured spectrophotometrically with a compleximetric method using ortho-cresolphthalein dye binding (reference interval 2.20–2.51 mmol/L). 7 Albumin and calcium measurements were performed on an Architect Ci8200 (Abbott Laboratories, Abbott Park, IL, USA). Albumin-adjusted calcium was calculated as [calcium + 0.019 × (42−albumin)]. The total coefficient of variation (CV) for the methods were 0.3% at 32 g/L and 0.4% at 49 g/L for albumin and 0.9% at 2.2 mmol/L and 1.2% at 2.9 mmol/L for calcium. The measured calcium values without albumin-adjustment were used for exclusion of study subjects. Intact plasma PTH (reference interval 12–65 ng/L) was determined with an immunochemiluminometric assay (Nichols Institute, San Juan Capistrano, CA, USA). The total CV for the PTH method was 9.5% at 32 ng/L and 5.0% at 87 ng/L.
Serum cystatin C measurements on Architect® ci8200 were performed using cystatin C immunoparticles (#1014), assay buffer (#1007), calibrator (#1012) and control set (code 1019) from Gentian (Moss, Norway). Glomerular filtration rate (GFR) in mL/min/1.73 m2 was calculated from cystatin C results in mg/mL by the equation y = 79.901 × (Cystatin C result)−1.4389. 8
Statistical analysis
Diabetes was defined as a known diagnosis of diabetes or a fasting glucose value ≥7.0 mmol/L and cardiovascular disease was defined as myocardial infarction, stroke and heart failure. Calculations of reference intervals were performed by bootstrap estimation utilising RefVal 4.0 (Department of Clinical Chemistry, Rikshospitalet, N-0027 Oslo, Norway).9,10 The determination and evaluation of equality of the reference intervals were performed according to Clinical Laboratory Standards Institute guidelines EP28-A3C. 11 The method of Lahti et al. described in EP28-A3C was used to test if there were differences between the calculated reference intervals for PTH. 12
Results
Calcium and albumin-corrected calcium
The 2.5 and 97.5 percentiles for calcium were in the range of 2.18 (0.90 confidence interval (CI) 2.16–2.19) – 2.70 (CI 2.65–2.74) mmol/L, for albumin 35 (CI 35–36) – 47 (CI 46–47) g/L and for albumin-adjusted calcium 2.22 (CI 2.21–2.24) – 2.67 (CI 2.64–2.71) mmol/L. The calculated reference interval for PTH for individuals 70 years old was 16 (CI 14–17) – 94 (CI 87–101) ng/L. The number of subjects was the same for all the calculations above (n = 1003).
Reference intervals for both males and females
PTH reference intervals for the whole group after exclusion of specified subgroups.
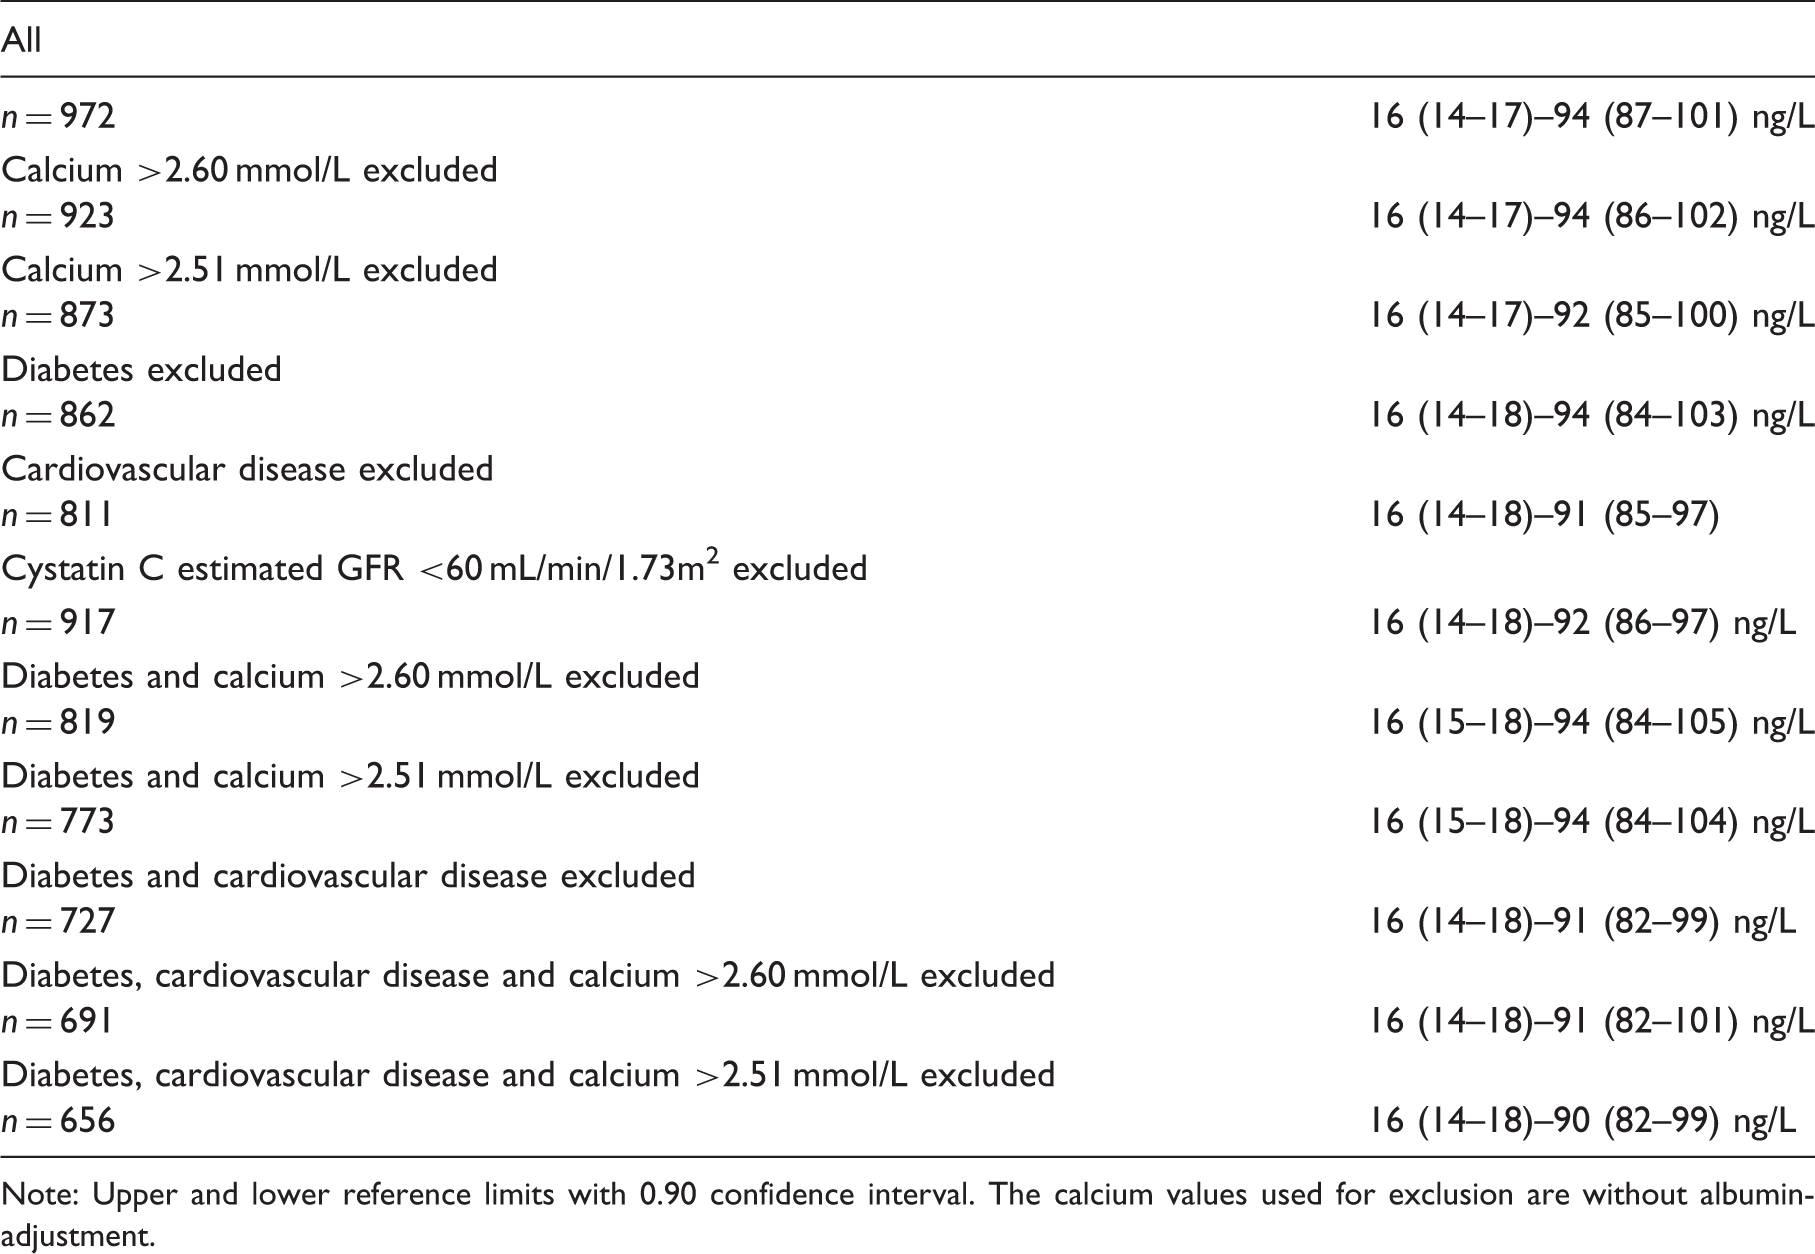
Note: Upper and lower reference limits with 0.90 confidence interval. The calcium values used for exclusion are without albumin-adjustment.
Reference intervals for females and males separately
PTH reference intervals for females after exclusion of specified subgroups.
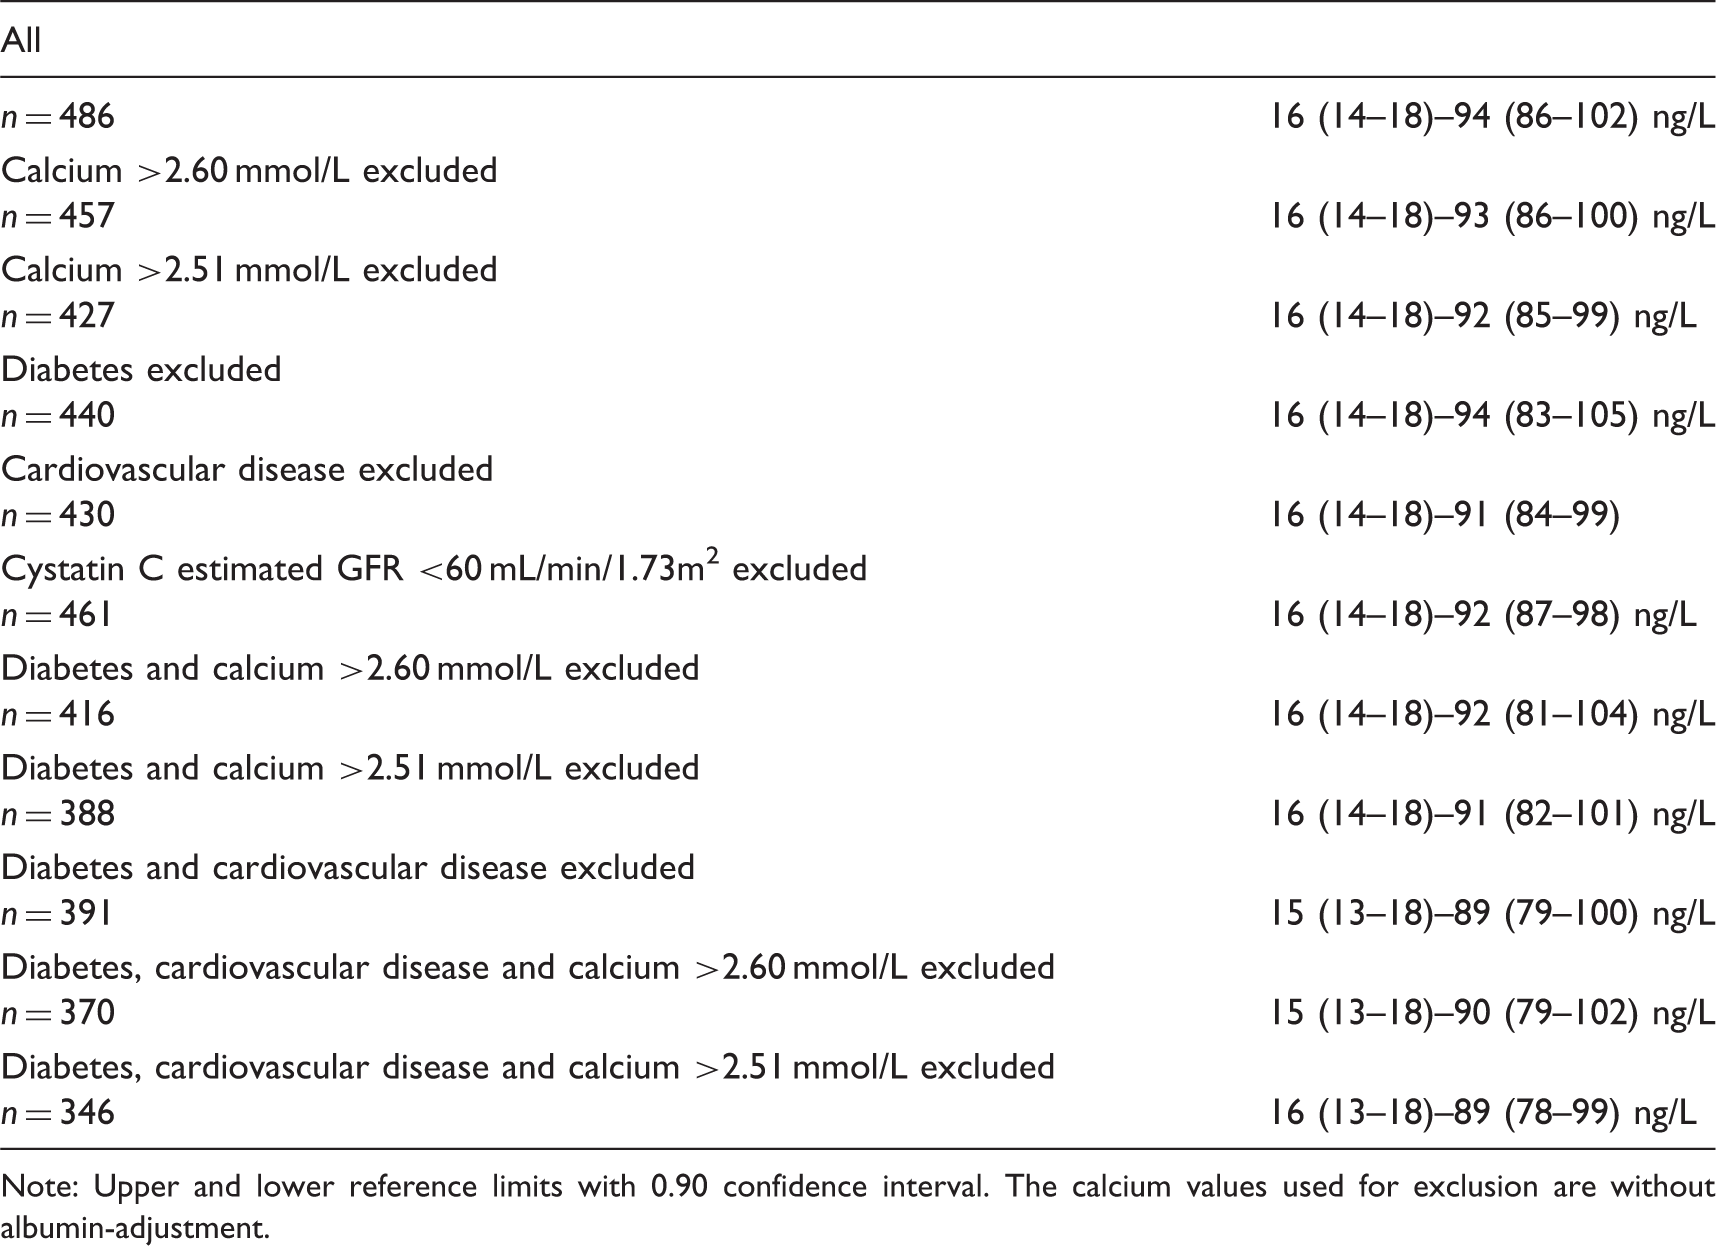
Note: Upper and lower reference limits with 0.90 confidence interval. The calcium values used for exclusion are without albumin-adjustment.
PTH reference intervals for males after exclusion of specified subgroups.
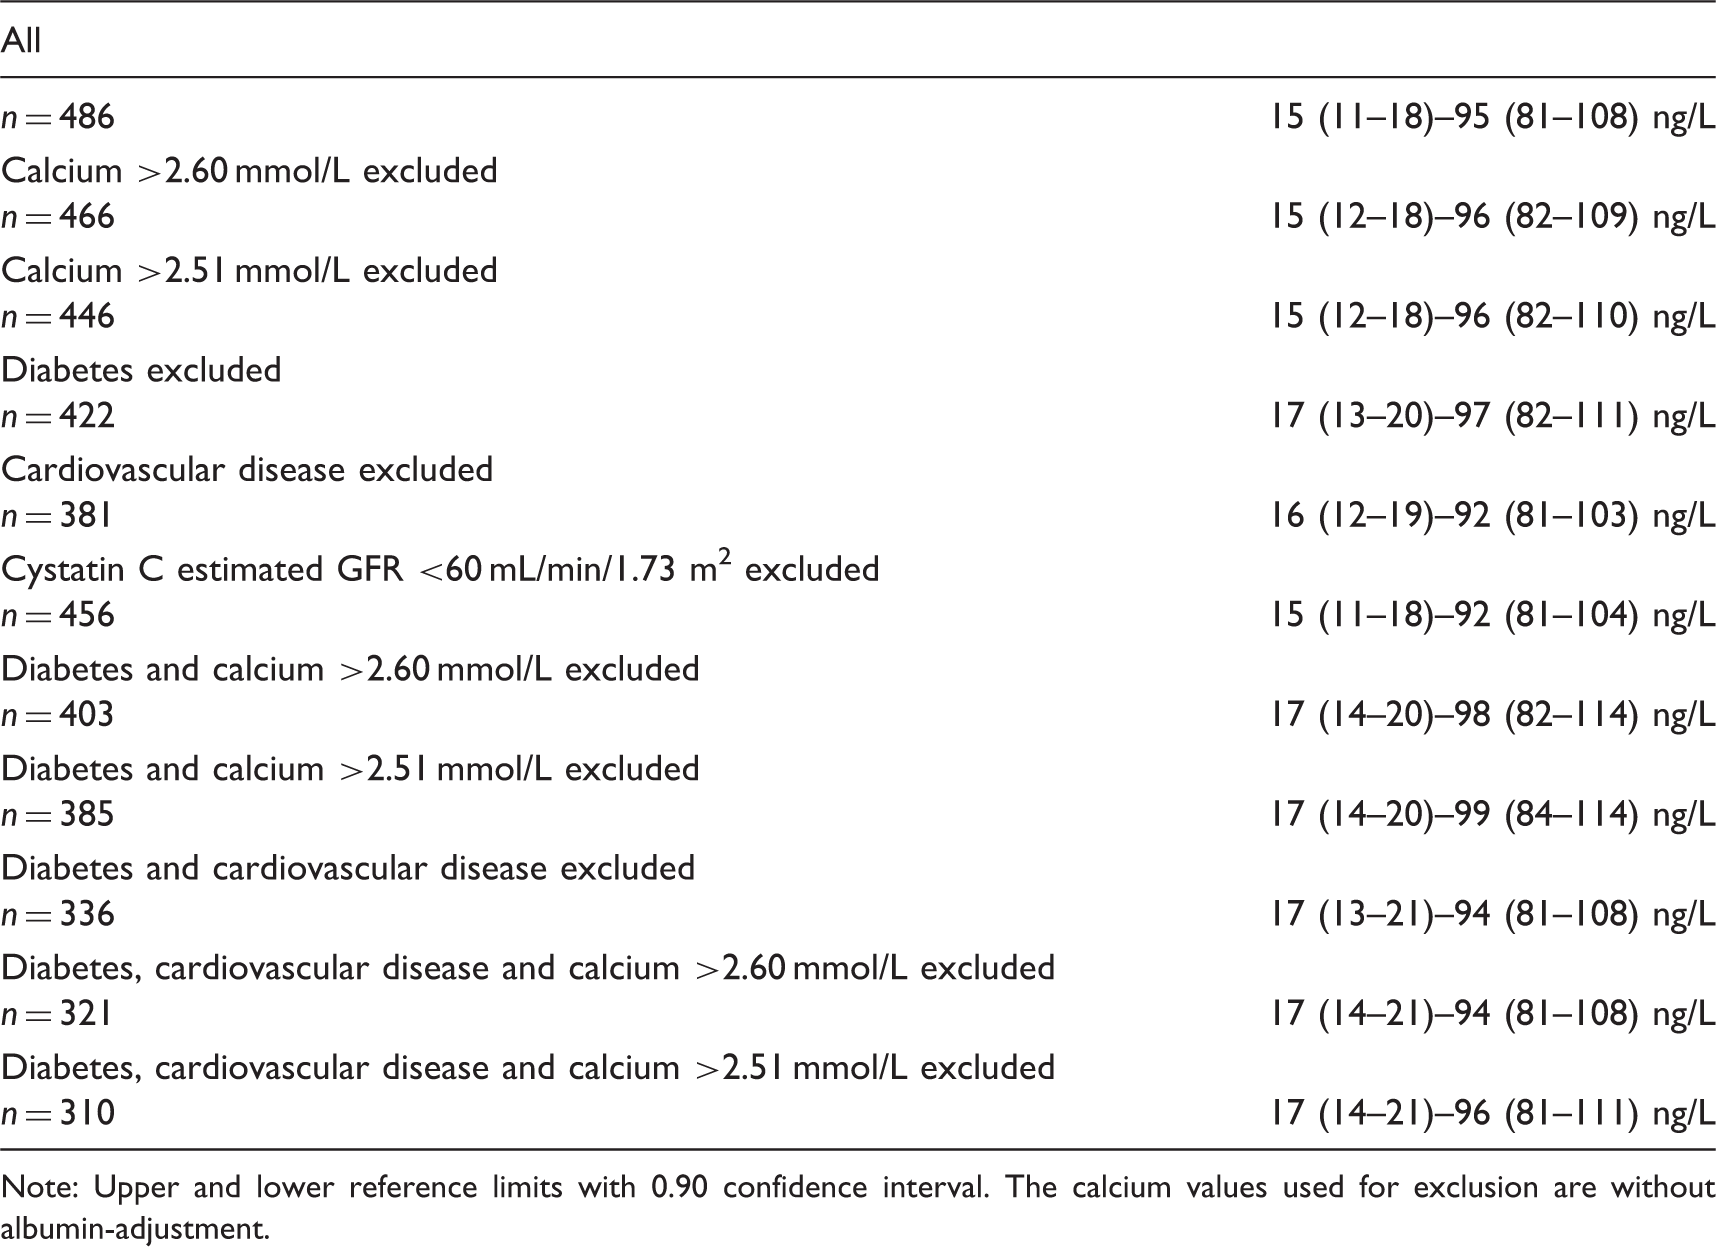
Note: Upper and lower reference limits with 0.90 confidence interval. The calcium values used for exclusion are without albumin-adjustment.
Discussion
It is usually recommended that individuals, with diseases that could influence the results of a specific analyte, should not be included in reference intervals. Thus, we should exclude patients with hypercalcaemia, diabetes, reduced GFR and cardiovascular diseases when creating reference intervals for PTH. This is a minor problem if we use 20–50-year-old individuals as the basis for the reference interval. In contrast, if we include elderly persons in the reference interval, we have to exclude many persons, and we risk ending up with a subpopulation that is not representative for the elderly individual seeking health care.
We have previously shown that exclusion of patients with cardiovascular diseases had little impact on reference intervals for several frequently used clinical chemistry tests. 13 We have now compared reference values for PTH with and without exclusion of individuals with different concentrations of hypercalcaemia, diabetes, GFR <60 mL/min/1.73 m2 and cardiovascular diseases. The exclusion of study subjects reduced the number of individuals in the reference population and increased the 90% confidence intervals, but had limited effects on the corresponding reference intervals. In our opinion, exclusion of study subjects should be kept to a minimum to ensure that the individuals in the reference interval are representative for the patients seeking health care.
Footnotes
Acknowledgements
We are grateful to Charina Brännström for skilled technical assistance.
Declaration of conflicting interests
None.
Funding
This study was financially supported by the Uppsala University Hospital Research Fund.
Ethical approval
The ethics committee of the Faculty of Medicine, Uppsala University approved the study. Ethical approval 01-367.
Guarantor
AL.
Contributorship
LL and HM were responsible for the study and the collection of samples. AL performed the analysis of the biomarkers. AL and PR wrote the first draft of the manuscript. All authors reviewed and edited the manuscript and approved the final version of the manuscript.