
Abstract
Background
Refeeding syndrome (RS) is a potentially fatal condition that can occur following the re-introduction of nutrition after a period of starvation. Hypophosphataemia following the reintroduction of nutrition is often the only reliable biochemical marker of RS. Refeeding index (RI) generated from baseline insulin-like growth factor-1 (IGF-1) and leptin has been proposed as a useful biochemical marker for the identification of patients at risk of developing refeeding hypophosphataemia (RH).
Methods
A prospective study included 52 patients referred for parenteral nutrition (PN). The sensitivity and specificity of IGF-1 measured using a sensitive assay was compared to the RI in predicting the development of RH (a ≥30% drop in PO4 during the first 36-h of PN administration). Leptin and IGF-1 were analysed on baseline samples using a quantitative enzyme-linked immunoassay. Daily blood samples were collected from all patients for routine biochemistry for the full duration of PN administration.
Results
High sensitivity IGF-1 measurement alone was comparable with the RI, using receiver–operating characteristic (ROC) curve analysis, with areas under the curve being 0.79 and 0.80, respectively, and superior to leptin alone (0.72) for predicting ≥30% drop in PO4. The cut-off value for IGF-1 that gave best sensitivity (91% [95% CI 75–98%]) and specificity (65% [95% CI 41–85%]) was 63.7 µg/L, with a likelihood ratio of 2.59.
Conclusion
Baseline IGF-1 is an objective, sensitive and specific biochemical marker in identifying patients who are at high risk of developing RH prior to PN administration and therefore may have a role in clinical practice.
Introduction
NICE clinical guideline 32 (2006) criteria for recognising patients at high risk of refeeding syndrome.
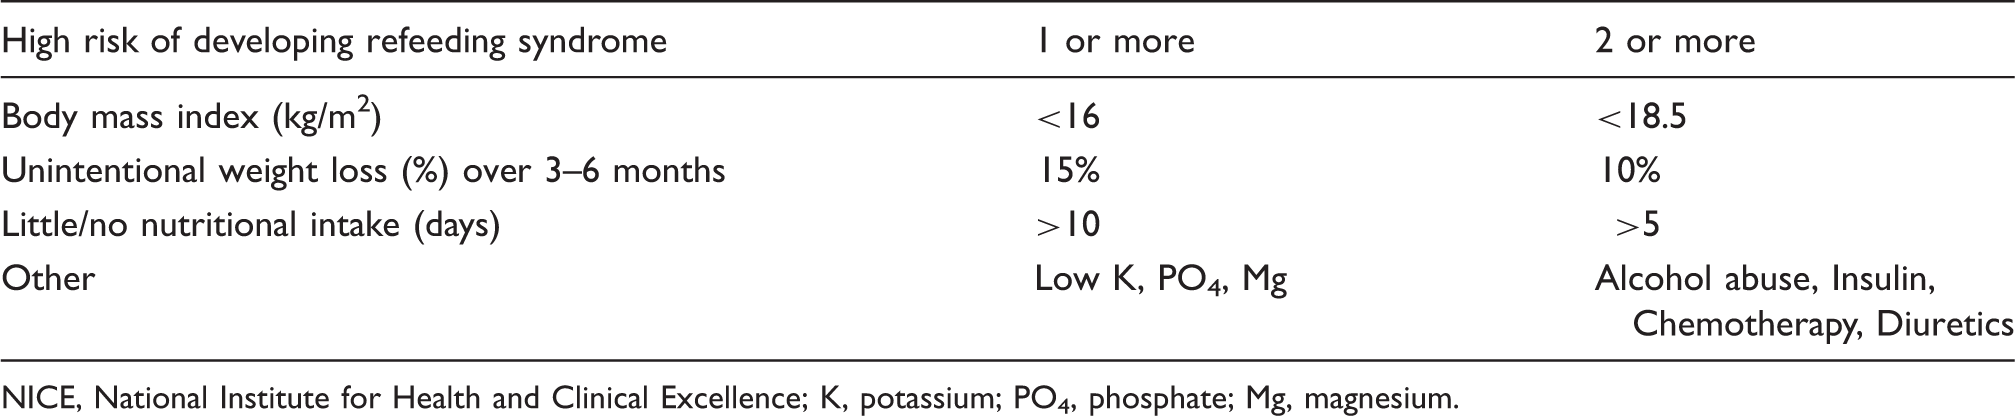
NICE, National Institute for Health and Clinical Excellence; K, potassium; PO4, phosphate; Mg, magnesium.
We have previously shown that using clinical criteria alone, not only underestimates the risk of RS, but also overestimates the risk, potentially leading to overtly cautious feeding. 6 Hypophosphataemia following re-introduction of nutrition after a period of starvation is a key objective feature of the RS 5 whereas clinical features and predictors are all subjective. At present there is no universally agreed parameter for PO4 concentration fall that defines RH. However, a previous study by Marik and Bedigian 7 showed that 20–24% fall in PO4 concentration as being indicative of RS. Also Zeki et al. defined RH as a fall in serum PO4 to <0.6 mmol/L, representing a fall of between 19% and 60% based on the initial result being within the normal reference range of 0.74–1.52 mmol/L. 8 The mean fall in serum PO4 concentrations of the above studies were 22% and 39%, respectively. With 30% being the average drop of PO4 in these two studies we used it as the cut-off for RH. Furthermore, our laboratory reference range for serum PO4 is 0.80–1.4 mmol/L. A concentration change from the mid-point of the reference range (1.1 mmol/L) to below the lower limit of normal represents a fall of around 30%.
Currently there are no well defined biochemical predictors of RH. Using IGF-1 and leptin together, we previously proposed a new predictive index described as the ‘refeeding index’ (RI). 6 We demonstrated that baseline IGF-1 and leptin concentrations were lower in patients who developed RH following initiation of parenteral nutrition (PN). 6 The RI was generated by the product of leptin and IGF-1 divided by 2800 to normalise the index to approximately 1.0.6,9 This index was therefore derived in a similar way to the homeostatic model assessment for insulin resistance (HOMA-IR), which is based on multiplying the glucose concentration by the insulin concentration and then dividing by a factor (product of mean glucose and insulin values), which normalises to 1.0. 10
In the previous study, the likelihood ratio was 3.4, at a RI cut-off value of 0.19 for predicting a ≥30% decrease in PO4 concentration within the first 12–36 h after starting PN. The initial findings were limited by the poor sensitivity of the IGF-1 assay used, which had a lower limit of detection of 25 µg/L. 6 Therefore, all IGF-1 results that were below the assay detection limit were assigned a value of 25 µg/L, thereby restricting the generation of lower RI index values.
Our previous work highlighted leptin and IGF-1 as new objective markers that predict RH by several days. 6 We proposed that they could represent new adjuncts to clinical criteria. Therefore, the aim was to further explore these objective markers that can assist often subjective clinical assessment of patients at risk of developing RH. We also aimed to further define the RI and possibly risk stratify patients into those with moderate and high risk of RH, by the use of a more sensitive IGF-1 assay in the current study compared to the previous study. Finally, we aimed to validate the RI as a sensitive marker for RH and to determine whether the RI versus IGF-1 and leptin alone can routinely help in the initial identification of patients at risk of developing RH when initiating PN.
Experimental materials and methods
The study was approved by the King’s College Hospital Foundation Trust Research Committee (London, UK) and conducted according to the Helsinki principles with informed consent obtained from all patients. The study was registered with ClinicalTrials.gov (NCT01227850).
All patients recruited were referred to the multidisciplinary PN team for assessment when enteral feeding was contraindicated as per local nutrition guidelines. A total of 69 patients were screened for the study. Exclusion criteria were: patients already on PN, nasogastric feeding or oral nutrition at the time of referral or if the patient received PO4 supplements (parenteral, oral or rectal – in order to minimise the variability in PO4 drop) three days either side of commencing PN. We also excluded any patients with renal failure or those that needed renal dialysis or haemofiltration during their admission. A total of 52 patients were included for final analysis.
Routine blood samples were taken between 06.00 and 09.00 h in the morning before initiation of PN. Patients were assessed for nutritional status to determine whether or not they were malnourished, as per NICE 2006 guidelines, 2 whilst nutritional intake and the number of days a patient was nil by mouth (NBM) were recorded. The Schofield equation 11 was used to estimate basal metabolic requirement and adjusted for activity and stress to give the approximate energy requirements. 12 On initiation of PN all patients were given no more than 20–25 kcal/kg/day. A range of Kabiven® (Fresenius Kabi Limited, Runcorn, Cheshire, UK) PN bags or part bags were selected based on each patient’s energy requirements with the addition of electrolytes, vitamins and minerals as required either in the PN bag or as separate infusions. Patients who were identified to be at ‘high risk’ of developing RS based on the NICE 2006 guidelines criteria 2 were given 50% of their daily energy requirements for the first 48 h with gradual increase to meet requirements by day four. The PO4 and glucose content of the initial PN solutions administered was similar for all of the patients in the study (30 mmol of PO4 with either 200 or 250 g of glucose).
Daily blood samples were collected from all patients prior to PN administration (baseline) and whilst on PN. Electrolytes including PO4, K and Mg, liver and renal function tests were measured using the Advia 2400 (Siemens Healthcare Diagnostics, Camberley, Surrey, UK) on all samples. An aliquot of the baseline sample was stored at −80℃ until analysis of leptin and IGF‐1. Patients were followed up for a period of two months to determine mortality.
Leptin and IGF-1 assays
IGF-1 and leptin were analysed using the quantitative enzyme linked immunoassays (Quantikine® ELISA, R&D Systems Europe, Abingdon, UK). The intra-assay coefficient of variation (CV%) for IGF-1 were 3.5, 4.3 and 4.3% at 0.5, 1.2 and 2.4 µg/L, respectively. The inter-assay CV% were 8.1, 8.3 and 7.5% at 0.4, 1.0 and 2.0 µg/L, respectively. The IGF-1 kit was calibrated to the international standard 02/254 and the lower limit of detection was 2.6 µg/L. The intra-assay CV% for leptin were 3.3, 3.0 and 3.2% at 0.06, 0.15 and 0.62 µg/L, respectively. The inter-assay CV% were 5.4, 4.2 and 3.5% at 0.06, 0.15 and 0.58 µg/L, respectively. The lower limit of detection was 0.78 µg/L. The RI index was calculated by deriving the mean of the reference ranges of each analyte. This value was 13 µg/L for leptin (reference range for males: 2.21–11.1 µg/L and females: 3.88–77.3 µg/L) and 149 µg/L for IGF-1 (reference range 40–258 µg/L). The product of these two numbers is 1900 (rounded to two significant figures), which formed the basis for the denominator to derive a ‘RI’, defined as the product of leptin and IGF-1 divided by 1900, similar to the RI described previously. 6
Statistics
Power calculation
Nineteen patients in each group are required if 12–36 h after PN administration the mean PO4 in the normal group is 1.00 mmol/L and in the RS group 0.7 mmol/L with standard deviations of 0.30 and 0.28 mmol/L, respectively. At a significance level of 0.05 this would give a power of 90%.
Statistical analysis was performed using Analyse-It® version 2.21 (Leeds, UK). Data were tested for normality using the Shapiro-Wilk W test. Data were not normally distributed and are reported as median and inter-quartile ranges (IQRs). Receiver–operating characteristic (ROC) curves was generated for RI, IGF-1 and leptin against ≥30% PO4 change. Associations between RI, IGF-1 and leptin and change in PO4 concentrations with mortality were also assessed. Mann–Whitney U test was used to determine difference between groups and Spearman rank test was used for correlations, with P < 0.05 taken as statistically significant.
Results
Summary of the patients included in the study (n = 52).
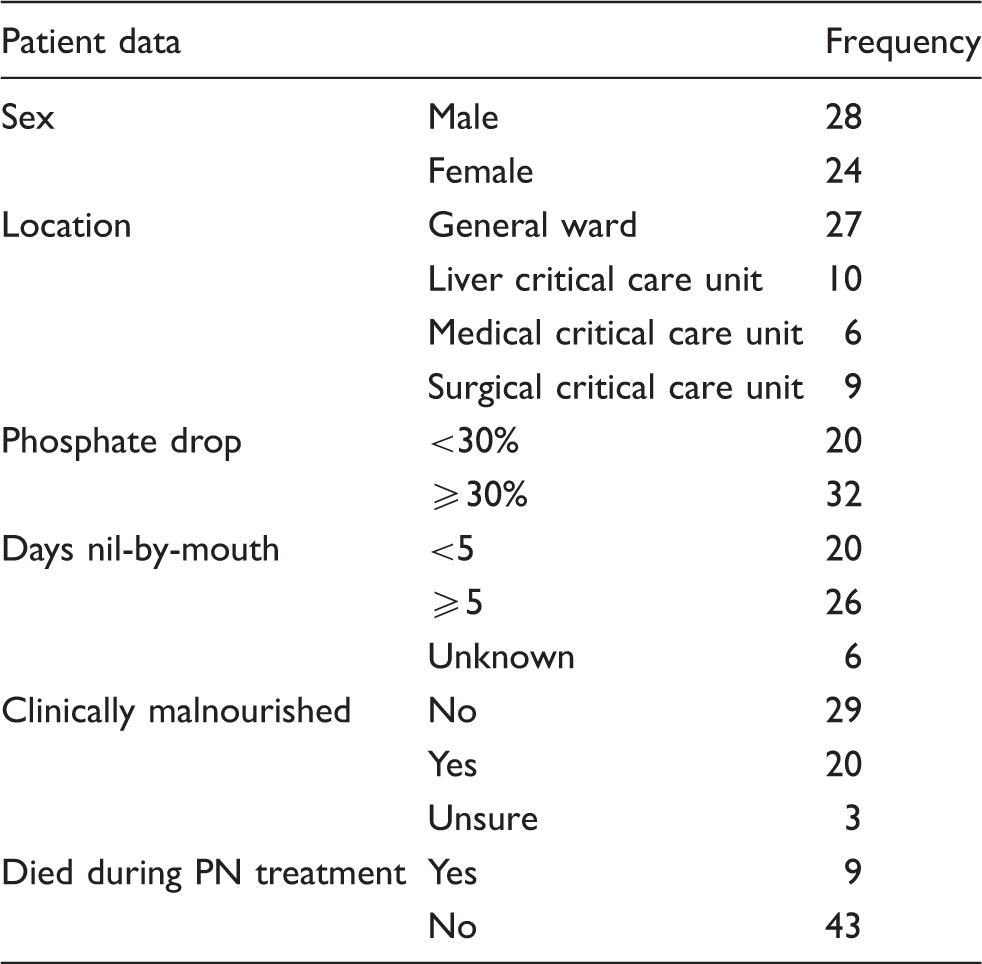
Using the NICE 2006 criteria, 14 patients were classified as being at ‘high risk’ of RS. In total, 26 patients were NBM for five days or more. In six patients there was an unclear account of energy intake in the days and weeks preceding referral for PN. A total of 20 patients were deemed as malnourished on review of medical history and clinical examination. Three other patients could not be categorised due to insufficient medical history, incomplete oral nutrition records and inconclusive examination.
Nine patients died within 60 days of initiating PN administration (seven patients died within 1–23 days of initiation of PN, whilst two died five weeks after initiation of PN). All nine patients were from the critical care units (five from liver, three from medical and one from the surgical critical care units).
Of the 52 patients, 32 (62%) demonstrated a reduction in PO4 of ≥30% from baseline within the first 36 h of PN administration. Of these 32 patients, 11 were classified prior to starting PN as ‘high risk’ of developing RS using the NICE 2006 criteria. Three other patients highlighted as ‘high risk’ of developing RS did not demonstrate a ≥30% fall in PO4. Of the 20 patients who were deemed at risk of being malnourished (as per NICE, 2006), 14 developed PO4 drop of ≥30%. A reduction of phosphate of ≥30% was demonstrated in 21 patients not deemed at ‘high risk’ according to NICE 2006 criteria (Table 1).
Further defining the RI index
In the previous study, a RI cut-off value of 0.190 was proposed based on ROC analysis, giving 97% sensitivity and 50% specificity, with a likelihood ratio of 1.7. Using ROC analysis for RI from the current study the cut-off that gave optimal sensitivity and specificity for significant decrease in PO4 was 0.125, with a likelihood ratio of 2.9. At this cut-off, sensitivity and specificity were 88% and 70% respectively.
IGF-1
In the current study, we found IGF-1 to be superior to leptin (using ROC curve) in predicting a ≥30% drop in PO4 with better sensitivity and specificity (Figure 1). We also found that IGF-1 was comparable with the RI using ROC analysis, with the areas under the curve being 0.79 and 0.80, respectively.
Receiver–operator curves showing the area under the curve (AUC) for the 52 patients. The outcome of the phosphate drop of ≥30% within 36 h of starting parenteral nutrition is tested against the three markers which gave the following AUC values: insulin-like growth factor-1 (open circles) 0.79, leptin (open squares) 0.72 and the ‘refeeding index’ 0.80 (open triangles).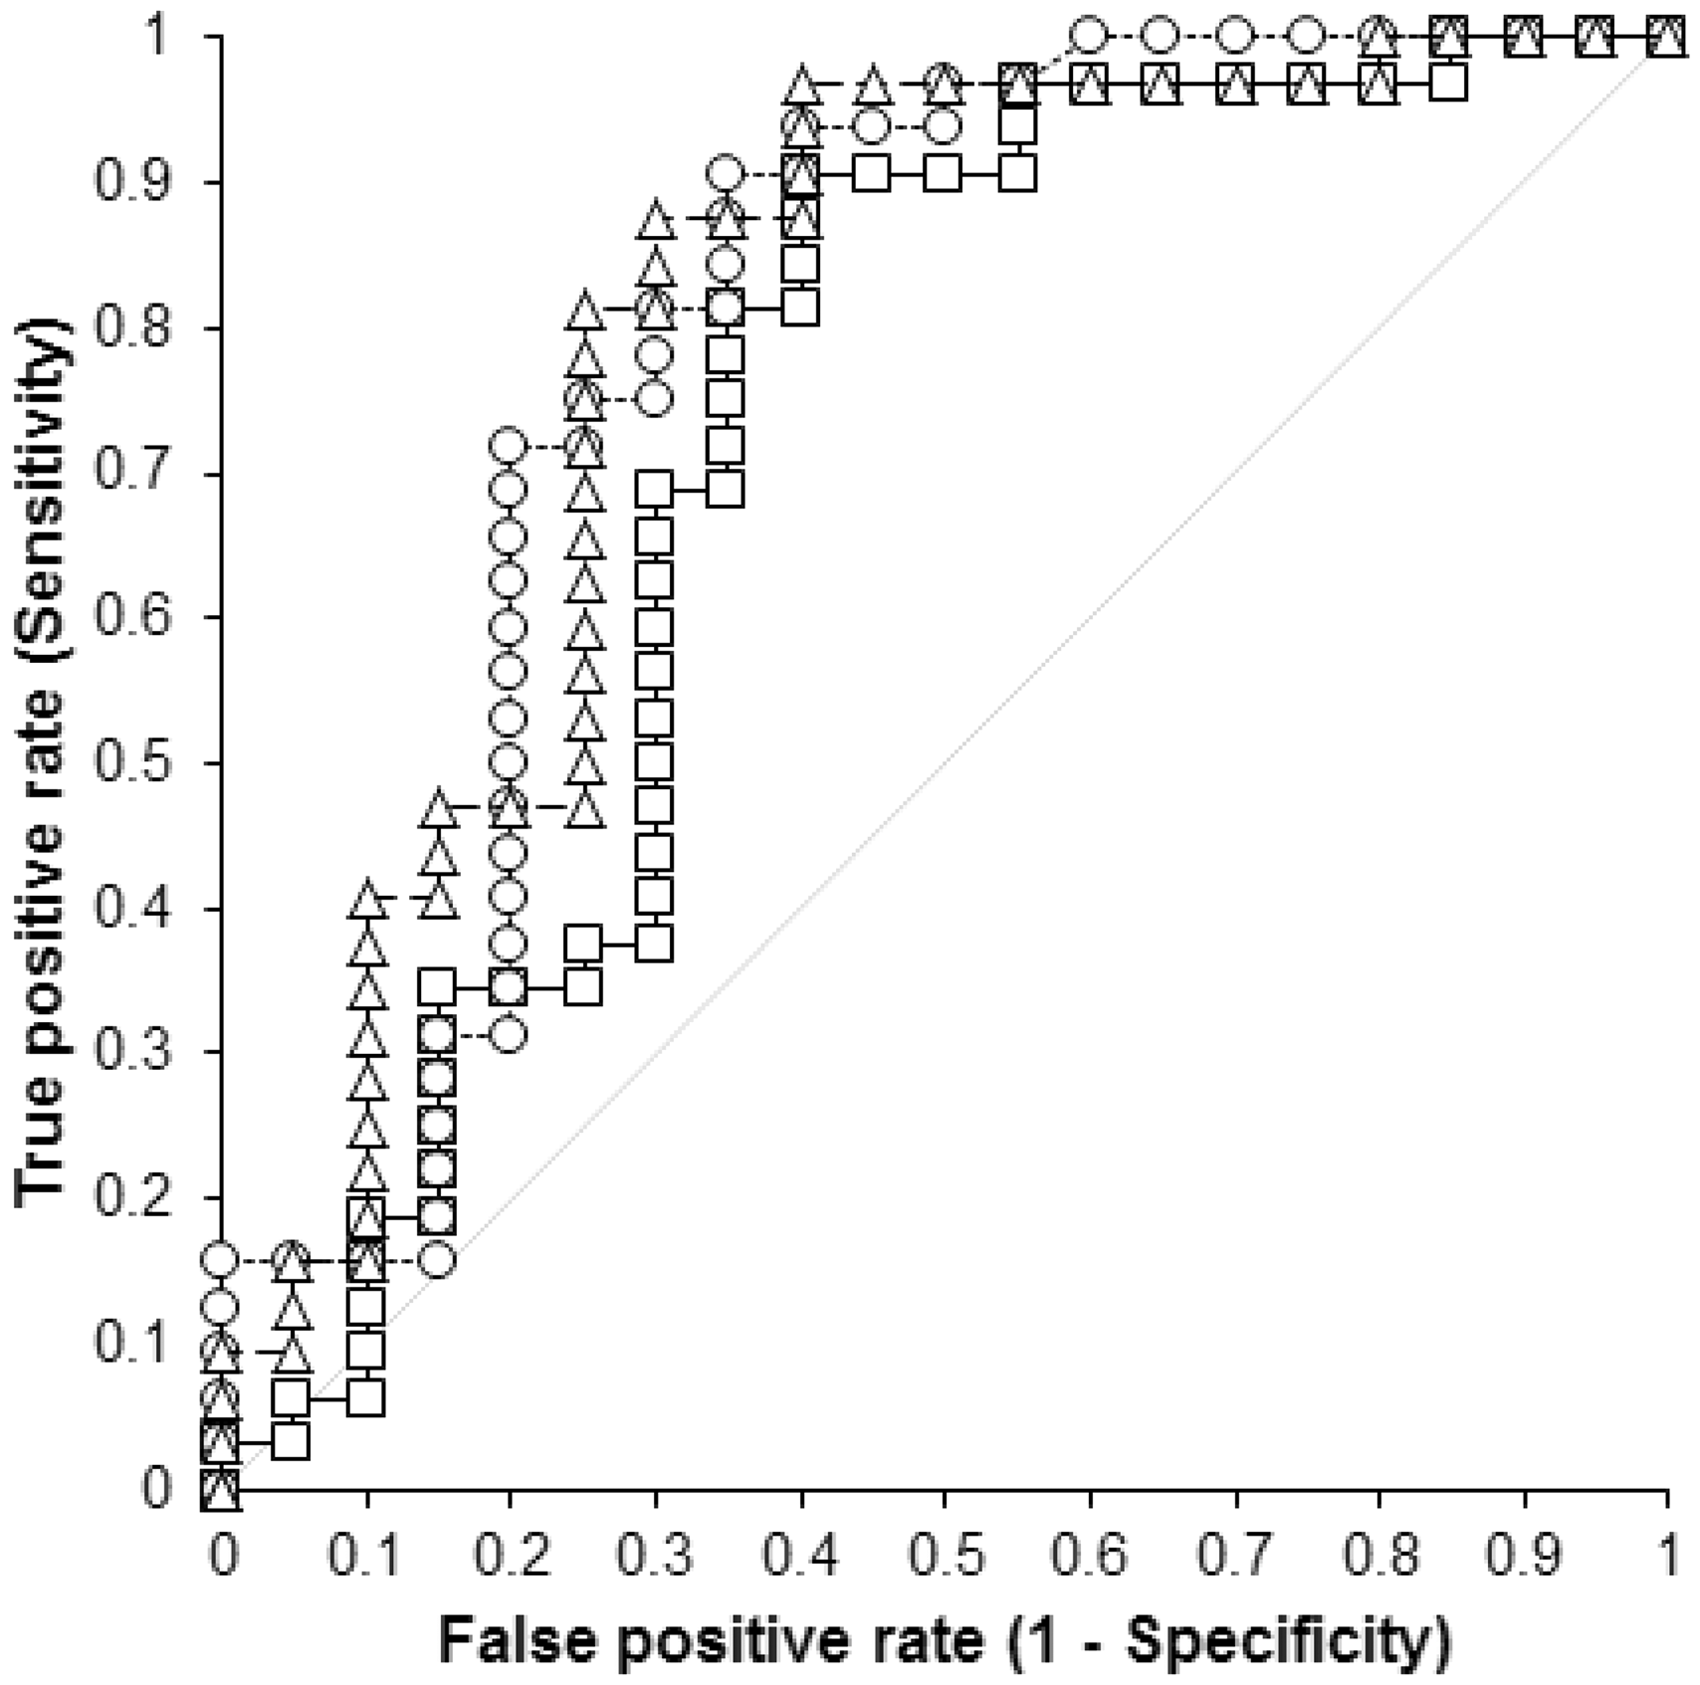
The cut-off value for IGF-1 giving best sensitivity (91% [95% CI 75–98%]) and specificity (65% [95% CI 41–85%)] for a significant decrease in PO4, was 63.7 µg/L, with a likelihood ratio of 2.59. The positive and negative predictive values were 80% and 81%, respectively. IGF-1 was shown to negatively correlate with the percentage change in PO4 (R2 = −0.29, P = 0.04) (Figure 2).
Spearman’s correlation plot of percentage drop in phosphate against baseline insulin-like growth factor-1 (IGF-1) concentrations (R2 = −0.29, P < 0.05).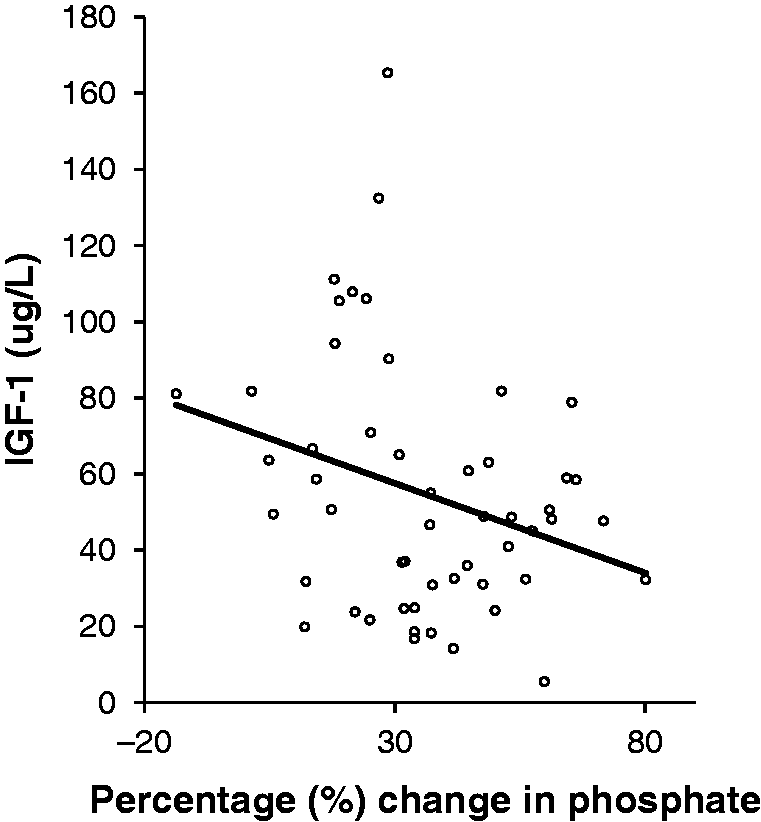
The IGF-1 values between patients that developed RH (≥30% fall in PO4 in the first 36 h of commencing PN) and those without RH, showed patients with PO4 decreases had lower IGF-1 (39.1 [27.4–53.2] µg/L) compared to those who did not (76.0 [50.0–105.8] µg/L), P = 0.005.
Lower IGF-1 was not associated with mortality. There was also no correlation between death and RH.
Discussion
RI predicts the risk of developing RH which is the hallmark biochemical feature seen in RS. Using a high sensitive assay for IGF-1 we generated a lower, more sensitive and specific cut-off for the RI than our previous study (0.125 vs. 0.190). 6 However, using the previous cut-off in our data set sensitivity rose from 88% to 97%, with specificity falling from 70% to 50%. We propose that these two cut-offs can be used to define patients with differing risk of developing RH. We suggest that a RI ≤0.125 be used to define patients at high risk of RH, whilst those with a RI between 0.125 and 0.190 can be deemed at moderate risk of RH. We have also shown that the use of a sensitive assay, IGF-1 alone is comparable to the RI.
In our group of patients, initial PO4 concentrations varied from those already below the reference range to those above it. Therefore, we deemed that the percentage fall in PO4 would be the best objective indicator of RH. Based on our previous work 6 and other studies7,8 we used ≥30% decrease in PO4 concentration within the first 12–36 h after starting PN as evidence of RH.
Our previous study was limited by the relatively insensitive IGF-1 assay with a detection limit of 25 µg/L. 6 In the current study employing a more sensitive IGF-1 assay (lower limit of detection 0.78 µg/L) has enabled detection of lower values of IGF-1, and as a result IGF-1 alone was superior in predicting RH compared to leptin alone whilst being equivalent to the RI. Measuring IGF-1 alone is more practical in routine laboratories as it can be run on automated analytical platforms 9 where as leptin requires a manual immunoassay. Furthermore, IGF-1 alone has a shorter turnaround time and also does not require a calculation step to generate the RI.
In addition, IGF-1 concentrations showed negative correlation with the degree of fall in PO4. There was also a significant difference between the IGF-1 concentration in patients with evidence of RH and those without. This supports the argument of the usefulness of IGF-1 as tool for predicting RH.
Unlike our previous study, no correlation between mortality, IGF-1 and a PO4 drop of ≥30% was observed. This may be due to the lower number of deaths compared to our previous study (17.3% vs. 22.9%). This suggests that although the majority of the patients in the current study developed evidence of RH the management may have been adapted to reduce mortality. A type II error may also explain the lack of association between IGF-1, decrease in PO4 and mortality. Another limitation of this study was not using age and gender specific IGF-1 concentrations due to the small cohort. A larger study may help to establish specific cut-offs for IGF-1 as a marker of RH in different age groups in both males and females.
In our patient group, the incidence of RH suggesting a diagnosis of RS was 61.5% as adjudged by the proportion of patients developing a significant fall of PO4 concentrations. This is higher than the reported incidence of RS in the literature 18–34%. 3 This may be explained by the nature of our tertiary referral centre where a number of our patients were transferred from other centres for both specialist surgical procedures and the availability of specialist intensive care units. Thus the period of malnutrition may have been longer compared to patients in other centres. The high incidence of RS may also indicate that patients typically have more complex medical histories and multiple co-morbidities at our centre.
There still remains a lack of clear guidance regarding electrolyte replacement for patients who are deemed at ‘high risk’ of RS. We excluded a total of 12 patients from the study as they had received additional PO4 therapy. Of these 12 patients only two had reductions in PO4 of ≥30%.
RS is often undetectable clinically as patients usually have a number of pre-existing and acute medical problems that may mask any symptoms occurring as a result of refeeding. 3 Therefore, biochemical diagnosis using the hallmark feature of hypophosphataemia is vital in identifying such patients. Of our 52 patients 32 (62%) demonstrated significant falls in PO4, but the NICE, 2006 criteria only identified 11 of these patients (21%) as at ‘high risk’ of developing RS. In some cases, this may be due to the lack of information available regarding the patients recent nutritional intake. In an attempt to compensate for the poor quality of nutritional history we initiated PN to provide 50% of the patient’s total energy requirements for the first 48 h of PN administration if in any doubt. Despite this approach our study showed that over half of our patients still developed RH.
In summary, a baseline IGF-1 concentration of <63.7 µg/L predicts the development of RH with comparable sensitivity and specificity to the previously defined RI. Thus, IGF-1 is a sensitive and specific biochemical marker that can be used in routine clinical practice to provide an objective marker to predict refeeding risk. Automated IGF-1 assays are currently available; thus measuring baseline IGF-1 in patients prior to starting PN can identify patients who are at the highest risk of developing RH, especially for patients where there is incomplete and unreliable nutritional history. Further larger studies, however, are needed to help validate IGF-1 as a clinical marker for use in routine practice.
Footnotes
Acknowledgment
We would like to thank Tracy Dew and Rebecca Musto from the clinical biochemistry department at King’s College Hospital, for their technical assistance in some parts of the study.
Declaration of conflicting interest
None.
Funding
Research and Development New Researcher Award, King’s College Hospital NHS Foundation Trust, London, UK.
Ethical approval
The study was approved by the King’s College Hospital Foundation Trust Research Committee (London, UK). The study was registered with ClinicalTrials.gov (NCT01227850).
Guarantor
RPV.
Contributorship
The authors’ contributions were as follows AG: design, collection of data, analyses and interpretation of data, drafting of the manuscript, critical review of the manuscript’s content and approval of the final version submitted for publication; SLA and DRT: analyses and interpretation of data, critical review of the manuscript’s content; and approval of the final version submitted for publication; RAS: interpretation of data, critical review of the manuscript’s content, and approval of the final version submitted for publication; MOE: design, collection of data, critical review of the manuscript’s content and approval of the final version submitted for publication; CWlR and JAZ: design, interpretation of data, critical review of the manuscript’s content; and approval of the final version submitted for publication; RPV: design, interpretation of data, drafting of the manuscript, critical review of the manuscript’s content; and approval of the final version submitted for publication.