
Abstract
Background
False-positive cardiac troponin (Tn) results caused by outliers have been reported on various analytical platforms. We have compared the precision profile and outlier rate of the Abbott Diagnostics contemporary troponin I (TnI) assay with their high sensitivity (hs) TnI assay.
Methods
Three studies were conducted over a 10-month period using routine patients’ samples. TnI was measured in duplicate using the contemporary TnI assay in Study 1 and Study 2 (n = 7011 and 7089) and the hs–TnI assay in Study 3 (n = 1522). Critical outliers were defined as duplicate results whose absolute difference exceeded a critical difference (CD = z x √2 x SDAnalytical) at a probability level of 0.0005, with one of the results on the opposite side of the decision limit to its partner.
Results
The TnI concentration at 10% imprecision (coefficient of variation) for the contemporary TnI assay was 0.034 µg/L (Study 1) and 0.042 µg/L (Study 2), and 0.006 µg/L (6 ng/L) for the hs–TnI assay. The critical outlier rates for the contemporary TnI assay were 0.51% (Study 1) and 0.37% (Study 2) using a cut-off of 0.04 µg/L, and 0% for the hs–TnI assay using gender-specific cut-offs.
Conclusion
The significant number of critical outliers detected using the contemporary TnI assay may pose a risk for misclassification of patients. By contrast, no critical outliers were detected using the hs–TnI assay. However, the total outlier rates for both assays were significantly higher than the expected variability of either assay. The cause of these outliers remains unclear.
Introduction
Cardiac troponin (Tn) is the biomarker of choice for the detection of myocardial insult owing to its high sensitivity (hs) and specificity compared to other available biomarkers.1,2 In 2000, the Joint European Society of Cardiology (ESC) and American College of Cardiology (ACC) Committee recommended a typical rise and gradual fall of Tn or a more rapid rise and fall of creatine kinase MB as central to the diagnosis of acute or recent myocardial infarction. 3 In 2012, the Joint ESC, ACC, American Heart Association and World Heart Federation Task Force published the third universal definition of acute myocardial infarction (AMI), recommending cardiac Tn as the preferred biomarker for diagnosis, measured with assays which achieve an optimal imprecision of ≤10% coefficient of variation (CV) at the 99th percentile of a reference population. 4 The analytical performance of Tn assays is therefore paramount importance for the effective use of low concentration Tn measurements in acute coronary syndrome risk assessment.
New hs Tn assays have recently been developed, allowing the measurement of Tn concentrations 10 - to 100-fold lower than contemporary sensitive assays. 5 Apple et al. have proposed that to define an hs assay, it must have a CV of ≤10% at the 99th percentile, and measurable concentrations should be achievable for at least 50%, and ideally >95% of a healthy population.6,7 Evidence suggests that hs–Tn assays outperform contemporary assays for both early detection of AMI and prediction of long-term adverse cardiac events owing to its improved analytical performance in the low-abnormal Tn range.8,9
Analytical false-positive Tn results have previously been reported using various platforms and with both contemporary and hs assays, although the exact cause of these spurious outliers has not yet been elucidated.10–12 Results from duplicate analysis of samples have determined that the spurious results occurred with both the first and second replicates, were predominantly false-positives and could not be reproduced in the majority of samples. 10 A need has clearly been identified to improve the analytical robustness of Tn measurement with particular regard to the accuracy of reporting low-positive results.
In this paper, we present data from three studies conducted in our laboratory over a 10-month period comparing the outlier rate and precision profiles of Tn measurements performed using the Abbott Diagnostics contemporary sensitive troponin I (TnI) assay with their new high sensitivity troponin I (hs–TnI) assay.
Materials and methods
Three studies were conducted over a 10-month period using blood samples collected from patients into Vacutainer PST™ gel tubes (Beckton Dickinson, Plymouth, UK). All Tn measurements were performed on either of two Abbott ARCHITECT i2000SR analysers in our laboratory, which are connected to the Abbott Accelerator Automated Processing System (APS), all using manufacturer-quoted guidelines. The assays used for each study and their respective performance characteristics as quoted by the manufacturer are outlined as follows.
Study 1 and Study 2: STAT-TnI reagent (Abbott Diagnostics, Sydney, Australia) which has an analytical sensitivity of ≤0.010 µg/L, 10% CV at 0.032 µg/L and a TnI concentration of 0.028 µg/L at the 99th percentile of an apparently healthy population. Our laboratory reports a decision limit of 0.040 µg/L for this assay.
Study 3: Prototype STAT hs–TnI reagent (Abbott Diagnostics, Sydney, Australia), which has a limit of detection (LOD) between 0.001 and 0.002 µg/L (1.1–1.9 ng/L), 10% CV at 0.005 µg/L (4.7 ng/L), 20% CV at 0.001 µg/L (1.3 ng/L) and a 4.0% CV at the 99th percentile of 0.026 µg/L (26.2 ng/L) for a reference population. At the gender-specific decision limits of 0.034 µg/L (34.2 ng/L) for males and 0.016 µg/L (15.6 ng/L) for females, the CVs were 3.5% and 5.3%, respectively. This assay has recently been approved for use in Australia by the Therapeutic Goods Administration and is awaiting approval in the USA by the Food and Drug Administration.
During the study periods, all samples with a Tn request were assayed in duplicate consecutively on the same analyser from the primary tube (sufficient sample being available). Haemolyzed samples and those requiring dilution (TnI concentration >50.0 µg/L) were excluded from the datasets. Initially, samples were centrifuged at 1400g for 7 min, with an increase to 10 min for a 5-week period during Study 1. However, since there was no apparent change in the number of outliers observed with the longer centrifuge time, the time was returned to 7 min for the remainder of Study 1 and subsequent studies.
Study 1 was initiated due to concern regarding false-positive results with the contemporary TnI assay from Abbott Diagnostics. A total of 7011 samples were assayed in duplicate for TnI (14,022 assays) between 2 September and 18 November 2011. Study 2 was conducted with sponsorship from Abbott Diagnostics between 19 January and 5 April 2012 (7089 samples, 14,178 assays). Prior to Study 2, full maintenance of the two ARCHITECT i2000SR analysers in the laboratory was performed by Abbott using an enhanced wash valve performance monitoring protocol. This resulted in six wash valves on each analyser being replaced. There was no significant change in analytic performance for TnI on either analyser based on a 2-month quality control (QC) dataset pre and post the service and valve change.
To assess whether QC specimens suffered the same frequency of outlier TnI results as routine patient samples, Cardiac Marker Plus LT QC material from BioRad with an assayed mean concentration of 0.223 ug/L was analysed in duplicate at a similar frequency to study patients’ samples (approx. every 20 min) over the course of each day under the standard analytical process on the Abbott APS between 6 January and 28 March 2012 (Study 2 time period) using the contemporary TnI assay. In addition, a low concentration QC sample Cardiac Marker Plus LT Low concentration with an assayed mean concentration of 0.062 ug/L was analysed in duplicate at a similar frequency to that of patients’ sample requests over the course of one day under the standard analytical process on the Abbott APS to assess the performance in the low analytical range.
Study 3 was performed as part of a multicentre Fresh Sample Characterization Study of the prototype hs–TnI assay conducted by Abbott Diagnostics. Data for the final study were collected from 1522 samples assayed in duplicate in our laboratory using the hs–TnI reagent (3044 assays) between 12 June and 29 June 2012. Analytical performance was monitored over the study period using standard operating protocols. BioRad Cardiac Marker Plus LT QC material was used for the contemporary TnI assay. Abbott hs–TnI QC material was used for the hs–TnI assay, and MAS CardioImmune-XL Low concentration QC was used for both the contemporary and hs–TnI assays.
Data from Study 1 and Study 2 were collated from analysis of results obtained as part of our routine service. Patient details were expunged from the datasets prior to analysis. Study 3 was performed using the hs–TnI assay which was not used in routine practice and therefore approval for the study was obtained from the Royal Perth Hospital Ethics Committee (EC 2012/085).
Statistical analysis
The precision profiles were created by grouping the data into bins and calculating the mean and percentage coefficient of variation (%CV) for each bin, after the exclusion of outliers from each dataset.
Outliers were identified using the formula to determine the critical difference (CD) between two results (CD = z × √2 × SDAnalytical). Using a predefined probability of 0.0005, where z = 3.5, the CD between duplicate results simplifies to 4.95 x SDAnalytical. Results were flagged as outliers when the absolute difference between duplicate results exceeded the CD. A critical outlier was defined as an outlier that could potentially have affected the clinical outcome, i.e. the two duplicate results were on either side of the decision limit. A decision limit of 0.040 µg/L was used for the contemporary TnI assay to determine a positive result (as used routinely). Gender-specific cut-offs were used for the hs–TnI assay: 0.016 µg/L (15.6 ng/L) for females and 0.034 µg/L (34.2 ng/L) for males (as quoted by the manufacturer).
Four concentrations of QC material were run twice a day for the routine contemporary TnI assay and three concentrations twice a day for the hs–TnI assay. The analytical SD was estimated using the cumulative internal QC imprecision data extracted from Unity Real Time® (Bio-Rad Laboratories) for each study period. Since each sample was assayed in duplicate on the same instrument, an analytical SD was calculated for each instrument and applied to the appropriate set of results. The estimated analytical SD for each pair of results was made by linear interpolation and extrapolation from a plot of QC mean against SD. The analytical SD increased as expected with increasing TnI concentration and thus the CD between duplicate results also increased, meaning that the absolute difference between the results becomes more significant at lower TnI concentrations.
The Chi-squared test was used to determine firstly, whether there were any significant differences between the rates of observed and expected outliers found in each study, at a probability of 0.0005, and whether the rate of outliers decreased significantly following the preventive maintenance on the instruments prior to Study 2 as described above, or by increasing the assay sensitivity in Study 3. All data analyses were carried out using Microsoft® Excel.
Results
Precision profiles
The precision profiles obtained from each study are depicted in Figure 1. Only the range close to the decision limit and the LOD of the assay is shown (0.00–1.00 µg/L). In Study 1, the contemporary TnI assay had a 10% CV at a mean TnI of 0.034 µg/L, comparable with 0.042 µg/L for Study 2. The hs–TnI assay in Study 3 had a 10% CV at a TnI concentration of 0.006 µg/L (6 ng/L).
Precision profiles with %CV plotted against TnI concentration. Results of duplicate analysis were grouped into bins and the %CV calculated. The dashed line indicates the TnI concentration at 10% CV. The contemporary generation Abbott TnI assay was used in Study 1 and Study 2, and the hs–TnI assay was used in Study 3.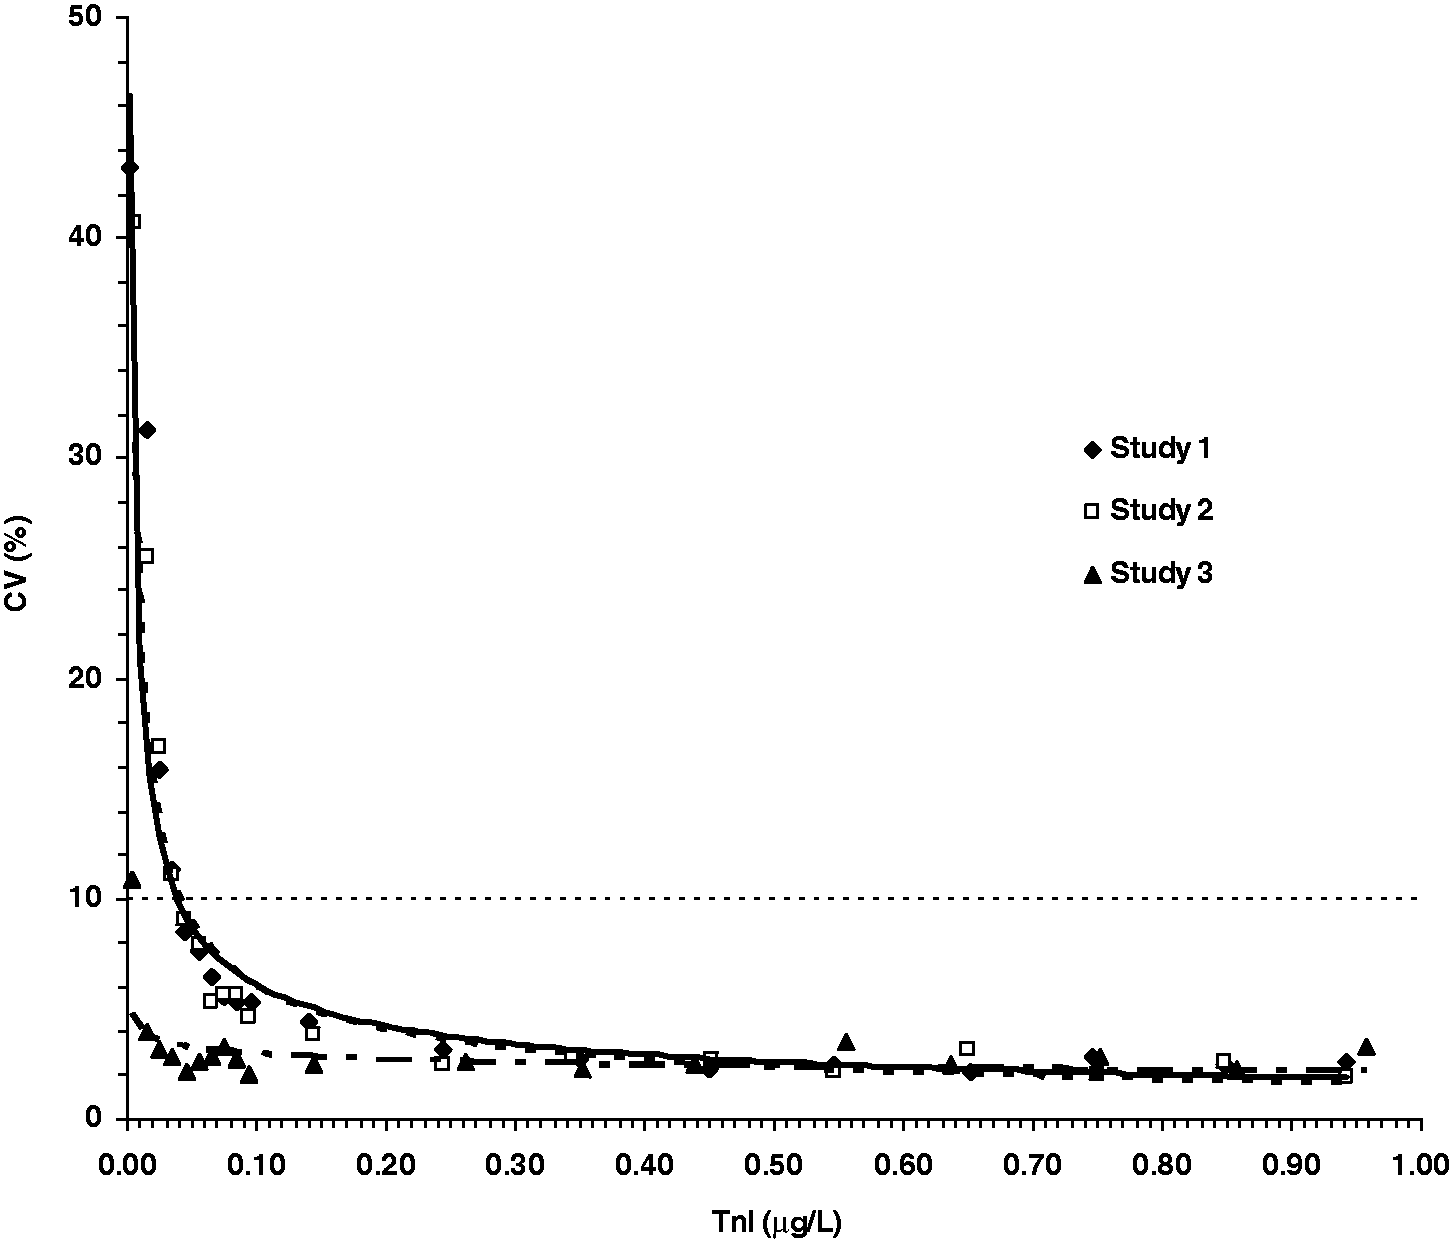
Outlier rates
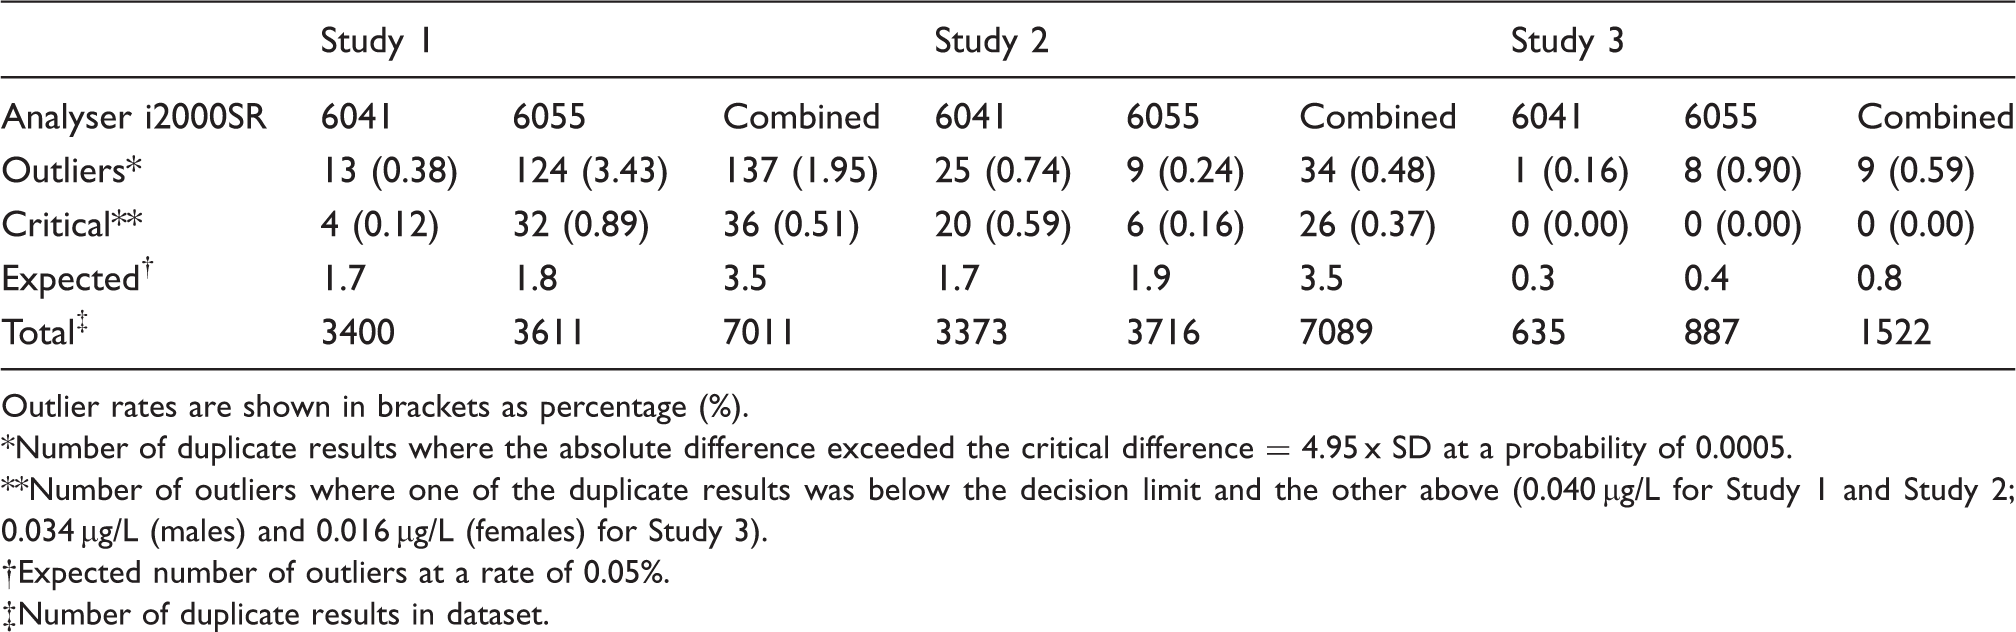
The observed number of outliers found in each study at an expected probability of 0.0005 (1 in every 2000 events) is summarized in Table 1. The distribution of duplicate TnI results for each sample is depicted in Figure 2, for the clinically important range of 0.00–0.26 µg/L. This range accounted for 96.4% and 91.1% of total outliers in Study 1 and Study 2, respectively. Outliers are highlighted in bold and represent a distinct population. Chi-squared analysis was used to determine the statistical significance between observations made in the datasets. The observed total number of outliers exceeded the expected number calculated using the rate of 0.05% in Study 1, Study 2 and Study 3 by 39 -, 10 - and 11-fold, respectively (Table 1). The total outlier rate of 1.95% found in Study 1 prior to routine analyser service and valve replacement was significantly higher than both the rate of 0.48% in Study 2 (χ2 = 64.0, P < 0.0001) and the rate of 0.59% in Study 3 (χ2 = 13.8, P = 0.0002).
Distribution of TnI results from duplicate analysis of samples in each study, with outliers highlighted in bold. Outliers were identified if the absolute difference between duplicate results exceeded the critical difference (= 4.95 x SD at a probability of 0.0005). The dashed lines represent the decision limits of 0.040 µg/L for Study 1 and Study 2, and 0.034 µg/L (males) and 0.016 µg/L (females) for Study 3. Result 1 was not necessarily derived from the first aliquot assayed in a duplicate analysis of the same sample, and result 2 not necessarily the second. Only the low concentration TnI range of 0.000–0.260 µg/L is shown. This concentration range accounted for 96.4% of total outliers for Study 1, 91.1 % for Study 2 and 55.6% for Study 3. The contemporary Abbott TnI assay was used in Study 1 and Study 2, and the hs–TnI assay was used in Study 3. Number of outliers observed in each study from duplicate analysis of TnI, grouped according to analyser. An instrument-specific SD at mean duplicate concentration was interpolated from the QC data to determine the outliers. The contemporary Abbott TnI assay was used in Study 1 and Study 2, and the hs–TnI assay was used in Study 3. Outlier rates are shown in brackets as percentage (%). Number of duplicate results where the absolute difference exceeded the critical difference = 4.95 x SD at a probability of 0.0005. Number of outliers where one of the duplicate results was below the decision limit and the other above (0.040 µg/L for Study 1 and Study 2; 0.034 µg/L (males) and 0.016 µg/L (females) for Study 3). Expected number of outliers at a rate of 0.05%. Number of duplicate results in dataset.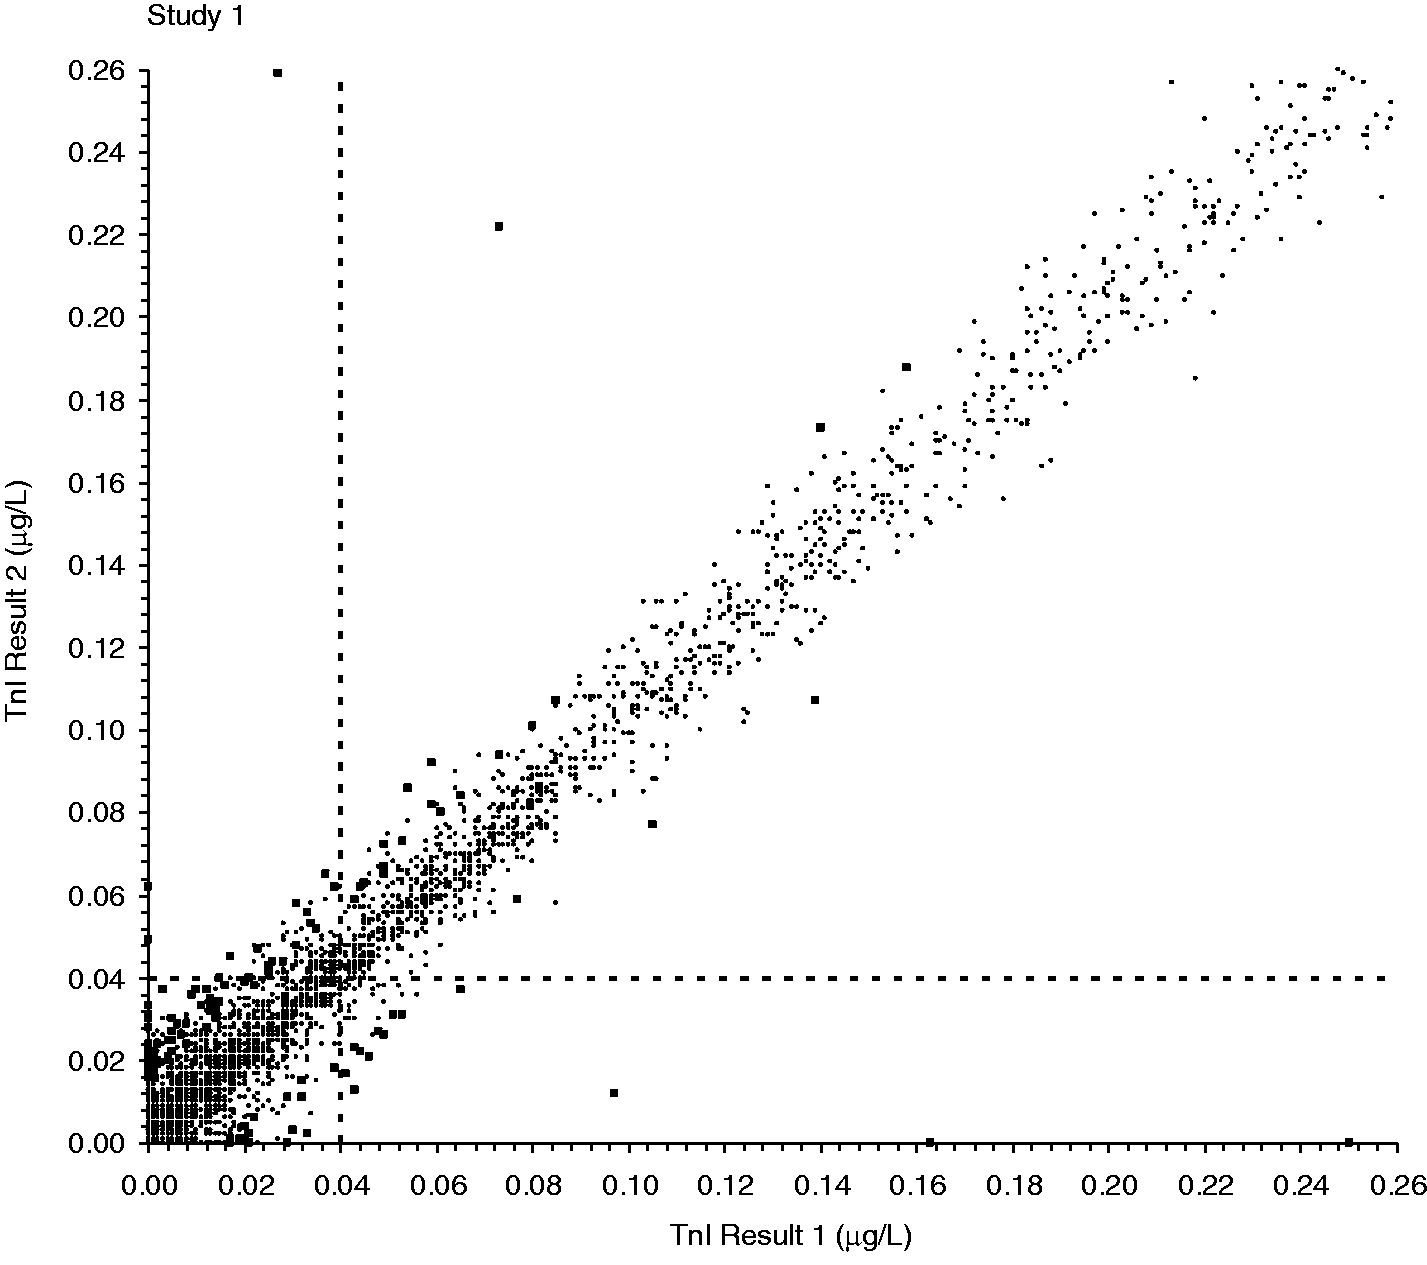
TnI results for the nine outliers found in Study 3 using the new hs–TnI assay. Zero critical outliers were found. Gender-related decision limits were applied: 34.2 ng/L for males and 15.6 ng/L for females.
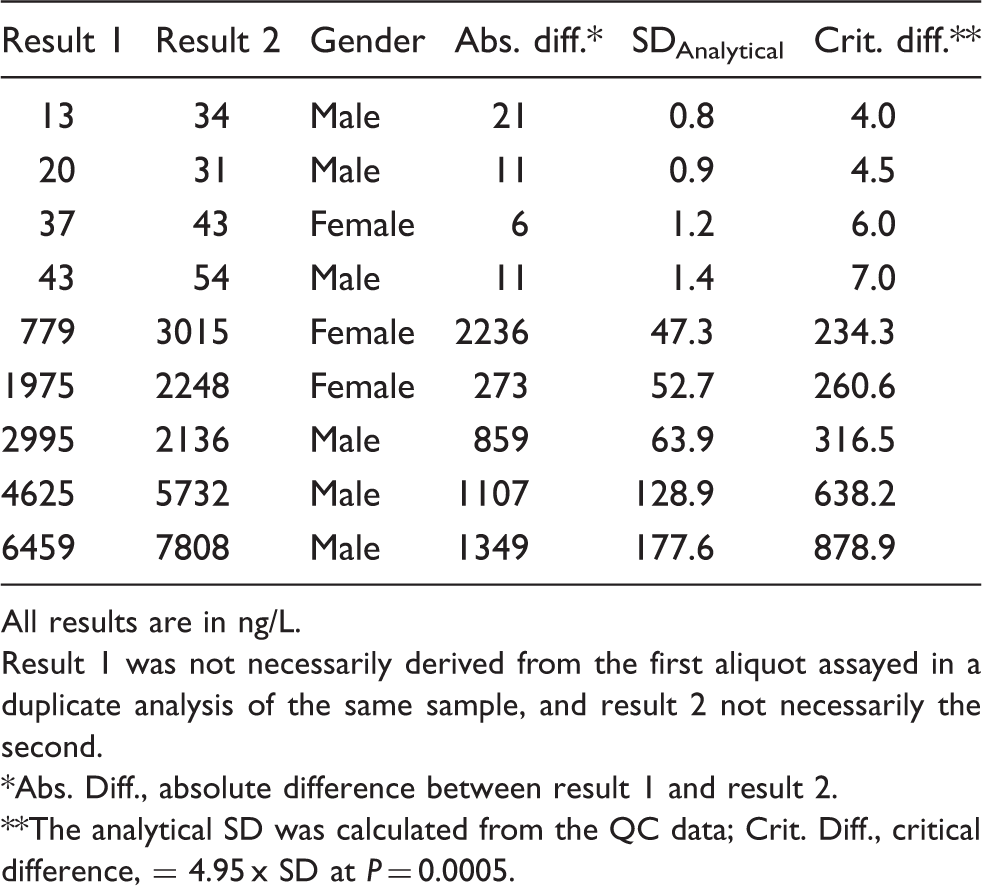
All results are in ng/L.
Result 1 was not necessarily derived from the first aliquot assayed in a duplicate analysis of the same sample, and result 2 not necessarily the second.
Abs. Diff., absolute difference between result 1 and result 2.
The analytical SD was calculated from the QC data; Crit. Diff., critical difference, = 4.95 x SD at P = 0.0005.
When the outlier rates on individual instruments were examined, the number of outliers which occurred on analyser iSR6055 was significantly higher than on analyser iSR6041 in Study 1 (χ2 = 85.1, P < 0.0001), significantly lower in Study 2 (χ2 = 9.22, P = 0.002) and no difference in Study 3 (χ 2 = 3.49, P = 0.06). However, looking at individual analysers across studies, iSR6055 had a significantly lower outlier rate of 9/3716 in Study 2 compared with 124/3611 in Study 1 (χ2 = 104.7, P < 0.0001), but the change in outlier rate from 13/3400 to 25/3373 with analyser iSR6041 between Study 1 and Study 2 did not reach statistical significance (χ2 = 3.91, P = 0.05).
TnI results for the critical outliers from Study 1 and Study 2 where sufficient sample volume allowed for repeat duplicate analysis (n = 29). Discordant results are highlighted in bold.
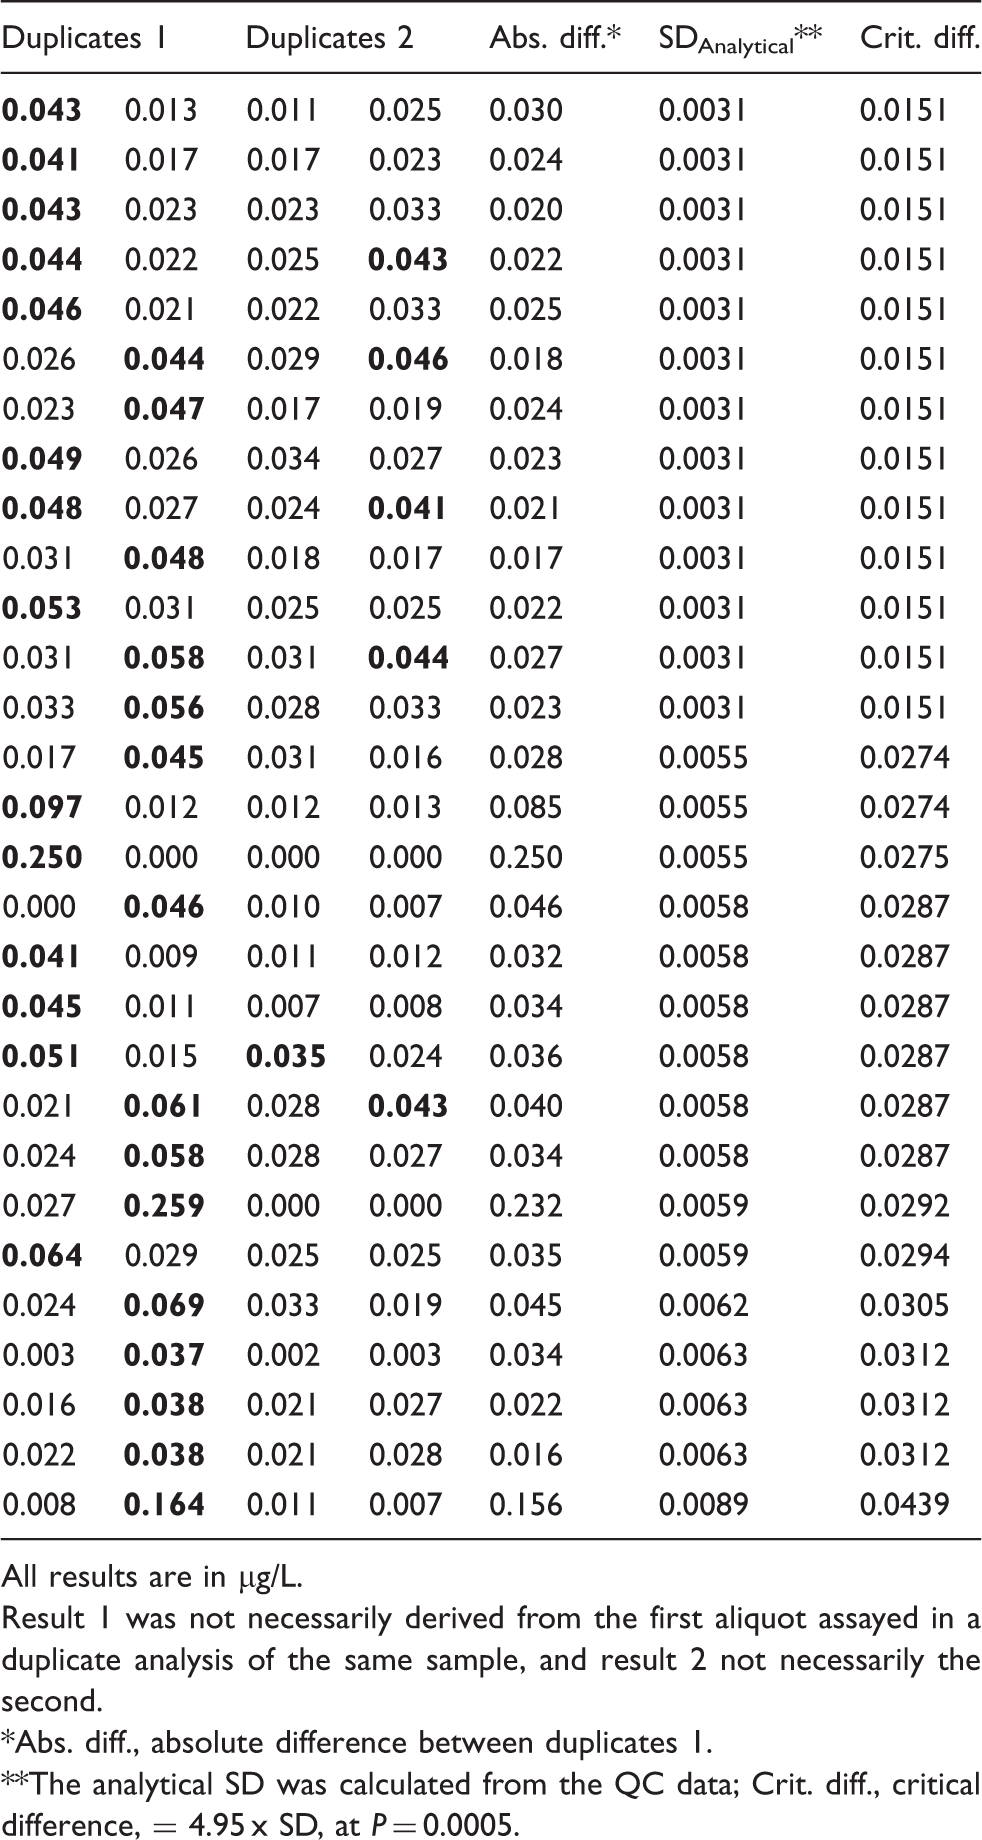
All results are in µg/L.
Result 1 was not necessarily derived from the first aliquot assayed in a duplicate analysis of the same sample, and result 2 not necessarily the second.
Abs. diff., absolute difference between duplicates 1.
The analytical SD was calculated from the QC data; Crit. diff., critical difference, = 4.95 x SD, at P = 0.0005.
Discussion
From duplicate analysis of three large cohorts of patients’ samples over a 10-month period, we determined the precision profiles and outlier rates for the contemporary sensitive TnI and hs–TnI assays from Abbott Diagnostics. The precision was superior for the hs–TnI assay (10% CV at mean TnI of 0.006 µg/L) than with the contemporary TnI assay (10% CV at mean TnI of 0.034–0.042 µg/L), as expected. 13 It should be noted that the precision estimates reported in this paper reflect the intra-assay variation at the time of duplicate analysis. Outlier rates were 1.95% and 0.48% for the contemporary TnI assay in Study 1 and Study 2, respectively. However, the outlier rates on individual instruments did not show a uniform reduction from Study 1 to Study 2 (Table 1); therefore, it is unclear if the enhanced maintenance protocols performed by Abbott did in fact make any difference. Pretorius et al. found an outlier rate of 0.21% using the contemporary Abbott TnI assay on the same analytical platform. 11 Outlier rates reported on other analytical platforms using contemporary sensitive assays ranged between 0.21% for the Siemens Advia Centaur XP and 3.1% for the Beckman Access, and using an hs assay (Roche Troponin T hs) on the Roche Cobas e601 was found to be 0.13%.10,11,14 The lack of difference between the outlier rate of 0.48% found with the contemporary assay in Study 2 and the 0.59% rate with the hs assay in Study 3 would suggest that improving the analytical imprecision in the low assay range by using a more sensitive assay does not decrease the outlier rate.
Critical outliers were defined as outliers which could have potentially caused adverse clinical outcomes should the erroneous result have been reported, and were identified when each of the duplicate results was on either side of the decision limit. The critical outlier rate is therefore of greater clinical importance than the total outlier rate alone. In Study 3, a critical outlier rate of zero was found, which is significantly lower than both the rate of 0.37% found in Study 2 and rate of 0.51% in Study 1. However, the critical outlier rate may vary depending on the decision limit used. Gender-specific decision limits of 34.2 ng/L and 15.6 ng/L (the 99th percentiles determined by the manufacturer for male and female reference populations, respectively) were used for the hs–TnI assay to define a critical outlier in our study, but needs to be determined for our local population. Gender-related decision limits with notably higher concentrations in males compared with females have previously been determined.13,15,16
A group of results around the decision point with the duplicates on either side of the cut-off are not classed as outliers where the difference between the duplicate results can be attributed to the analytical imprecision alone. On the other hand, the outliers appear to form a distinct population and do not cluster around the decision point. The source of the outliers which remained after attempting to eliminate instrument-related variables is unclear. The photometer electronic signal and all pipetting station pressure monitoring for all of the samples producing outliers during Study 2 were evaluated by the manufacturer from instrument data logs accessed through an electronic link. The logs indicated that for all outliers the analysers performed all actions within manufacturer specifications.
The long-term day-to-day imprecision of the contemporary TnI assay was assessed using 4767 replicates of a single concentration of QC material at a mean concentration of 0.226 ug/L and was found to be acceptable (7.8% CV), and importantly, showed no outliers. This outlier rate of zero found using QC samples would suggest that outliers are seen only with patient specimens and that sample-related factors are likely to blame for their occurrence. Pre-analytical factors may influence Tn results as they may any other biomarker, but the structural complexity of Tn, its various molecular forms and stability issues may further complicate matters. 17 The presence of heterophile antibodies or TnI autoantibodies, a cause of false-positive Tn results,18–20 would generally be reproducible and unlikely to be the cause of the outliers seen here. The presence of fibrin microclots has been suggested as the cause of false-positive Tn results in both serum and heparinized plasma samples.12,21
These outlier rates, especially the critical outlier rates seen with the contemporary assay would have been of concern to clinicians relying upon Tn measurements for diagnosis of AMI. To avoid reporting erroneous results, a repeat testing protocol was implemented by our laboratory for the contemporary TnI assay which was used routinely, prior to Study 1. Outliers occurred in either the first or second replicate and in most cases the higher of the two results was not reproducible by repeat analysis, giving a predominance of false-positive results with the contemporary assay. Recent guidelines recommend the use of hs–Tn assays in preference to contemporary assays where possible, because of their higher sensitivity for detection of AMI.5,22 If using hs–Tn, earlier timing of sampling is recommended; a value <99th percentile or a change from baseline of <50% at 3 h after presentation and at least 6 h after symptom onset can be used in an early rule-out strategy. A positive hs–TnI however, should be repeated at 3–6 h after presentation to distinguish between AMI and causes of chronically elevated Tn. 5 Clearly, a false-negative result would have a more detrimental effect on the clinical outcome than a false-positive result, which would be followed up with a repeat sample. This emphasizes the importance of the low rate of critical outliers detected in the hs–TnI assay.
Conclusions
A significant number of outliers have been found in both the contemporary TnI assay by Abbott Diagnostics and the hs–TnI assay. The outliers occur spuriously and randomly, with no definitive cause, and cannot be attributed to the analytical imprecision alone. However, both instrumental and pre-analytical factors may influence the outlier rate. A repeat testing protocol for low-positive results will identify erroneous Tn results caused by outliers and prevent any from being reported. No critical outliers were found in the hs–TnI assay with the use of manufacturer-quoted gender-specific cut-offs, providing confidence that the risk of misclassification of patient results is low.
Footnotes
Acknowledgements
Study 1 was initiated by the laboratory. Study 2 was designed in collaboration with Abbott Diagnostics. Study 3 was part of a multicentre trial initiated and designed by Abbott Diagnostics who supplied reagents for the duplicate analyses for Study 1 and Study 2 and all analyses for Study 3. However, the data analyses and drafting of the manuscript were performed solely by the authors.
Declaration of conflicting interests
JB has acted as a paid consultant to Abbott Diagnostics.
Funding
Reagents donated by Abbott Diagnostics.
Ethical approval
Ethics approval for Study 3 was obtained from the Royal Perth Hospital Ethics Committee (EC 2012/085).
Guarantor
JB.
Contributorship
JB, PS and SV designed Study 1 and Study 2. JB and RL oversaw the analyses of samples. JB and NS analysed the results. NS drafted the manuscript with contribution from all authors.