
Abstract
Background
Insulin-like growth factor binding protein-1 (IGFBP-1) is a hepatically synthesised protein which can be used as a marker of insulin resistance. We hypothesised that the fall in serum IGFBP-1 at 2 h following a glucose load (ΔIGFBP-10–2h) would be a more robust measure of hepatic insulin resistance than a fasting level alone.
Methods
All subjects had a standard 75 g oral GTT including IGFBP-1 and insulin measurement to enable calculation of ΔIGFBP-10–2h, ΔInsulin0–2h, and insulin sensitivity indices. At a second visit, subjects had a frequently sampled intravenous glucose tolerance test (FSIVGTT) in order to determine the insulin sensitivity index, Si.
Results
Twenty-two individuals had normal glucose tolerance (NGT) and 9 impaired fasting glucose (IFG). ΔIGFBP-10–2h correlated with Si in total subjects (r = 0.49, p = 0.005) and NGT subjects (r = 0.50, p = 0.02) but not in IFG subjects (r = 0.43, p = 0.24). ΔInsulin0–2h/ΔIGFBP-10–2h correlated significantly with Si in total subjects (r = −0.68, p < 0.001) and in NGT subjects (r = −0.57, p = 0.005). Multivariate analysis was fitted using different models while keeping other explanatory variables constant. The fasting IGFBP-1 model was a better predictor of Si (β = 0.431, p < 0.0001) than the ΔInsulin0–2h/ΔIGFBP10–2h model (β = −0.185, p = 0.004).
Conclusions
The dynamic indices ΔIGFBP-10–2h and ΔInsulin0–2h/ΔIGFBP-10–2h appear suitable markers of (hepatic) insulin resistance with potential clinical utility.
Introduction
Insulin resistance predisposes to cardiovascular disease and type 2 diabetes. 1 Although not routinely measured in clinical settings, it has been widely measured for research purposes. It can be estimated using the hyperinsulinaemic euglycaemic clamp (HEC) which is the gold standard technique or by the frequently sampled intravenous glucose tolerance test (FSIVGTT) which is a simpler alternative. It can also be estimated using simple indices such as homeostasis model assessment (HOMA-IR) 2 and fasting plasma insulin (FPI). 3 Whilst simpler to apply than the gold standard techniques, these all suffer from limitations which have been reviewed previously. 4 Among novel parameters of insulin resistance is fasting serum insulin-like growth factor binding protein-1 (IGFBP-1). 5 It correlates strongly with measurements of insulin sensitivity made by HEC and with HOMA-IR.6,7 We have previously shown, by means of validation against the FSIVGTT, that in subjects with normal glucose tolerance (NGT) fasting serum IGFBP-1 could be used as a simple and reliable marker of insulin sensitivity. 8 Moreover, its concentrations do not fluctuate as rapidly or as widely as those of insulin.
A difficulty in interpreting the various indices of insulin resistance is that they reflect different biological functions. The HEC, which usually involves suppressing hepatic glucose output (HGO), predominantly reflects peripheral glucose disposal and peripheral insulin resistance. Si is the insulin sensitivity index derived from the FSIVGTT. It represents the net fractional glucose clearance rate per unit change in the serum insulin concentration following a glucose load (min−1·µU−1·mL−1). 9 It should be distinguished from glucose effectiveness (Sg) which represents the ability of glucose to promote its own disposal and does not concern us in this study. Si reflects both hepatic and peripheral insulin resistance whereas HOMA-IR, a parameter based on a single fasting specimen, largely reflects hepatic insulin resistance. The problem with this in practice is that peripheral and hepatic insulin resistance may differ. Many individuals with near normal whole body insulin sensitivity have significantly impaired hepatic insulin sensitivity and vice versa. 10 This difference can manifest itself clinically. Where hepatic insulin resistance predominates, there is elevated HGO resulting in elevated fasting glucose levels. Where peripheral insulin resistance predominates, post-load glucose levels tend to be higher reflecting impaired peripheral glucose disposal. It is appropriate therefore to consider how novel indices reflect insulin resistance at these different sites. 11
Serum IGFBP-1 levels vary reciprocally with those of insulin in individuals who are insulin resistant tending to have higher fasting insulin levels and lower IGFBP-1 levels than normal subjects. The changes in serum levels of IGFBP-1 lag behind those of insulin due to the suppressive action of insulin on hepatic IGFBP-1 gene transcription and the longer serum half life of IGFBP-1. This has been reported to be 89 min, considerably longer than that of insulin, which is only a few minutes.12,13 Individuals in whom hepatic insulin resistance predominates would be expected to have a lesser fall in IGFBP-1 as insulin rises following a caloric load. Furthermore, it is recognised that dynamic tests can be more discriminating than single measurements. We therefore hypothesised that the fall in serum IGFBP-1 at 2 h following a glucose load (ΔIGFBP-10–2h) would be a more robust measure of hepatic insulin resistance than a fasting level alone with a lesser fall indicative of greater hepatic insulin resistance. Here we compared ΔIGFBP-10–2h to Si and other insulin resistance indices in non-diabetic subjects.
Subjects and methods
Subjects
Clinical and biochemical characteristics of subjects in the different glycaemic categories.
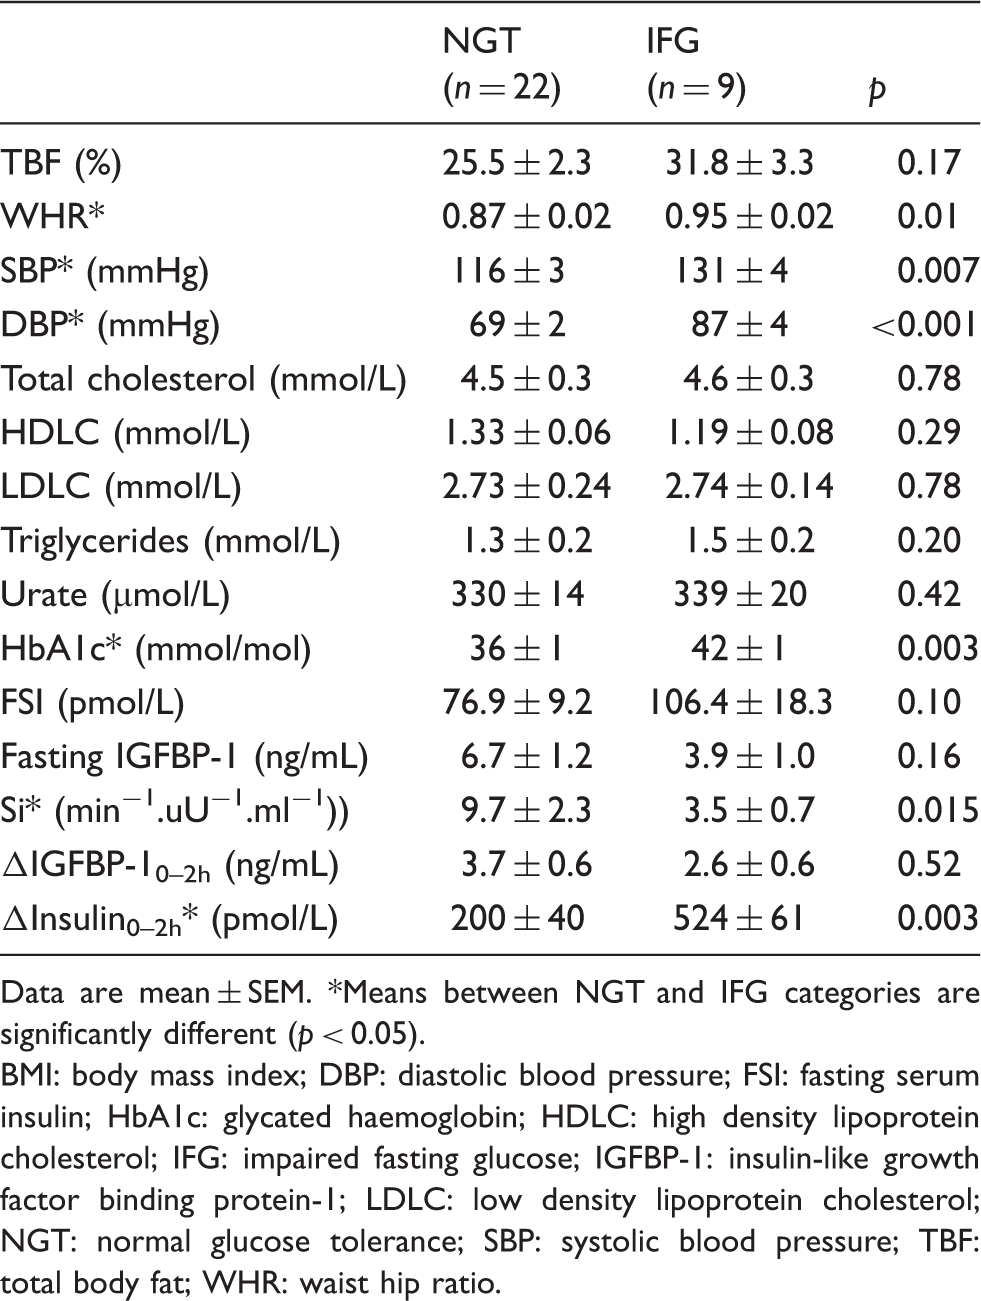
Data are mean ± SEM. *Means between NGT and IFG categories are significantly different (p < 0.05).
BMI: body mass index; DBP: diastolic blood pressure; FSI: fasting serum insulin; HbA1c: glycated haemoglobin; HDLC: high density lipoprotein cholesterol; IFG: impaired fasting glucose; IGFBP-1: insulin-like growth factor binding protein-1; LDLC: low density lipoprotein cholesterol; NGT: normal glucose tolerance; SBP: systolic blood pressure; TBF: total body fat; WHR: waist hip ratio.
All subjects had waist hip ratio (WHR) measured. Blood pressure (BP) was measured using a Critikon Dinamap TS BP machine (Tampa, Florida, USA). Percentage total body fat (TBF) was estimated by bioimpedance analysis using a Tanita BF-680 tetra-polar bioelectric impedance device (Tokyo, Japan). All subjects gave informed consent for participation and the study was approved by the South West Surrey Local Research Ethics Committee, Guildford, UK (Study number 05/Q1909/72).
Frequently sampled intravenous glucose tolerance test and simple indices
At a second visit, subjects underwent a standard FSIVGTT. The mean interval between the first and second visits was 10 days. Following placement of two intravenous cannulae, baseline blood samples for insulin and glucose measurement were taken at 15, 20, 25 and 30 min. Glucose (0.3 g/kg of 50%) was then injected over 1 min and samples drawn at intervals up to 180 min as previously described. 8 Subjects had 2 mL of blood taken at each time point, 1 mL into fluoride oxalate and 1 mL into a plain plastic tube for insulin analysis. All specimens were separated promptly and stored on ice until the end of the test. Glucose analysis was carried out on the fluoride oxalate plasma later the same day. Serum for insulin assay was stored at −80℃ until analysis. Data analysis was carried out using the software package Millennium 6.02 purchased from MinMod Inc (Pasadena, California, USA). 15
Assays
Routine laboratory analyses were carried out on a Siemens Advia 1650 auto-analyser (Camberley, Surrey, UK). Glucose was assayed by the hexokinase method and urate by a uricase method. 16 Cholesterol measurement was by an enzymatic method using cholesterol esterase, 17 HDL-cholesterol by a direct method using a colorimetric endpoint based on Trinder reaction 18 and triglycerides by a method based on a Fossati three-step enzymatic reaction. 19 LDL-cholesterol was estimated by calculation using the Friedewald formula. 20 Glycated haemoglobin (HbA1c) analysis was by high pressure liquid chromatography on a Biorad Variant-II instrument. Insulin was measured by solid phase two-site ELISA (Mercodia, Uppsala, Sweden) with detection limit of 7.0 pmol/L and mean analytical CV of 4.9% within and between runs. IGFBP-1 was measured by in-house ELISA using a biotinylated monoclonal antibody and other R&D analytical components. The maximum analytical CVs were 7.0% and 9.1% for intra- and inter-assay precision, respectively, and sensitivity was 0.01 ng/mL. The mean values for quality control sera (within and between IGFBP-1 assays) were 1.3, 4.2, 23.2 ng/mL for low, medium and high levels, respectively.
The binding of IGFBP-1 to capture antibody was validated using a western blotting technique which showed no cross reactivity with other binding proteins. 12
Simple insulin resistance indices
The index ISI-gly (insulin sensitivity index-glycaemia) was calculated using the formula

HOMA-IR was calculated using the formula:


Statistics
Data were analyzed using SPSS version 17 (SPSS Inc, Chicago, Illinois, USA). Data were transformed using natural logarithm (Ln) in the subjects to approximate a normal distribution. Associations between data were examined using Pearson’s correlation coefficients and a two-tailed t-test. Comparisons of the means were performed using Mann-Whitney and unpaired Student’s t-tests. Statistical significance was taken as p < 0.05. Multiple linear regression analysis was used to model the data and LnSi used as a function of the explanatory variables. Model fit was assessed using the F test. Multicollinearity was assessed using the variance inflation factor (VIF). The level of significance was set at 5%.
Results
There were 22 subjects with normal glucose tolerance (NGT) (15 males, seven females, aged 38.5 ± 13.6 years and BMI 26.2 ± 4.7 kg/m2) and nine subjects with impaired fasting glucose (IFG) (six males, three females, aged 49 ± 8.7 years and BMI 30.3 ± 3.1 kg/m2). A comparison between the groups is shown in Table 1. Individuals with IFG were older, had higher systolic and diastolic blood pressures and higher HbA1C than those with NGT. Furthermore, ΔInsulin 0–2h after a glucose load was much higher in the group with IFG. ΔIGFBP-10–2h was not significantly different between the two groups. Fasting IGFBP-1 was strongly correlated with Si in total subjects but not in subjects with IFG as previously reported by ourselves in these subject groups. 8
Correlation analysis
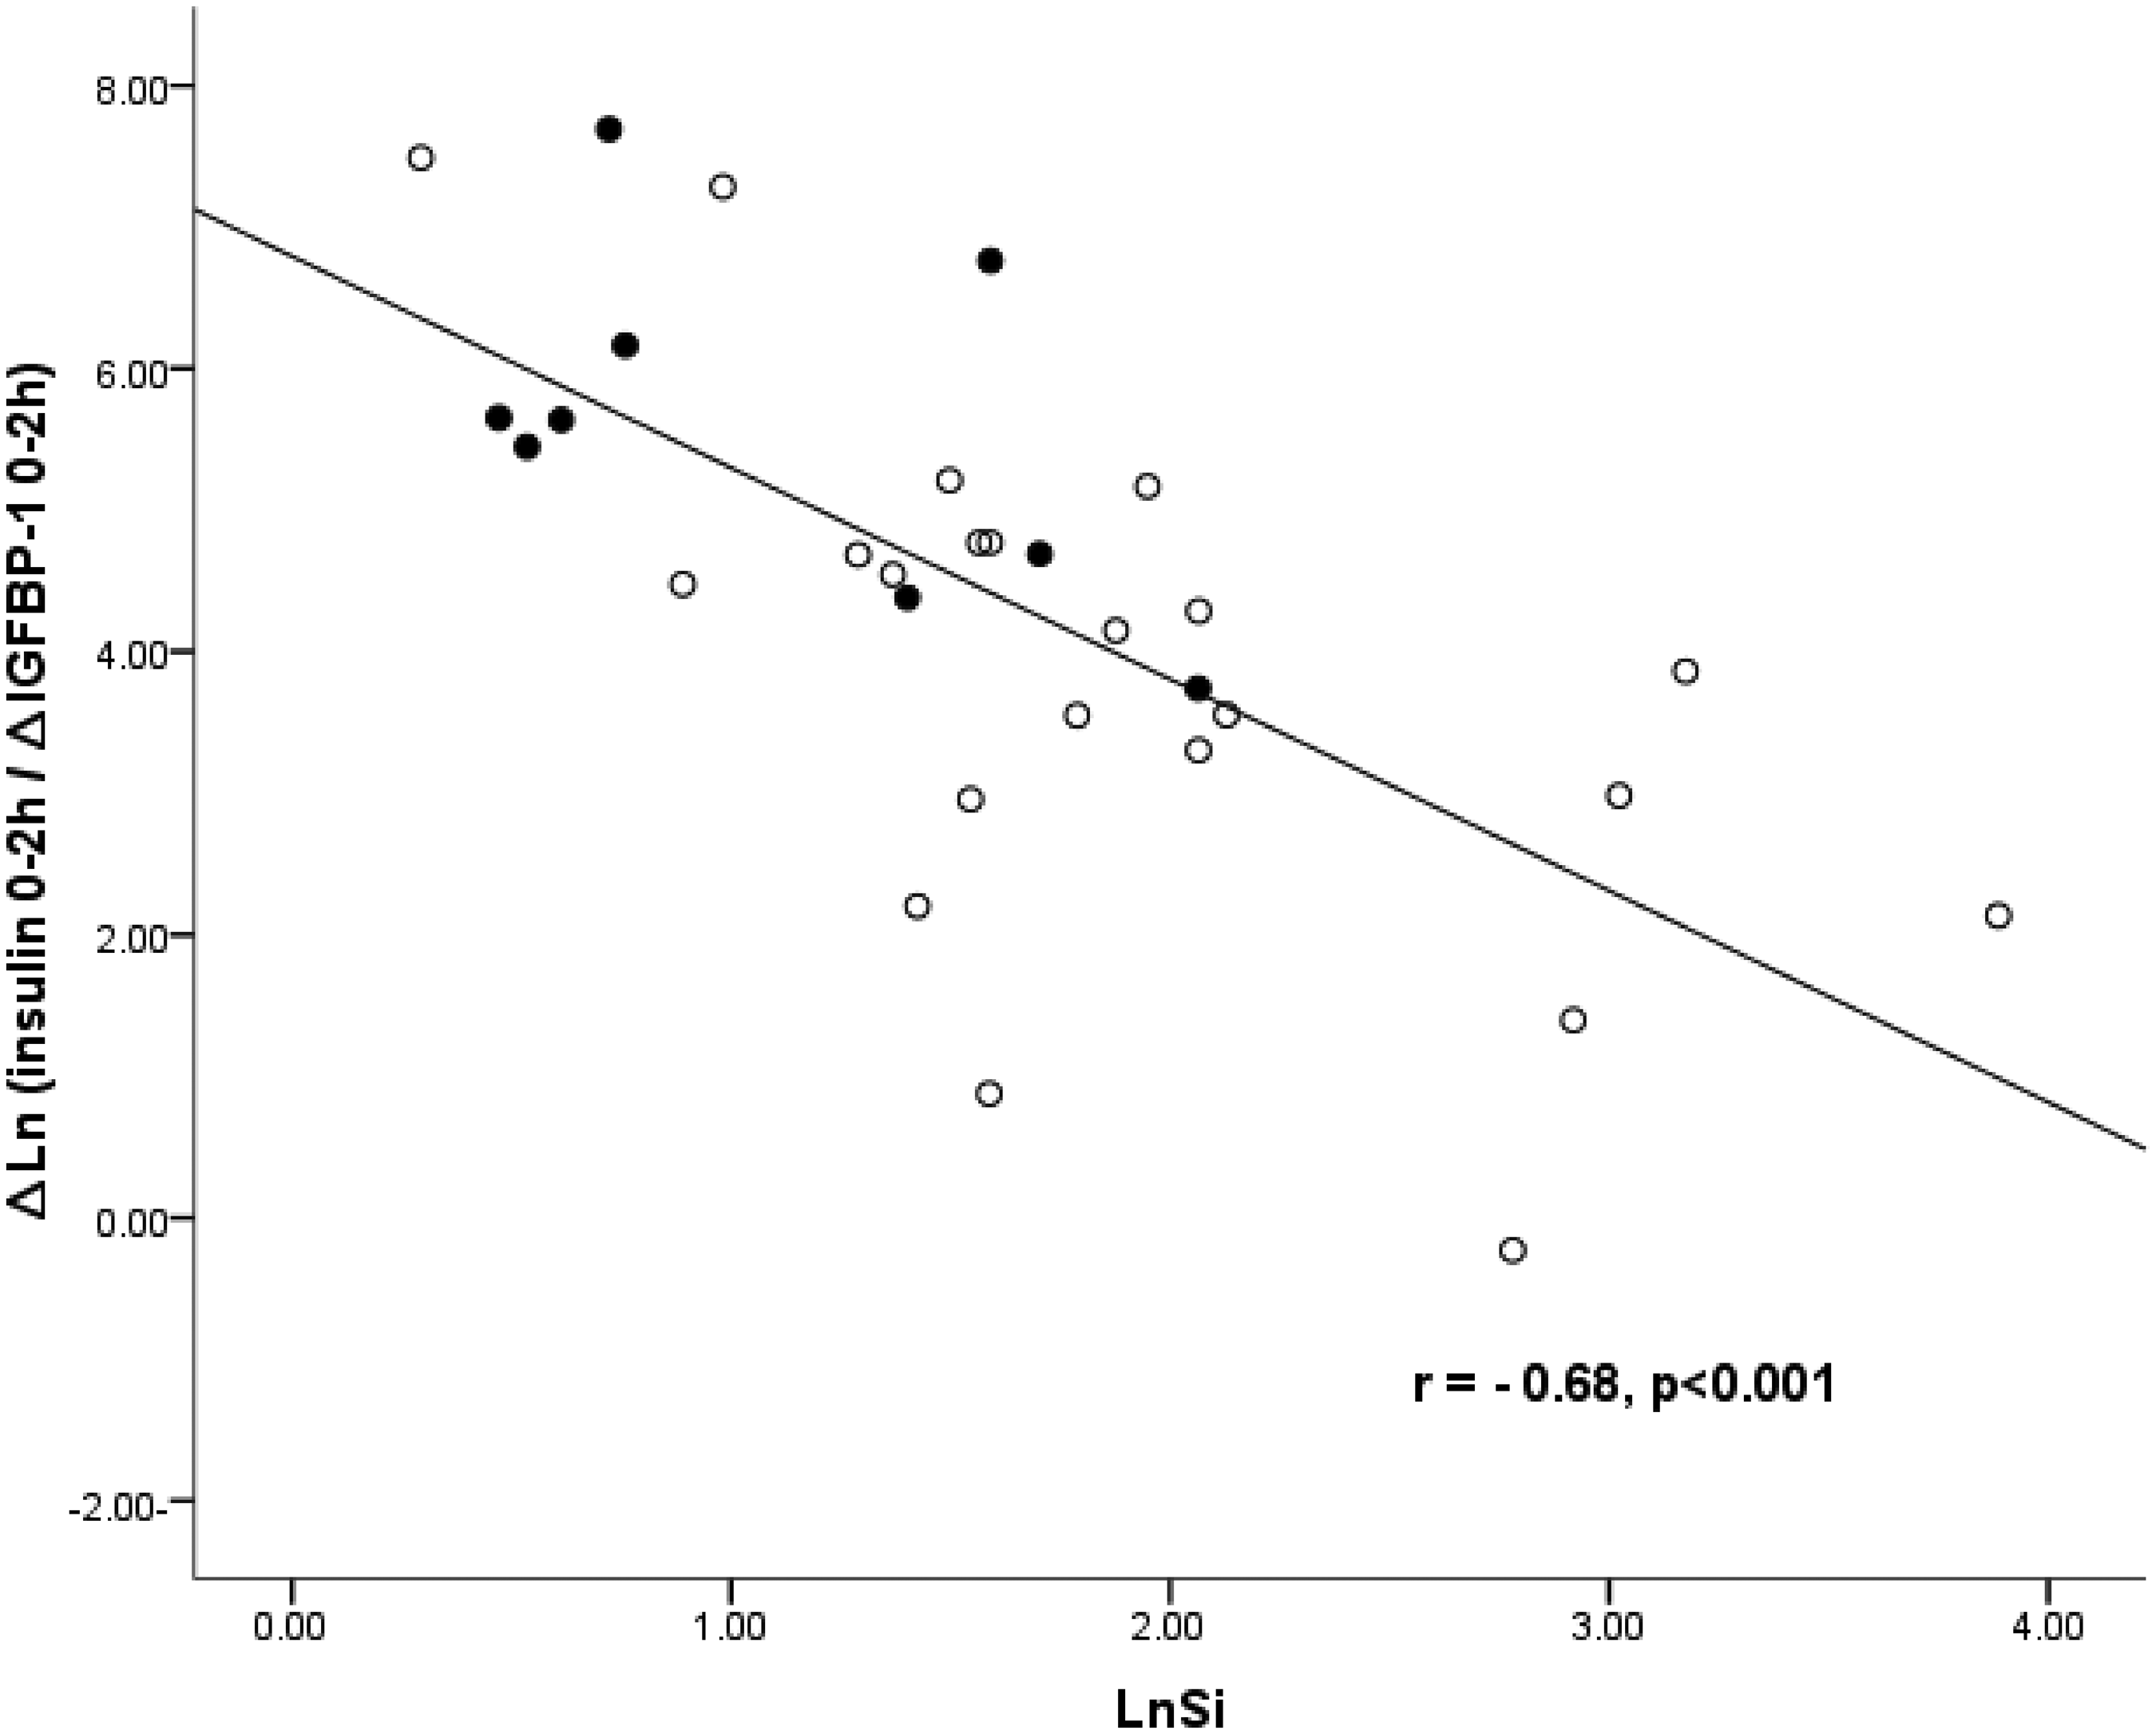
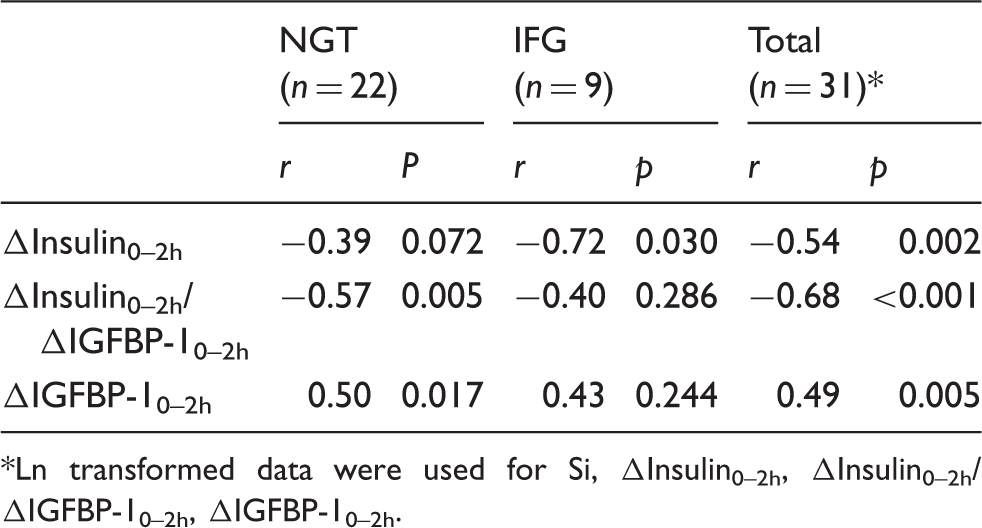
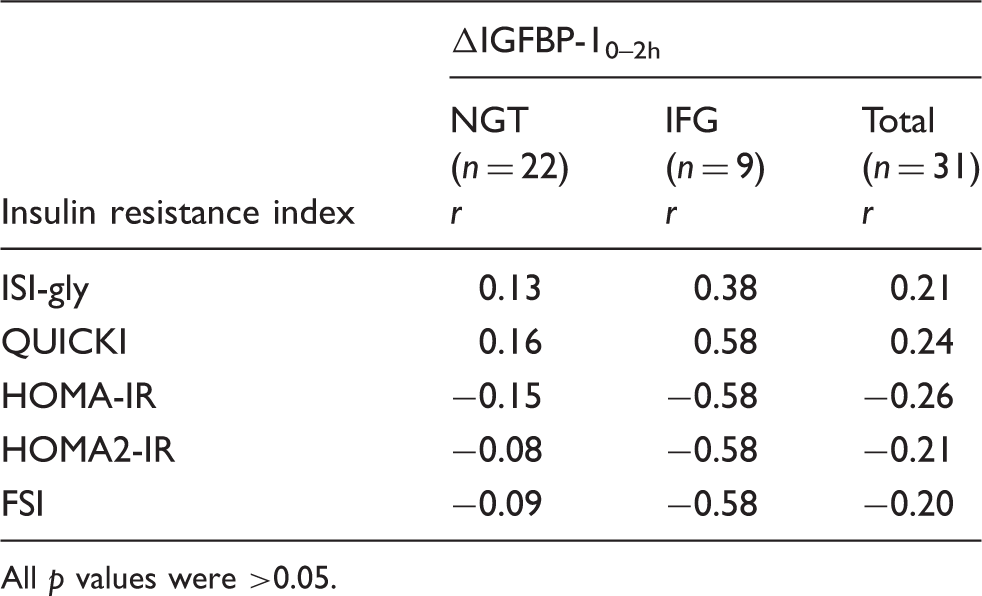
Correlation analysis of Si and the delta (Δ) dynamic indices is shown in Table 2. ΔIGFBP-10–2h correlated with Si in total subjects (r = 0.49, p = 0.005) and NGT subjects (r = 0.50, p = 0.017). In other words, the fall in IGFBP-1 was greater in insulin sensitive patients. There was no significant correlation in individuals with IFG (r = 0.43, p = 0.24), but this may relate to the small size of the IFG group. In subjects with NGT the correlation between Si and ΔInsulin0–2h/ΔIGFBP-10–2h ratio was significant (r = −0.57, p = 0.005) and in total subjects (following Ln transformation) the correlation between Si and the ratio was highly significant (r = −0.68, p < 0.001). Correlation analysis of ΔIGFBP-10–2h and simple insulin resistance indices is shown in Table 3. ΔIGFBP-10–2h did not correlate significantly with any of the other indices in any subject group. The strong positive correlation between ΔIGFBP-10–2h and Si for all subjects is shown in Figure 1 and the strong negative correlation between Si and ΔInsulin0–2h/ΔIGFBP-10–2h ratio in Figure 2.
Plot of the correlation between Si and ΔIGFBP-10–2h in all subjects after Ln transformation. The glycaemic status of subjects was normal glucose tolerance (NGT = O; n = 22) and impaired fasting glucose (IFG = •; n = 9). Plot of the correlation between Si and ΔInsulin0–2h/ΔIGFBP-10–2h ratio in all subjects after Ln transformation. The glycaemic status of subjects was normal glucose tolerance (NGT = O; n = 22) and impaired fasting glucose (IFG = •; n = 9). Correlation analysis of FSIVGTT insulin sensitivity index (Si) with ΔIGFBP-10–2h, ΔInsulin0–2h and ΔInsulin0–2h/ΔIGFBP-10–2h ratio in subjects with normal glucose tolerance (NGT), impaired fasting glycaemia (IFG) and total subjects.* Ln transformed data were used for Si, ΔInsulin0–2h, ΔInsulin0–2h/ΔIGFBP-10–2h, ΔIGFBP-10–2h. Correlation analysis of ΔIGFBP-10–2h and insulin resistance indices in subjects with normal glucose tolerance (NGT) and impaired fasting glucose (IFG). All p values were >0.05.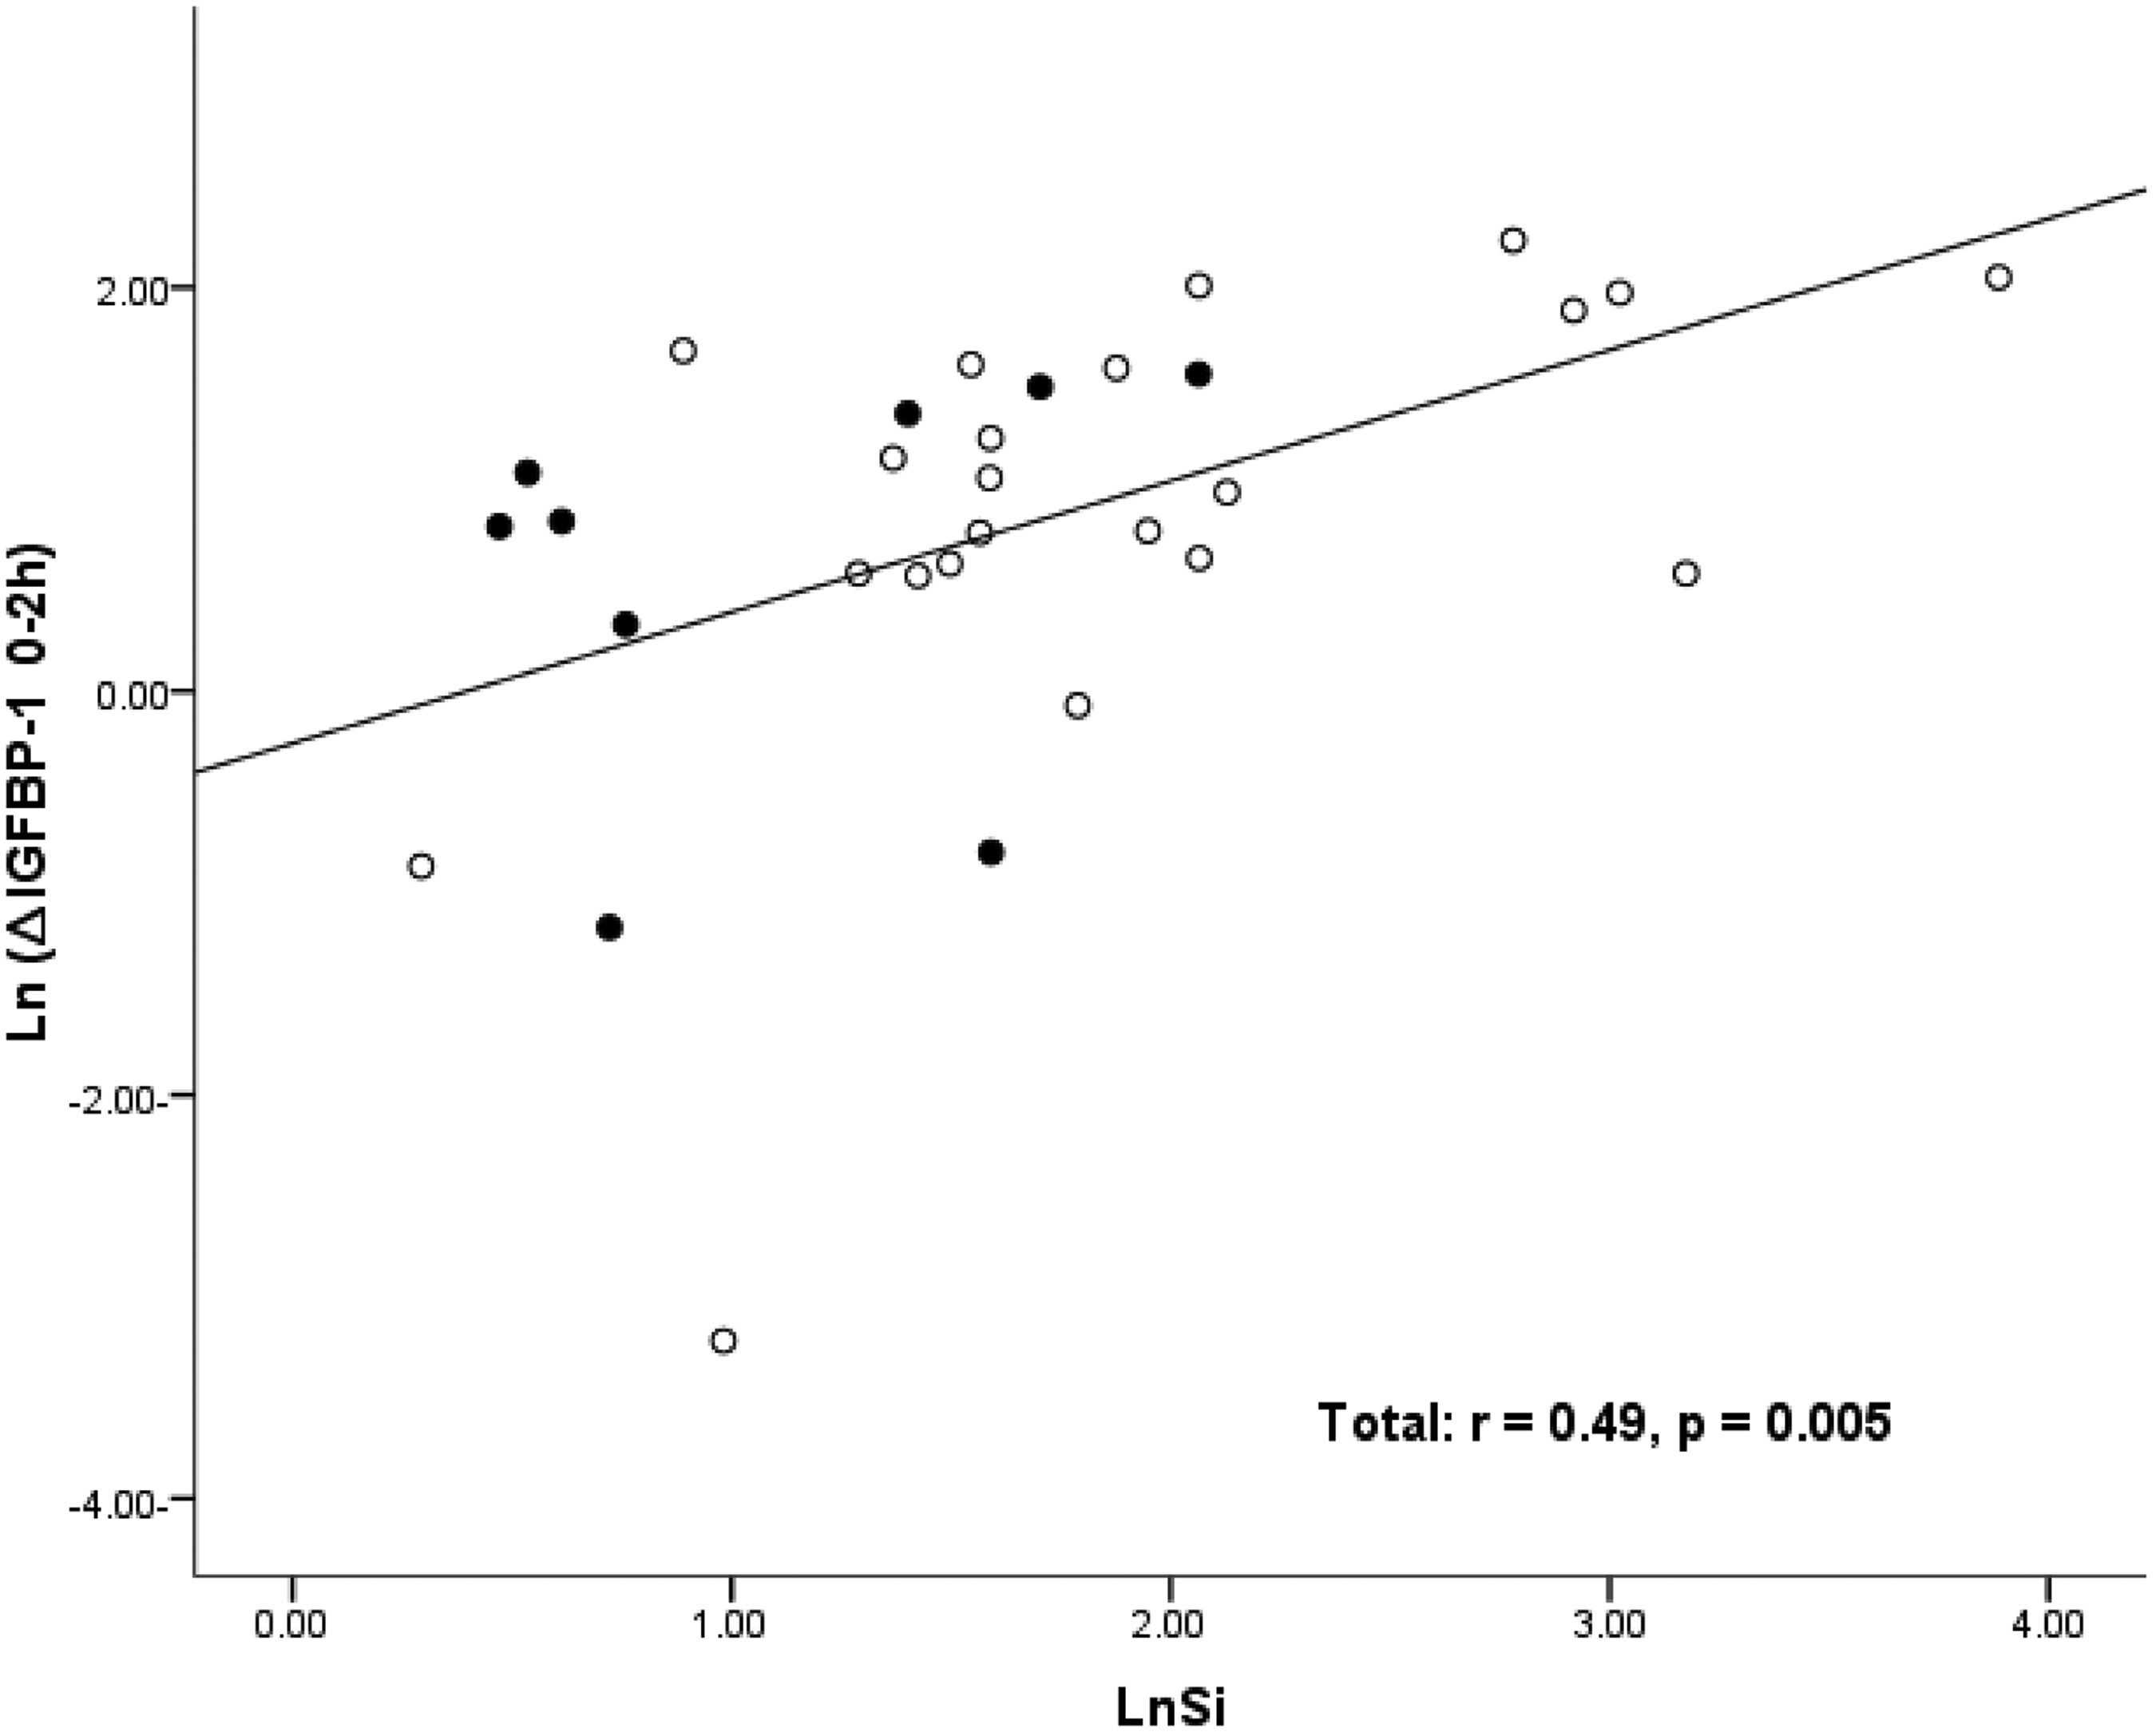
Regression analysis
Further statistical analysis was carried out in order to determine whether a fasting IGFBP-1 or ΔInsulin0–2h/ΔIGFBP-10–2h model was a stronger predictor of Si. The rationale for using the ratio (ΔInsulin 0–2h/ΔIGFBP-10–2h) in this analysis was that it had already been demonstrated to correlate more strongly with Si than ΔInsulin0–2h or ΔIGFBP-10–2h. After Ln transformation of Si, IGFBP-1, FSI (fasting serum insulin), and ΔInsulin0–2h/ΔIGFBP-10–2h, multiple linear regression analysis was used to fit the data. Two models were constructed. In the two models the Si values were used as a function of the explanatory variables for age, systolic BP, HDL-cholesterol, FSI, fasting glucose, WHR, and BMI. In each model IGFBP-1 and ΔInsulin0–2h/ΔIGFBP-10–2h were entered independently.
In model 1, IGFBP-1 was a highly significant predictor of Si (β = 0.431, p < 0.0001). This means that for every one unit increase in IGFBP-1 there is an increase of 0.431 in the predicted value of Si while other explanatory variables remain constant. In this model, the percentage of variance explained was R2 = 75.7%, F = 12.71, p < 0.001.
Multiple regression models for predictors of Si.
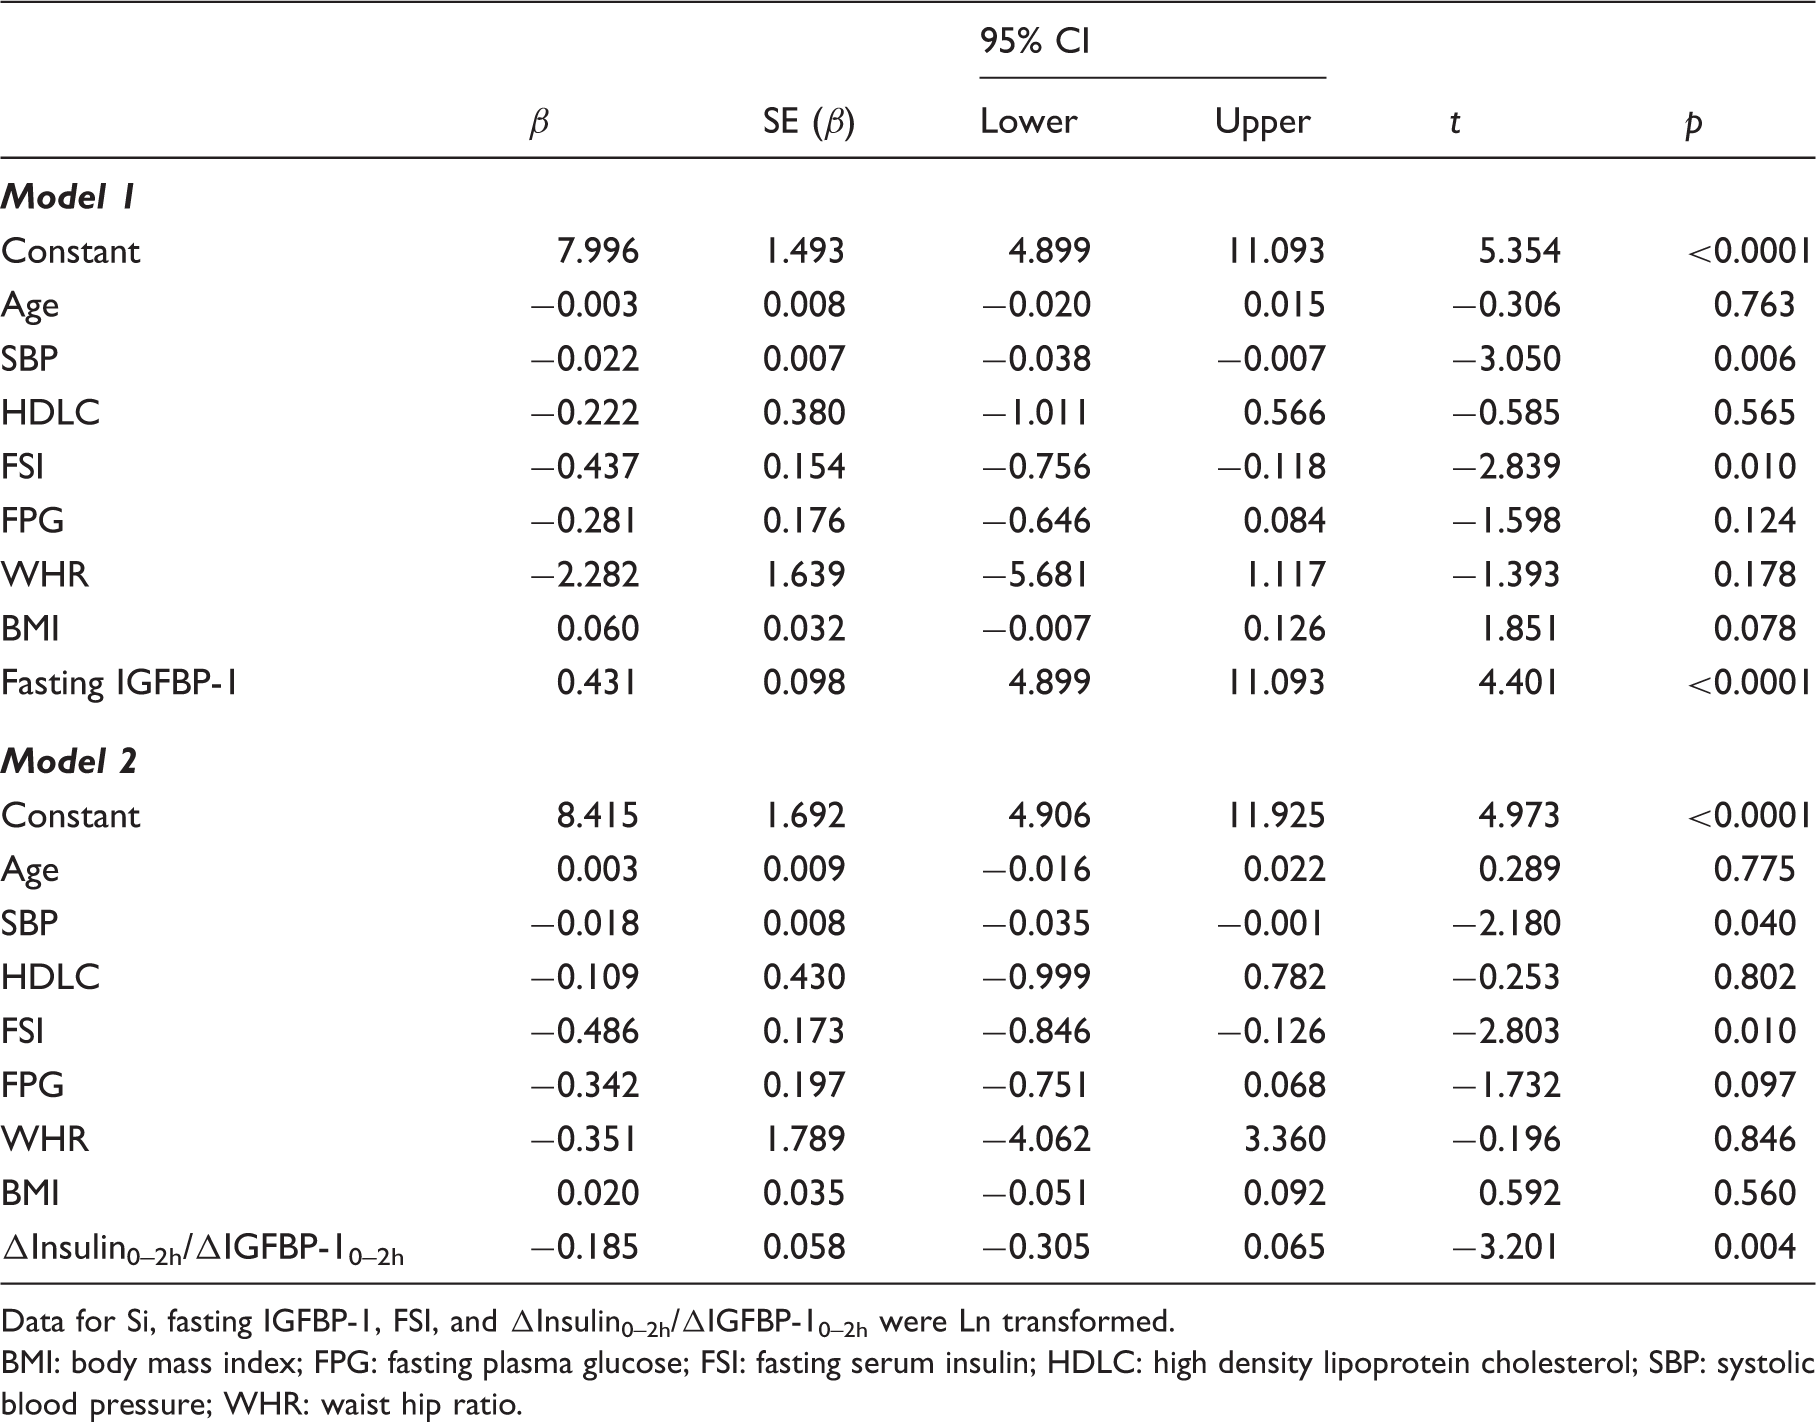
Data for Si, fasting IGFBP-1, FSI, and ΔInsulin0–2h/ΔIGFBP-10–2h were Ln transformed.
BMI: body mass index; FPG: fasting plasma glucose; FSI: fasting serum insulin; HDLC: high density lipoprotein cholesterol; SBP: systolic blood pressure; WHR: waist hip ratio.
Discussion
In studying ΔIGFBP-10–2h, we chose to confine the investigation to subjects with NGT and IFG. This was because in previous work we observed that IGFBP-1 was a poorer marker of insulin resistance in subjects with deteriorating glycaemic status, a finding that likely reflects the decline in insulin secretion, particularly in subjects with type 2 diabetes. 7 In addition, the reproducibility of serum IGFBP-1, like that of other simple indices of insulin resistance, has been reported to decline with deteriorating glucose tolerance. 14
We have demonstrated that the degree of fall in serum IGFBP-1 concentration in relation to a standard glucose load may provide additional important information about an individual’s insulin sensitivity, particularly hepatic insulin sensitivity. Although the ΔInsulin0–2h after a glucose load was much higher for IFG, ΔIGFBP-10–2h was lower than for individuals with NGT in keeping with greater insulin resistance at the liver in IFG and consequently less suppression of IGFBP-1 production post glucose load. The lack of any significant relation between ΔIGFBP-10–2h, ΔInsulin0–2h
The strong correlations between ΔIGFBP-10–2h, ΔInsulin0–2h
The independent associations observed in the multiple regression analysis between ΔIGFBP-10–2h and various features of metabolic syndrome also support the contention that it represents a marker of insulin resistance. However, the correlations are rather weaker than that between fasting serum IGFBP-1 and Si previously reported by ourselves in subjects with NGT (r = 0.79, p < 0.001). 8 As is the case for fasting serum IGFBP-1, it would be necessary to measure ΔIGFBP-10–2h and ΔInsulin0–2h in the context of a GTT if these were to be used as parameters of insulin resistance, as it would be important to demonstrate normal glucose tolerance. This is not necessarily a limitation of these indices, as their clinical usefulness, as for other simple markers of insulin resistance, is likely to be in the early stages of insulin resistance before other parameters become significantly deranged.
The absence of a significant correlation between ΔIGFBP-10–2h and other simple insulin resistance indices (Table 3) suggests that they provide different information. The present study was limited in examining IGFBP-1 levels at only two time points. Two hours may not be the optimal time for the second IGFBP-1 measurement. It could be anticipated that the correlation with the standard method would be stronger at maximal ΔIGFBP-1, i.e. at trough IGFBP-1 levels, reflecting the maximal suppressive effect of insulin. Other researchers who have derived insulin resistance indices used insulin and glucose measurements at 30 min intervals, which would be expected to be a more robust approach. 23 This is something that we plan to investigate in a further study.
In an effort to further investigate which factors best predicted Si, multivariate models were constructed using the parameters available, one including fasting IGFBP-1 and a second model including ΔInsulin0–2h/ΔIGFBP10–2h. Model one explained more of the variance, suggesting that, on the basis of the available data, fasting IGFBP-1 is a stronger predictor of Si. As above however, this assessment is limited by the possibility that 2 h is not the optimal time point for the second insulin and IGFBP-1 measurements.
IGFBP-1 has much to recommend it as a marker of insulin resistance, being less labile than insulin and therefore less subject to artefactually low results where specimen processing is delayed. ΔIGFBP-1 is worthy of further investigation as a relatively simple marker of insulin resistance in combination with ΔInsulin. When measured at different intervals following a glucose load, these indices may potentially reflect different combinations of peripheral and hepatic insulin resistance. Investigation of this would require sampling of IGFBP-1 at multiple intervals during a GTT to ascertain the optimal time for sampling. It would require comparison against the HEC using a glucose tracer to evaluate hepatic and peripheral insulin sensitivity components directly, as has been done by other researchers. 24 Given that ΔIGFBP-1 is at least in part determined by hepatic insulin resistance for a given Δinsulin, it has the potential to give important information about hepatic insulin resistance.
In summary, we propose that ΔIGFBP-10–2h, i.e. the fall in serum IGFBP-1 in the context of a GTT and the ΔInsulin0–2h
Footnotes
Declaration of conflicting interests
None.
Funding
The authors gratefully acknowledge funding support from the Saudi Government represented by the Saudi National Guard Health Affairs at King Abdullah International Medical Research Center – Western Region (KIMRC-WR).
Ethical approval
The study was approved by the South West Surrey Local Research Ethics Committee, Guildford, UK (05/Q1909/72).
Guarantor
CL.
Contributorship
All authors made a substantial contribution to this work. AB carried out the practical work, data analysis and contributed to drafting. CL contributed to study design, practical work, data analysis and drafting. AHH has an extensive background in IGF research which was crucial to data analysis in this study and contributed to drafting. YO carried out regression analysis and verification of other data analysis. GF contributed to study design, practical work and drafting.