
Abstract
Background
To assess glucose meter performance in a diabetes antenatal clinic, focussing on clinical and pre-analytical factors that might impact on the quantification of meter accuracy and precision.
Methods
The Freestyle Lite and the Performa glucose meters were assessed by trained researchers. Finger stick glucose was measured and compared with plasma venous glucose, obtained from a concomitantly collected antecubital fossa sample. Venous plasma was separated on-site then sent to the laboratory for measurement of glucose using the hexokinase method (comparative method). Additional data collected included: (i) timing of and also (ii) quantity of last carbohydrate intake; (iii) time periods between collection, preparation and analysis of the venous sample; (iv) the haemolysis index of the plasma sample and (v) haematocrit.
Results
There were 104 participants. Both meters fulfilled ISO 15197 standards, with 99% and 97% of Freestyle Lite and Performa results, respectively, falling within acceptable limits for this standard. Both meters showed minor proportional bias, reading low at higher glucose values. Consensus error grid analysis showed 100% of results from the Freestyle Lite and 99% from the Performa falling within Zone A, thus the observed differences in measured capillary and venous plasma glucose were sufficiently minor that they would have little effect on clinical action. No association was observed between [capillary-plasma] glucose difference and the five variables outlined above.
Conclusions
The two glucose meters tested showed a reassuringly acceptable level of performance, when assessed by a research team in the setting of a diabetes antenatal clinic.
Introduction
In pregnancy complicated by diabetes, an optimal fetal outcome is achieved when maternal glucose values are kept within a narrow range. 1 For many patients, glucose self-monitoring using a capillary blood glucose meter is integral to achieving these glucose targets. 1 Only a few studies have compared meter results in pregnancy with a glucose comparator or reference value, typically venous plasma glucose.2–4 One recent paper suggested that glucose meter performance in this setting is suboptimal. 4 Although these findings may reflect true limitations in meter performance during pregnancy, studies undertaken in a real-world setting are susceptible to pre-analytical error, for example in relation to delayed sample preparation.5,6 We aimed to assess meter performance at the antenatal clinic using a pragmatic design that focussed on early on-site separation of plasma, with the goal of reducing pre-analytical error associated with in vitro (test tube) glycolysis.5,6 We also explored additional factors which might impact on the difference in measured glucose values, when comparing capillary glucose meter results with the laboratory measurement of venous plasma: We recorded information on antecedent carbohydrate ingestion, as prandial status can impact on the measured [capillary-venous] difference.7,8 The haemolysis index of the venous sample was recorded, as moderate to marked haemolysis may lower measured plasma glucose. 9 Haematocrit falls during pregnancy and low haematocrit may produce a positive bias in measured glucose meter values, 7 thus the relationship between haematocrit and glucose was also assessed.
Research design and methods
Women attending the local antenatal diabetes clinic and requiring a routine blood test that included plasma glucose and a haematological test (typically full blood count) were asked to participate. In order to reduce study complexity and hence minimize the potential for pre-analytical investigator-related error, only two meters were assessed; the Freestyle Lite (Abbott Diabetes Care Inc., Alameda, CA, USA) and the Performa (Accu-Chek Performa, Roche Diagnostics, Mannheim, Germany). These meters were selected as they are widely available and also because a previous publication gives a detailed description of their performance in pregnancy complicated by diabetes. 4 The strip enzyme technology was as follows: Freestyle Lite; glucose dehydrogenase pyrroloquinoline quinone (GDH-PQQ), Performa; mutant quinoprotein glucose dehydrogenase (Mut. Q-GDH).
The venous sample for glucose estimation was collected by a dedicated antenatal clinic phlebotomist into a BD Vacutainer® PST™ Tube (plasma separator tube) containing lithium heparin plus a gel for plasma separation. The sample was then spun on-site at room temperature by a member of the research team for 15 min at 3000 revolutions per minute, using a single portable centrifuge. Centrifugation was typically commenced within five minutes of sample collection. Subsequent methodology followed that previously described in an earlier meter study. 10 Capillary finger stick samples were collected immediately after antecubital fossa venesection. Patients washed and dried their hands under supervision, immediately prior to finger stick testing. Trained research staff performed duplicate capillary sampling, using two meters of the same type. 10 The two capillary test results were then averaged for method comparison analyses (see ‘Statistical methods’ section). The four meters used during the study were rotated throughout the study. 10
The research team asked participants about the timing and content of recent food and beverage intake, including their last meal and/or carbohydrate ingestion. Carbohydrate (CHO) content was then estimated using food analysis software (Foodworks™). The CHO content of the most recent significant nutrient ingestion, defined as either a snack/beverage containing at least 10 g CHO, or the last main meal (which might have contained less than 10 g CHO), was used for this analysis.
Plasma glucose was measured in an accredited laboratory using the Abbott C8000 analyser (Abbott Diagnostics, North Chicago, IL, USA) utilizing the glucose hexokinase method. Coefficient of variation (CV) for this method is <2%. After plasma separation had occurred, samples were stored upright but otherwise processed routinely, thus transport time to the laboratory and also time between arrival at the laboratory and subsequent analysis, varied between samples. The time of analysis in relation to both sample collection and also plasma separation was recorded. Because of theoretical concerns about pre-analytical changes in glucose concentration occurring even after plasma separation, the correlation between [capillary-venous] and time to analysis was assessed. The haemolysis index was derived from the Abbott C8000 analyser (Abbott Laboratories, Chicago, IL, USA) and expressed in mg/dL haemoglobin.
Basic demographic and clinical information such as HbA1c was collected. All deviations from the study protocol outlined above were documented and added to the study database.
Statistical assessment of meter performance
There are no standards for assessment of glucose meter performance that are specific to pregnancy complicated by diabetes. 11 In the absence of specific standards, we undertook the following analyses which are standard for assessing glucose meter performance: Method comparison for venous and capillary samples included ISO 15197 and also Bland–Altman and Consensus (Parkes) error grid comparisons. 11 ISO 15197 recommends that ≥95% of individual capillary tests fall within the following limits: if the accredited laboratory glucose is >4.2 mmol/L, the discrepancy between the meter recording and the accredited laboratory result should be <20%; for glucose readings ≤4.2 mmol/L, the discrepancy should not exceed 0.83 mmol/L. 11 The number of individual samples falling within these criteria was therefore determined. We also determined the percentage of individual capillary glucose values that fell ≤15% from those obtained by the laboratory comparative method, as 1987 ADA criteria suggests that all results should fall within this range. 11
Single capillary samples were used for analyses related to ADA and ISO 15197 standards. Duplicate samples from the same brand of meter were averaged when undertaking method comparison, including error grid analyses. Additional comparisons focussing on the relationship between the absolute [capillary-venous] difference (mmol/L) and the variables that might impact on this difference, such as; (i) timing of and also (ii) quantity of last carbohydrate intake; (iii) time periods between collection, preparation and analysis of the venous sample; (iv) the haemolysis index of the plasma sample and (v) haematocrit, were undertaken using Spearman’s correlation coefficient.
Medcalc and EP evaluator 9® were used for statistical analyses. All participants gave written informed consent. This study was approved by the Upper South B Regional Ethics Committee (Ethics reference number URB/10/10/039).
Results
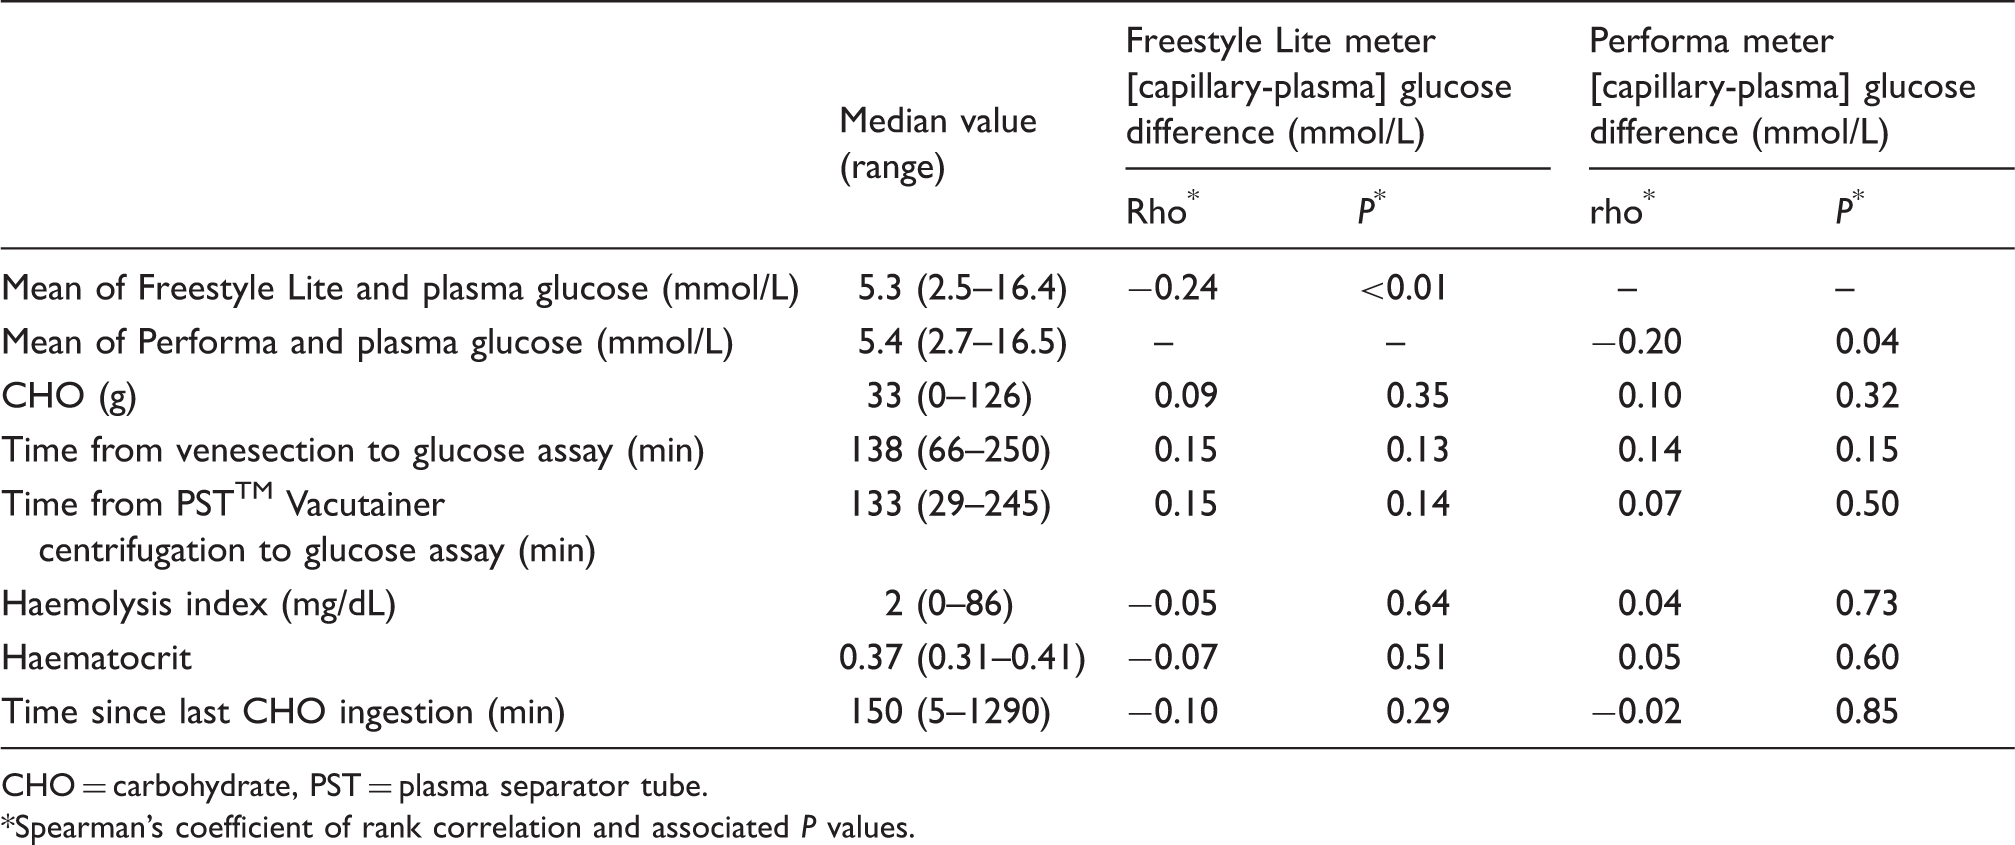
The study was undertaken between November 2010 and May 2012. Mean age (SD) of the 104 participants was 31.2 (5.4) years, median gestation was 31 weeks (range 7–38 weeks). Participants included 72 New Zealanders of European ethnicity, 20 Asian, six Maori, five Pasifika and one was from the Middle East. Diabetes diagnosis was as follows: 75 GDM (gestational diabetes), 15 pre-existing type 1 DM (diabetes mellitus), 12 pre-existing type 2 DM, 2 MODY (maturity onset diabetes of youth). Median plasma glucose was 5.4 mmol/L (range 2.5 to 17.2 mmol/L). There were 39 insulin users. An HbA1c measured on the day of visit was available on 86% of participants and only one patient had no HbA1c recorded during pregnancy. Mean HbA1c (N = 103) was 39 mmol/mol. Mean HbA1c by diabetes type was as follows: GDM 38 mmol/mol, type 1 DM 47 mmol/mol, type 2 DM 44 mmol/mol and MODY 40 mmol/mol. Median values and ranges for other variables (time from last CHO ingestion, CHO intake, sample preparation time and time to analysis, haemolysis index and haematocrit) are given in Table 1. Median carbohydrate is included as it reflects the typical carbohydrate load in this patient population. Only six participants had fasted for more than 8 h, thus the number of fasting participants was insufficient to undertake subgroup analysis by fasting status. Sample collection for 88 of the 104 participants followed study protocol. Deviations from protocol are shown in Figure 1. Subsequent statistical comparison between the samples that were and were not collected per protocol showed no statistically significant differences. Results from all 104 participants were therefore used in the analyses below. One Performa meter malfunctioned towards the end of the study and nine patients therefore had a single reading rather than paired glucose readings for this meter. Nine of the Bland–Altman and error grid values for the Performa meter therefore represent a single capillary sample, rather than the mean of two capillary samples. Multiple batches of strips were used (five for the Freestyle Lite and four for the Performa systems), to ensure that strips were within their expiry date.
Description of deviations from study protocol. Clinical and pre-analytical variables: median (range) and correlation with [capillary-plasma] glucose differences for 104 participants. CHO = carbohydrate, PST = plasma separator tube. Spearman’s coefficient of rank correlation and associated P values.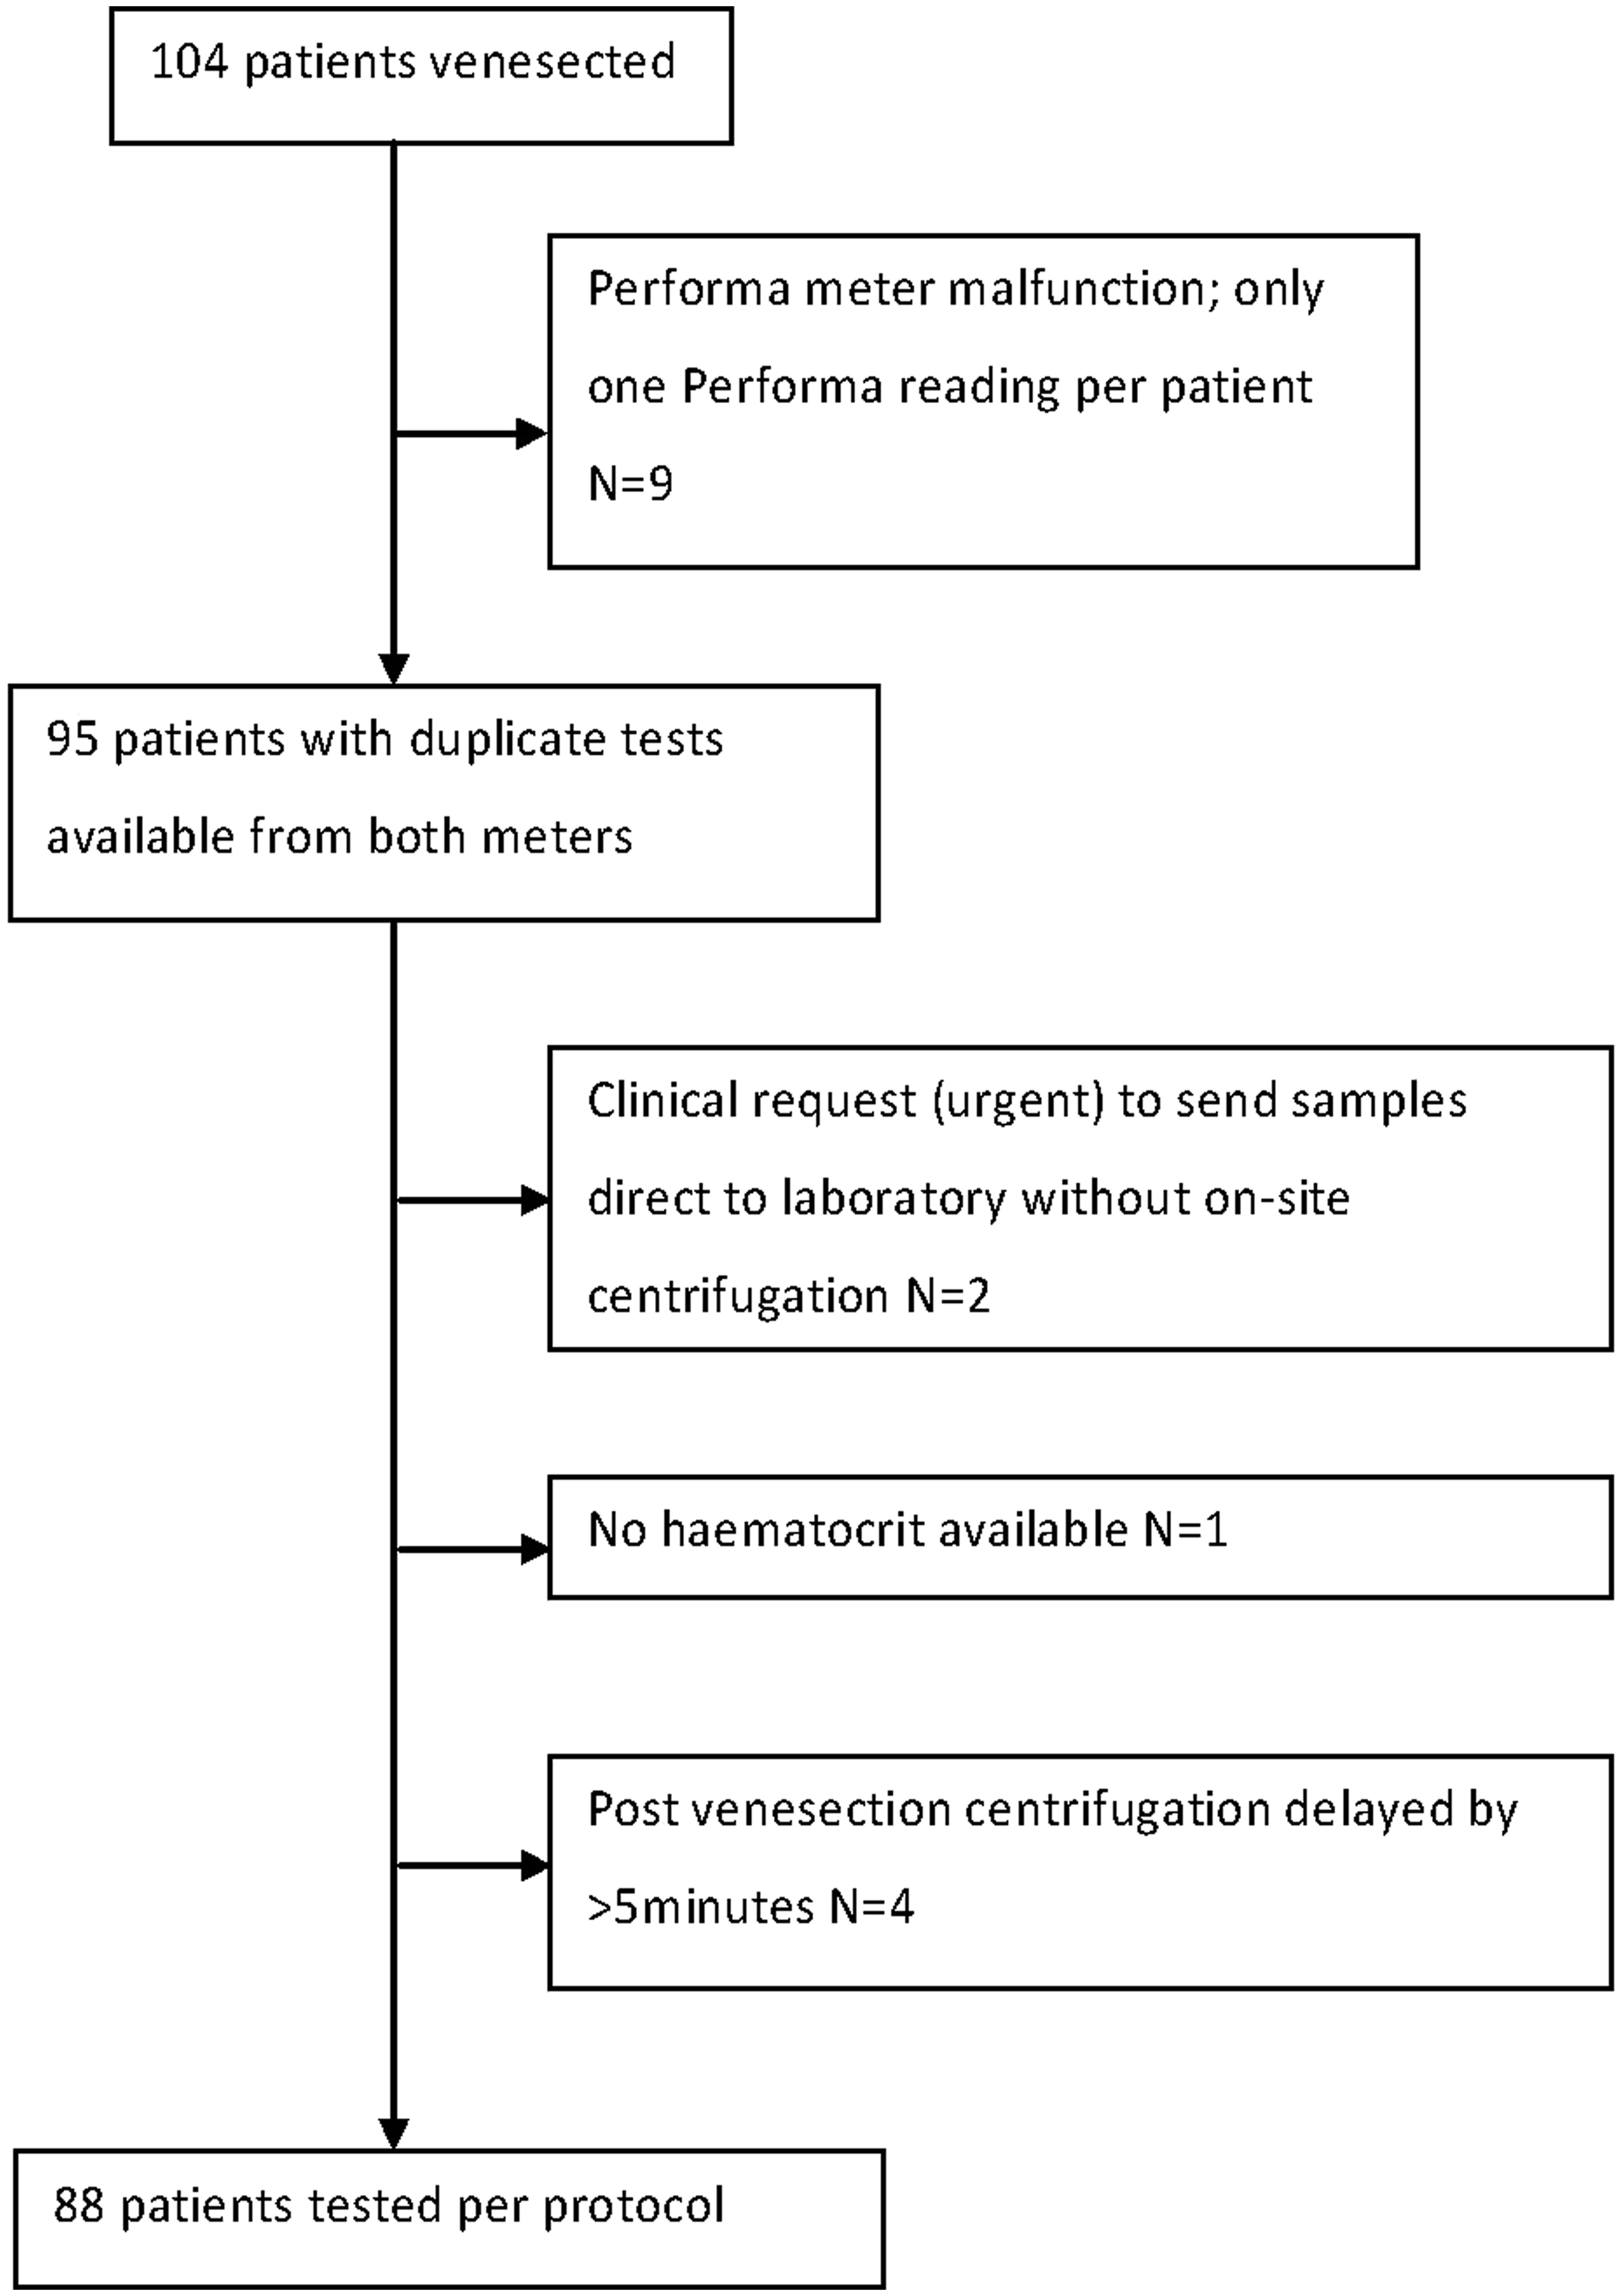
Control samples were run on each meter using the manufacturers’ high and low control solutions, prior to collecting samples from patients. These control samples were run on each of the 58 study days on which samples were collected. All meter/strip values obtained from high and low control solutions fell within the manufacturers’ recommended meter performance range. Inter-day precision was assessed using results from these control solutions for the two meters of each type. The CVs for the control solutions were as follows: for the two Freestyle Lite meters, low control 4.1% and 6.2%; high control 4.3% and 4.3%. For the two Performa meters, low control 3.6% and 3.8%; high control 2.3% and 1.9%. The CVs of the paired capillary results obtained from a single patient using two meters of the same type were also calculated. For the Freestyle Lite the mean CV obtained from the 104 patients with duplicate samples was 4.6% and for the Performa it was 3.1% from 95 duplicate samples.
Using ISO 15197 criteria, which requires that 95% of results fall within predefined levels of agreement compared to the reference glucose (see ‘Methodology’ section), 99% (207 out of 208) of individual results for the Freestyle Lite meter and 97% (191 out of 197) of Performa results fell within the levels of agreement. If however the more stringent 1987 ADA criteria are applied, results are as follows: for the Freestyle Lite 10% (21/208) and for the Performa 8% (16/197) of results show more than 15% different from the reference value, when the ADA goal is for all results to fall within this level of agreement.
Figure 2 shows Bland–Altman plots for the absolute [capillary-venous] difference against mean glucose ([capillary + venous plasma glucose] ÷ 2), for each of the two meters. Spearman’s coefficient of rank correlation and associated P values for these comparisons are shown at the top of Table 1. The Bland–Altman plots in Figure 2 also show the 95% (±1.96 SD) limits of agreement for the [capillary-venous] difference. These limits of agreement are however influenced by the negative bias in capillary glucose measurement that was attributable predominantly to a few results with higher glucose values. In order to be able to compare directly, results from the current study with those of Perera et al.,
4
who studied patients with venous plasma glucose concentrations <10 mmol/L and presented Bland–Altman plots as plasma glucose against the absolute [capillary-venous] difference, we recalculated the Bland–Altman plots using this methodology, including only those patients (N = 99) with a venous plasma glucose <10 mmol/L range. Recalculated limits of agreement (with results from Perera et al.’s,
4
study given in parenthesis) were as follows: for the Freestyle Lite they were 0.49 to −1.09 mmol/L (1.6 to −1.2 mmol/L). For the Performa they were 0.81 to −0.79 mmol/L (1.5 to −0.8 mmol/L). Thus the limits of agreement from Perera et al.’s
4
study tended to be wider and also to show a positive bias, when compared to the current study.
(a) and (b) Results for the Freestyle Lite meter and (c) and (d) results for the Performa meter. Bland–Altman plots (a and c) show the 95% (±1.96SD) limits of agreement for the [capillary-venous] difference. Interpretation of Consensus grid analysis (b and d) is as follows: Region A = no effect on clinical action and Region B = altered clinical action, but little or no effect on clinical outcome.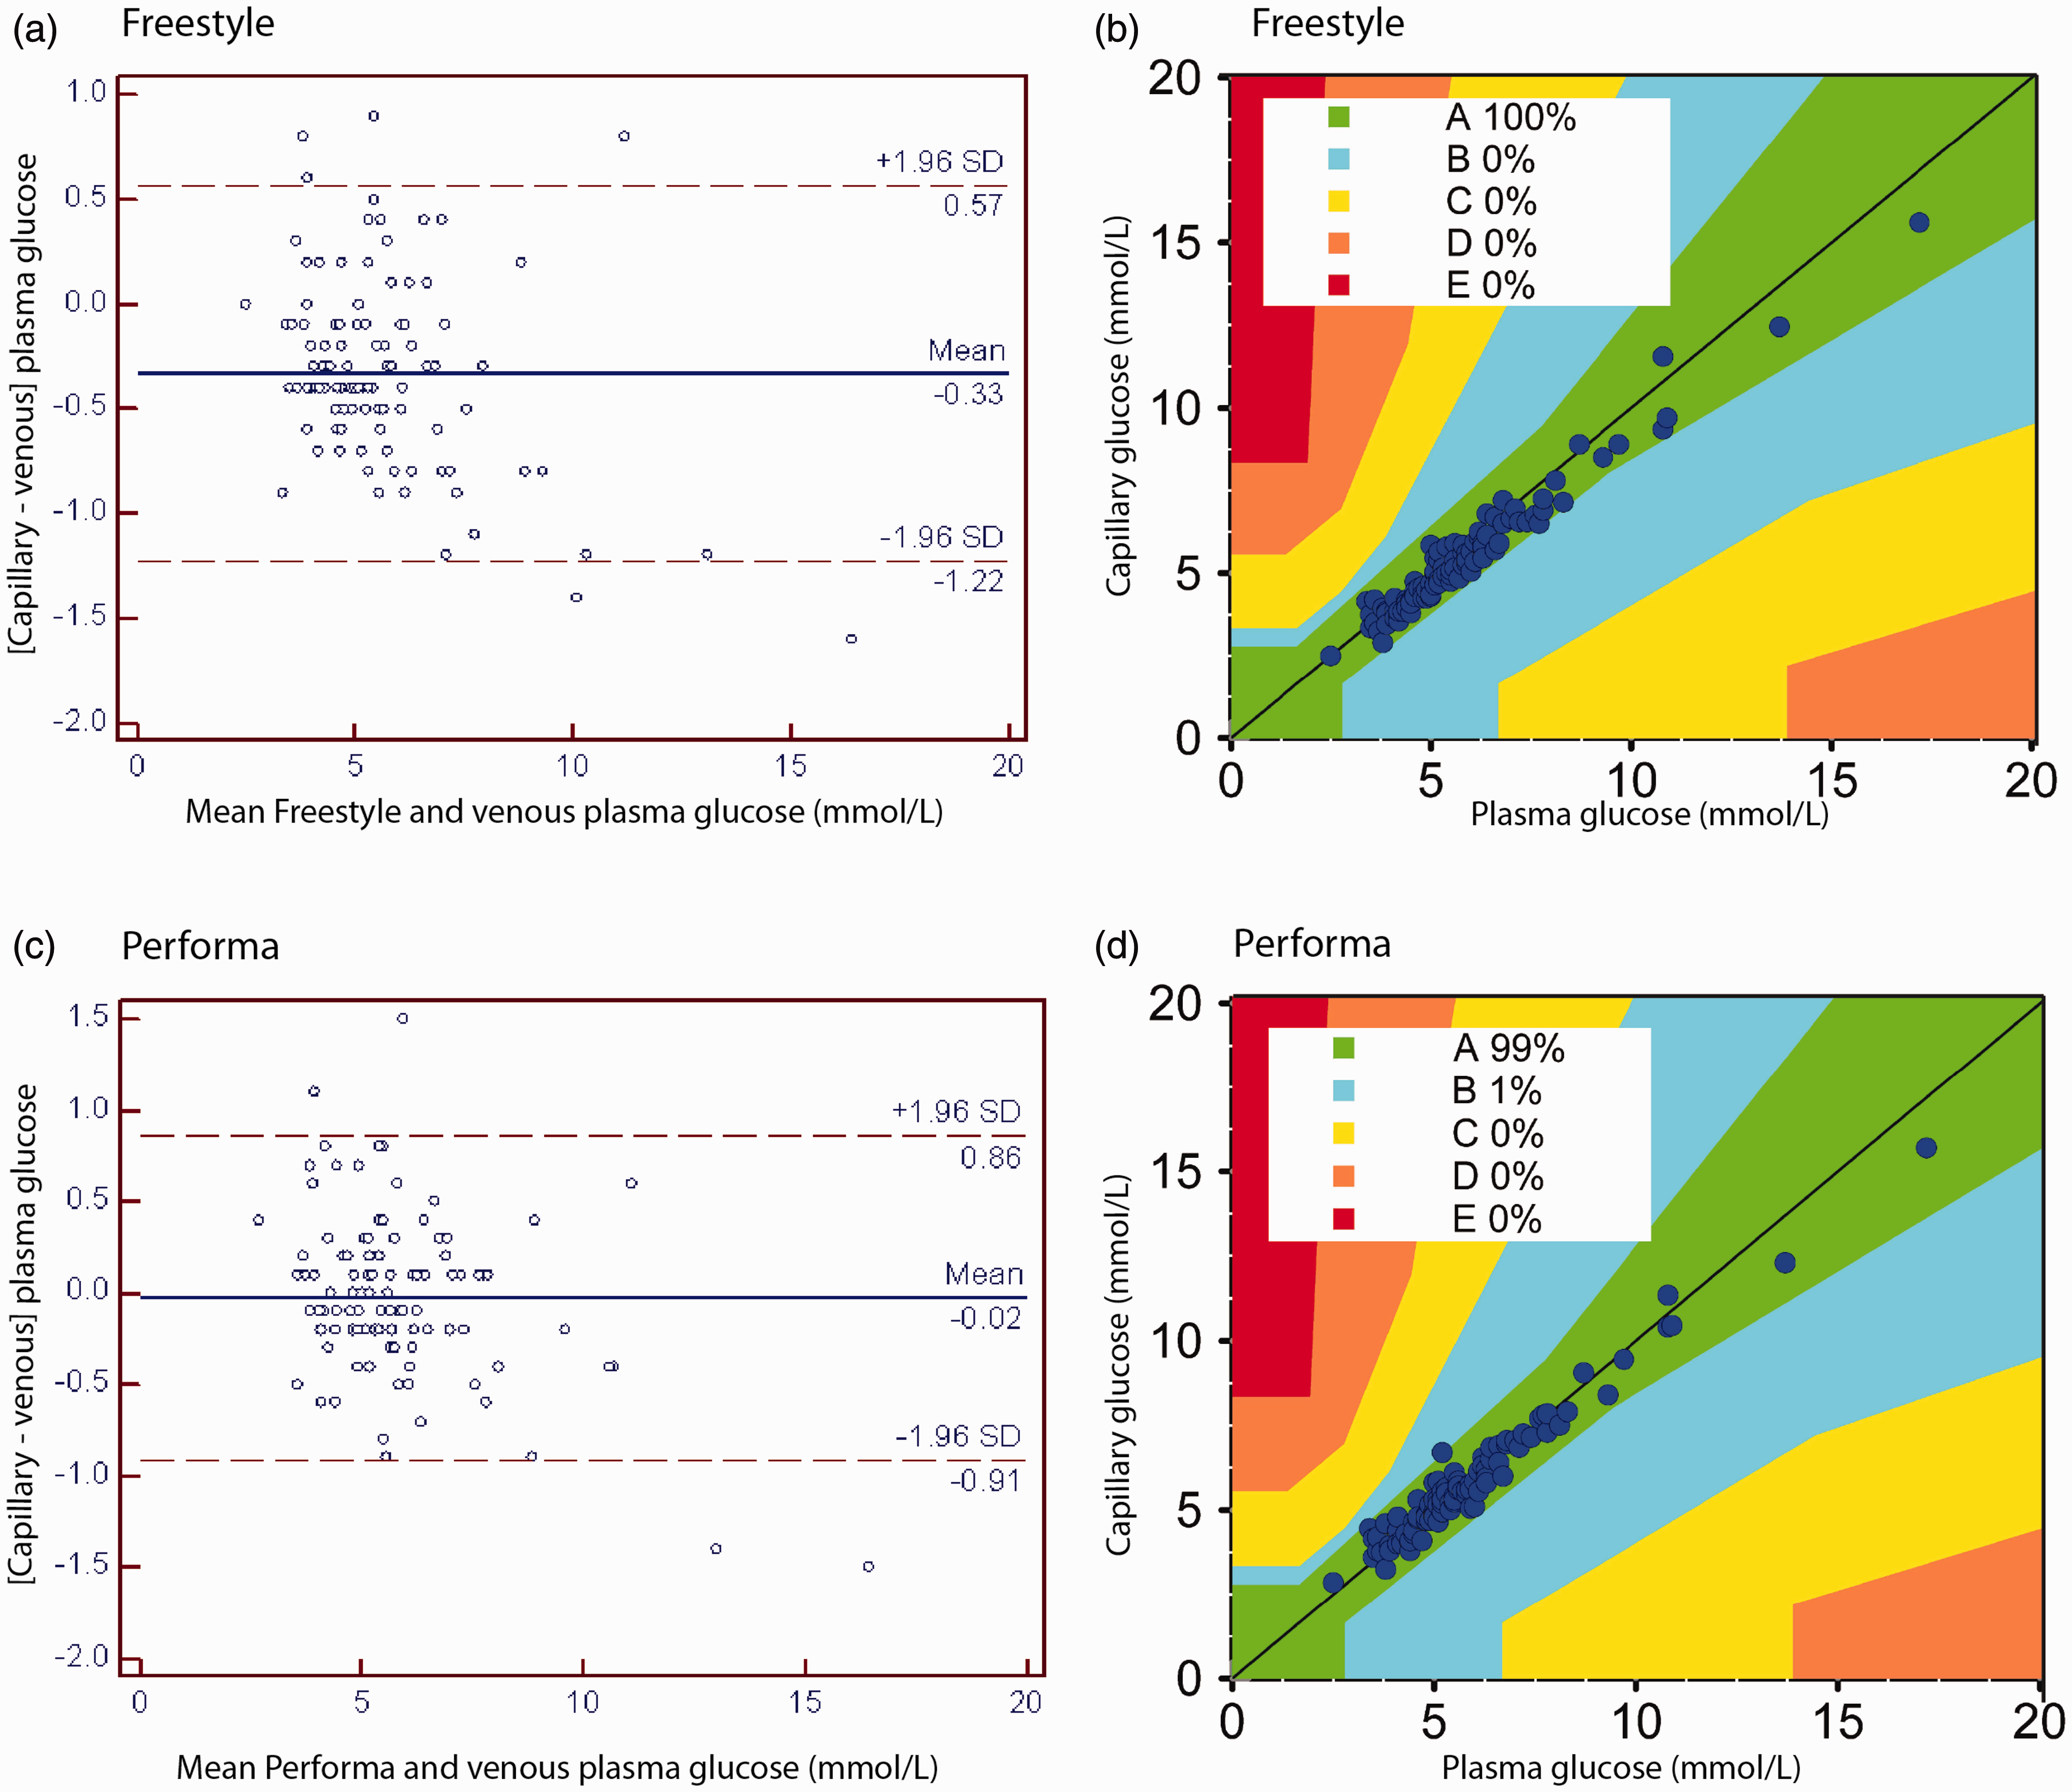
Figure 2 also shows Consensus grid analyses. All Freestyle Lite results fell within Zone A (no effect on clinical action). One Performa result fell in Zone B (altered clinical action but little or no effect on clinical outcome). Analysis was also undertaken according to the earliest version of the error grid as developed by Clarke (11), to allow comparison with previously published studies. Although most results remained in Zone A, one result for the Freestyle Lite fell in Zone D (significant medical risk; plasma glucose 3.4 mmol/L, corresponding capillary glucose 4.15 mmol/L). For the Performa, one result fell in Zone B and two results fell in Zone D (plasma glucose 3.4 and 3.8 mmol/L, corresponding capillary glucose 4.45 and 4.60 mmol/L respectively). No results fell within Zone E (could have dangerous consequences). The associations between the [capillary-venous] difference and the predefined variables that might impact on this difference (time from last meal, last CHO ingestion, haemolysis index, time from venesection to sample preparation and assay, haematocrit) plus the mean [capillary-plasma] glucose difference are shown in Table 1. The only statistically significant finding was a negative bias seen for both meters when comparing the [capillary –plasma] glucose against mean glucose.
Conclusions
In the current study, both the Freestyle Lite and the Performa meters showed clinically acceptable accuracy and precision, when assessed in the setting of the antenatal diabetes clinic. It is difficult to make direct comparisons between results from the current study and previously published studies because of differences related both to patient specific features such as percentage of patients on insulin, glucose range. Also, there are subtle methodological differences between this and earlier studies that may in part explain differences in findings, for example advances in strip enzyme technology and differences in sample preparation. However, when considering analyses that are common to both this paper and that of Perera et al.’s, 4 there are some differences in findings that are worth commenting on. The 95% limits of agreement on Bland–Altman analysis are wider in the previous study. Clarke error gird analysis in Perera et al.’s 4 study showed multiple results falling within Zones B, C and even D, which might result in dangerous treatment-related decisions. In the current study almost all results fell within Zone A (no effect on clinical action). It is also noted that current results are broadly similar to those reported in non-pregnant diabetic patients for both the Freestyle Lite and also Performa meters.10,12
We recently demonstrated a relationship between fasting and postprandial [capillary-venous] glucose differences in healthy volunteers, when measuring capillary glucose with the two types of glucose meters used in this study. 8 We were therefore interested to determine whether, in the setting of the diabetes antenatal clinic, the observed [capillary-venous] glucose differences would also be dependent on antecedent nutritional intake, i.e. fasting versus non-fasting status and also CHO load. No such relationship was observed, however many of the women studied suffered pregnancy-related nausea with reduced appetite, which may explain the observation that the ingestion of a high CHO load was uncommon (median CHO load 33 g). Also, the local dietary recommendation for pregnancy complicated by diabetes is for small, frequent meals, minimizing large CHO loads. Thus at the time of study participation during a routine clinic visit, participants were predominantly non-fasting and not subject to large CHO loads. In addition, participants’ assessments of their last carbohydrate intake were made retrospectively at the time of clinic visit, thus may have been susceptible to recall bias. Studies in different nutritional settings may therefore produce different findings.
This study has several limitations. Only two meters were studied and the generalizability of study findings to other meters is unknown. The capillary samples were collected and measured by trained researchers rather than self-measured by patients, thus the impact of pre-analytical error related to patients’ sampling errors is unknown. Although this study aimed to minimize pre-analytical error, sources of pre-analytical error will inevitably remain. For example optimal venous sample preparation might include immediate refrigerated centrifugation of the venous sample but this was impractical in the setting of the antenatal clinic. Thus, if this study had been undertaken in a more controlled research clinic environment, it is possible that measured meter performance would appear better than that seen in the current study. However, there may be perceptions of ethical and clinical risk associated with enrolling pregnant women into a formalized clinical study in a research setting, 13 which currently preclude this approach. There were several deviations from protocol (see Figure 1), which inevitably occur in real-world situations. These deviations are unlikely to have had any significant impact on the observed meter performance.
In conclusion, the finding of the current study gives pregnant women with diabetes some reassurance that the Freestyle Lite and the Performa meters, when assessed in the setting of the diabetes antenatal clinic, perform to a standard that is both clinically acceptable and also similar to that seen in non-pregnant diabetes outpatients.
Footnotes
Acknowledgements
We thank Yvonne Sheenan for her excellent phlebotomy skills and Helen Heenan for her help with database management. We also thank Vanessa Buchan and her co-workers at Canterbury Health Laboratories for their logistic support. We are grateful to the staff at Christchurch Womens Hospital antenatal diabetes clinic for allowing us to undertake this study in their clinic.
Declaration of competing interests
HL and CMF having undertaken glucose meter assessments on behalf of the New Zealand government agency, PHARMAC.
Funding
The study was funded by a grant from the New Zealand Society for the Study of Diabetes. MP was supported by a University of Otago Summer Student grant sponsored by the Diabetes Training and Research Trust.
Ethical approval
This study was approved by the Upper South B Regional Ethics Committee (Ethics reference number URB/10/10/039).
Guarantor
HL.
Contributorship
HL, MP, FL, LI and MPM designed the study. MP and FL collected data. CP analysed dietary data. CMAF reviewed the statistical protocol and oversaw the statistical analysis. CMF oversaw laboratory analysis and undertook statistical analyses. HL wrote the article and guarantees the paper. All authors contributed to the discussion and reviewed the manuscript.