
Abstract
The analytical performance of a compact infrared attenuated total reflection spectrometer using a pyroelectric detector array has been evaluated and compared to a conventional laboratory Fourier transform infrared system for applications in food analysis. Analytical characteristics including sensitivity, repeatability, linearity of the calibration functions, signal-to-noise ratio, and spectral resolution have been derived for both approaches. Representative analytes of relevance in food industries (i.e., organic solvents, fatty acids, and mycotoxins) have been used for the assessment of the performance of the device and to discuss the potential of this technology in food and feed analysis.
This is a visual representation of the abstract.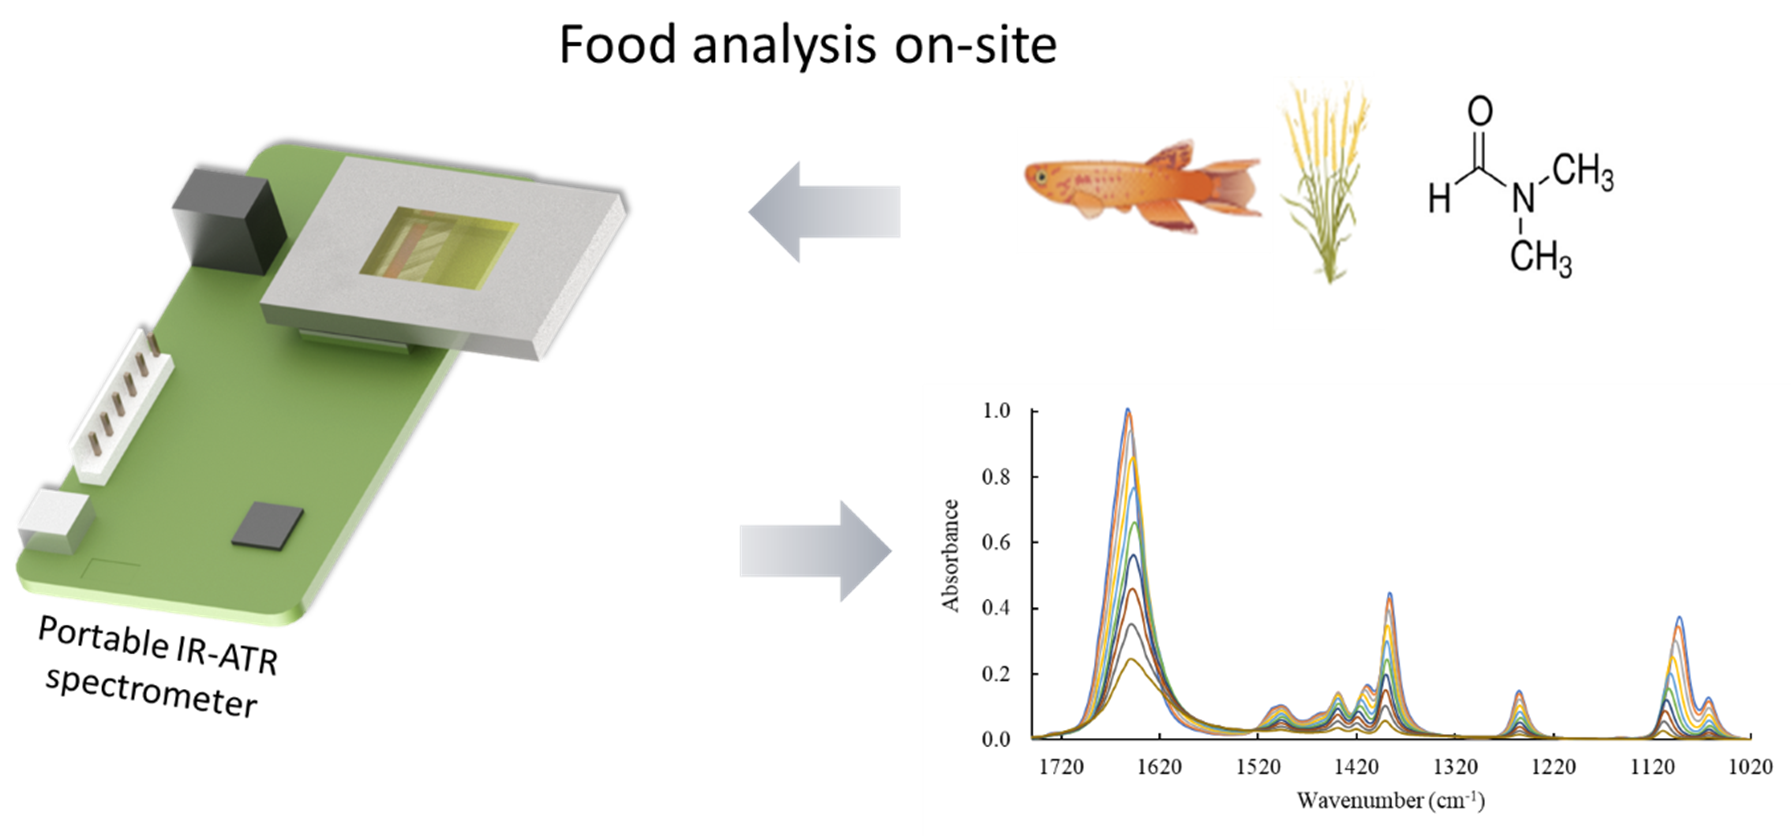
Keywords
Introduction
Mid-infrared (MIR) spectroscopy (2.5–25 µm) is an analytical technique that belongs to the group of vibrational spectroscopies along with near-infrared (NIR), far infrared (IR), and Raman spectroscopy. In the MIR, fundamental vibrational modes are excited providing detailed qualitative and quantitative molecular information. 1 Initially, MIR spectrometers were based on dispersive technology whereby adjacent wavelength segments were sequentially addressed via a slit and a dispersive element (i.e., grating, prism, etc.). However, dispersive spectrometers are characterized by extended measurement times due to the inherently sequential interrogation of wavelength segments, radiation throughput limitations due to the slit, and limited absolute wavelength precision due to the absence of a reference signal.2–4
Fourier transform IR spectroscopy (FT-IR) spectrometers are superior to dispersive instruments owing to throughput and multiplex advantages. The throughput advantage is achieved by eliminating the need for a slit allowing for an overall increased transmission of radiation, while the multiplex advantage enables the simultaneous observation of all wavelengths. Nonetheless, it is important to note that IR measurements in general are frequently constrained by detector noise.3,5
As an alternative to using broadband light sources, the introduction of suitable semiconductor lasers, and in particular devices based on quantum heterostructures such as interband cascade lasers and quantum cascade lasers (QCLs), has added additional tailorability to MIR spectroscopy devices. 6 Shortly after their operational demonstration in 1994, the first broadly tunable QCLs became available offering several advantages over conventional FT-IR spectrometers.7–9 QCLs are coherent and polarized IR radiation sources with high spectral power density and tunable across >300 cm–1. Spectrometers based on tunable QCLs do not require additional wavelength selection facilitating even fingertip-sized sensing systems.10,11 Besides their benefits, QCLs are subject to inherent noise given the operation principles, which is not the case for conventional thermal emitters.12,13 Hence, real-time referencing is recommended especially during pulsed operation including strategies such as balanced detection schemes.14–17 Otherwise, QCL-based devices have proven to be an attractive alternative to conventional FT-IR; however, the instrumental investments remain substantial.
In the present study, we take advantage of an alternative concept toward lower-cost MIR sensor technology combining a broadband thermal source with pyroelectric detector arrays and linear variable filters. 18 This spectroscopic platform provides a low-cost alternative versus FT-IR and QCL spectrometers at an analytical performance suitable for a wide range of application scenarios. The device used herein encompasses a microelectromechanical (MEMS) thermal light source with an attenuated total reflectance (ATR) waveguide and a pyroelectric line array detector (PLAD) made from lead zirconium titanate with a linear variable filter (LVF) for wavelength discrimination. This combination enables a compact portable MIR spectrometer package without any moving parts established since 2008.18–20 An appropriate selection of the LVFs enables tailoring the system for the MIR spectral window of interest. 21 As no slit is required, the entire emitted IR radiation propagates through the ATR element and is guided toward the PLAD resulting in rapid spectra acquisition times. 22 However, it should be noted that this type of spectrometer is characterized by limited radiation throughput due to the filter design, i.e., LVFs selectively transmit only “quasi-continuous” segments of the spectrum along their spatial dimension adapted to the dimensions of the underlying detector array. Another limitation to consider is the limited and variable spectral resolution across the detected wavelength band of approximately 10–30 cm–1.23,24 In a study conducted by Wiesent et al., 25 the use of MIR emitters and LVFs in conjunction with PLAD was explored to monitor oil conditions. The authors emphasized that while the resolution of the compact spectrometer was lower compared to FT-IR, it still provided the capability to accurately predict specific parameters such as oxidation and total base number (TBN). In fact, the predictive performance of the compact spectrometer indeed matched that of the FT-IR approach, as evidenced by R2 values of 0.972 and 0.984 for oxidation and TBN, respectively. 25 Thus, a wide variety of analytical applications, especially when analyzing liquid or solid samples, that do not require a high spectral resolution may benefit from such devices, as in the presently investigated scenario focused on food quality and safety.
In recent years, IR attenuated total reflection (IR-ATR) spectroscopy in general has evolved into an increasingly relevant analytical tool in food industries for quality control and for the determination of contaminants (e.g., for screening mycotoxins in corn, wheat, nuts, fruits, etc.).18,26–30 IR-ATR spectroscopy enables the acquisition of evanescent field absorption spectra with minimum or no sample preparation at all and facilitates the nondestructive analysis of analytes in any aggregate state.1,31 Herein, we introduce a portable IR-ATR device suitable for food analysis demonstrating its capabilities for a relevant group of analytes demanded by food industries.
The fatty acid (FA) composition of lipids in fish is a key parameter in food quality.32–34 Analyzing FAs is essential, as the lipid composition is influenced by environmental factors such as water quality, capture season, temperature, and fish condition, and thus characterizes the quality of the fish.35–37 Furthermore, the FA composition is also associated with the energy balance in cow milk,38–40 rendering this parameter crucial for industries using fish or milk products. 41
Another important area in food analysis is the determination of fungal contamination and the associated harmful secondary metabolites, or mycotoxins. For example, deoxynivalenol (DON) is among the most common mycotoxins found in cereals and is produced predominantly by Fusarium graminearum and Fusarium culmorum.42–44 The detection of DON and other mycotoxins is essential for ensuring food and feed safety, as DON may induce harmful effects on human and livestock health.45–47 Hence, there is a distinct demand for methods facilitating rapid and accurate low-cost analysis of fungal contamination and mycotoxins for controlling the quality of food and feed products ideally on-site.
Last but not least, organic solvents are widely used in food industries for constituent extraction from food matrices.48,49 While green extraction methods are becoming increasingly popular,50,51 conventional approaches using organic solvents remain routine practice due to their superior performance. 52 Hence, screening for the rapid determination of organic solvents is essential. Ng et al. 53 have demonstrated the effectiveness of a compact MIR spectrometer that uses PLAD and LVF technology for analyzing organic solvents including ethanol, isopropanol, n-propanol, and methanol in various hand sanitizers. The derived partial least squares regression models exhibited comparable performance between the compact PLAD-based spectrometer and FT-IR-based devices with an R2 > 0.980. 53
In the current study to demonstrate the potential of a handheld IR-ATR device, representative examples of organic solvents, FAs, and mycotoxins in liquid environments were selected. It should be noted that the main aim of the present work was to benchmark the analytical performance of a low-cost compact IR-ATR system versus conventional laboratory IR-ATR spectroscopy using an FT-IR spectrometer demonstrating its utility for future in-field quality control of food and feed items.
Materials and Methods
Reagents
Model systems including N,N-dimethylformamide ((CH3)2NCH) (DMF) dissolved in water, stearic acid (C17H35CO2H) in ethanol, and DON (C15H20O6) in methanol have been selected for preparing calibration solutions to benchmark the IR-ATR instrument. The analytes were chosen so that they represent the highlighted classes of compounds and have characteristic bands in the MIR spectrum.
N,N-dimethylformamide (DMF) anhydrous 99.8% (Sigma-Aldrich Ltd), stearic acid (Honeywell International Inc.), DON (LGC Standards GmbH), ethanol absolute (VWR International Ltd), methanol (Merk KGaA), and deionized water (deionized with Purelab flex, VWS Ltd) have been used as reagents.
Sample Preparation
N,N-Dimethylformamide in Water (10–100 g/L, 100–1000 g/L)
For DMF calibration solutions, two concentration ranges have been selected: “high” (100–1000 g/L) and “low” (10–100 g/L). It is known that Beer–Lambert law has limitations at high concentration levels. 54 In the case of high concentrations, 25 mL of pure DMF was used as a stock solution, which was diluted with water to obtain calibration standards with concentrations in the range of 1000–100 g/L. In the case of low concentrations, 25 mL of 100 g/L DMF stock solution prepared by dissolving 2.5 mL of DMF in water was used for further dilution. After diluting the stock solution, calibration solutions in the range of 10–100 g/L were prepared.
Stearic Acid in Ethanol (0.10–1.00 g/L)
A stock solution with a concentration of 1 g/L has been prepared to dissolve 0.25 g of stearic acid in 250 mL of ethanol. The stock solution was diluted to obtain calibration solutions within the concentration range of 0.10–1.00 g/L.
Deoxynivalenol in Methanol (0.050–0.500 g/L)
A stock solution with a concentration of 1.5 g/L was prepared dissolving 2.25 mg of DON in 1.5 mL of methanol. The stock solution was diluted to obtain calibration solutions within the concentration range of 0.050–0.500 g/L.
Calibration functions at different concentration ranges have been established for these model systems to calculate the analytical figures-of-merit including limit of detection (LOD), limit of quantification (LOQ), standard deviation (SD), and relative SD (RSD).
Portable IR-ATR System
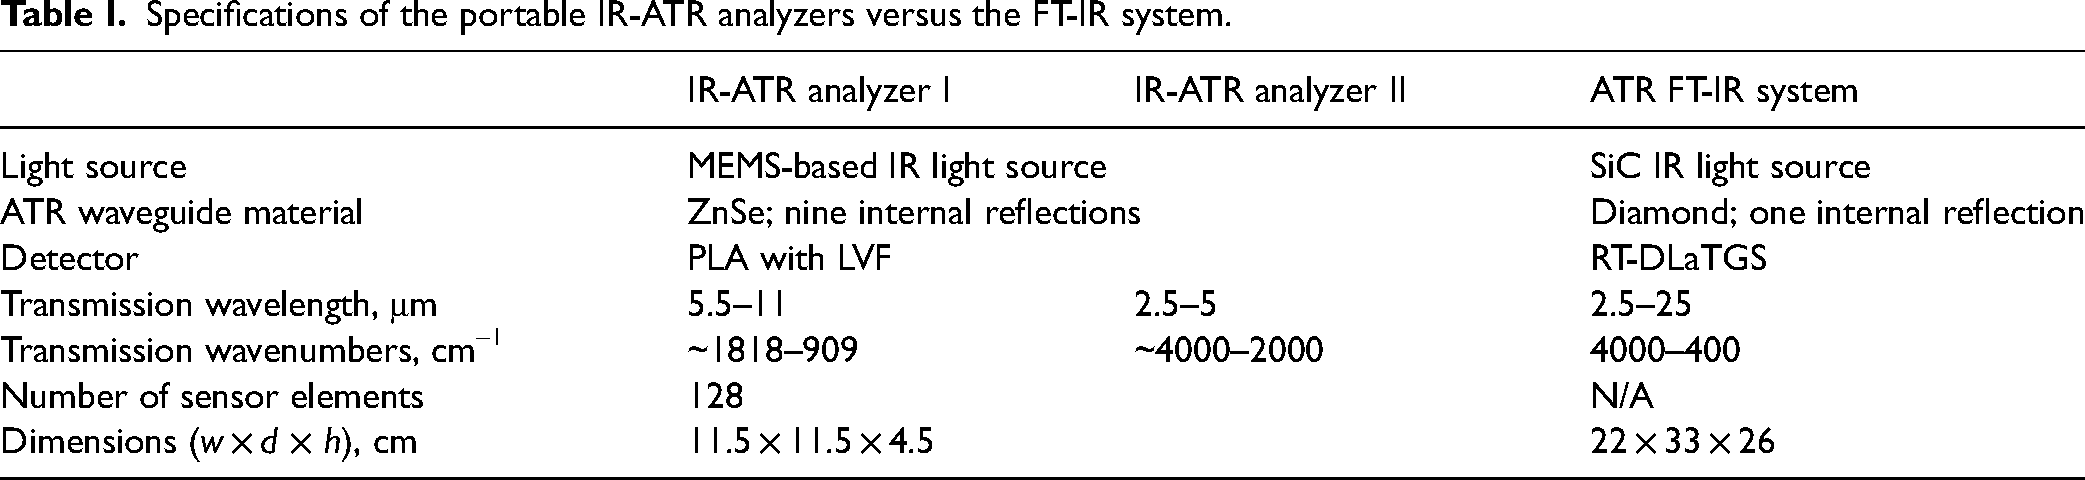
The compact IR-ATR device is based on a modular system comprising a PLAD paired with an LVF for wavelength discrimination (Pyreos Ltd). 18 Two IR-ATR analyzers, PY2600 and PY0727, were used providing access to different MIR spectral ranges, and the analytical performance was compared to a conventional FT-IR system (see the Conventional ATR FT-IR Spectrometer section). A schematic beam path of the analyzer is shown in Fig. 1. Both IR-ATR analyzers are composed of a MEMS-based IR radiation source, which emits radiation in pulsed mode with a pulse rate adjusted to 22 Hz, a multireflection ZnSe ATR waveguide providing nine internal reflections, 18 and a PLAD with an LVF tailored to the individual wavelength regime without the need of an additional dispersive element. 23 The LVF is based on thin-film technology with the center frequency of the bandpass filter determined by the thickness of the coating. 18 Each PLAD comprises 128 individual sensor elements (i.e., pixels). The PY0727 has the LVF tailored for the spectral range of 5.5–11.0 μm (approximately 1818–909 cm–1), herein termed IR-ATR analyzer I. The PY2600 has the LVF optimized for the spectral range of 2.5–5.0 μm (approximately 4000–2000 cm–1), herein termed IR-ATR analyzer II. The specifications of the IR-ATR analyzers are summarized in Table I. The dimensions of an IR-ATR analyzer along with all electronic units are 11.5 × 11.5 × 4.5 cm (width × depth × height) at a weight of approximately 500 g.
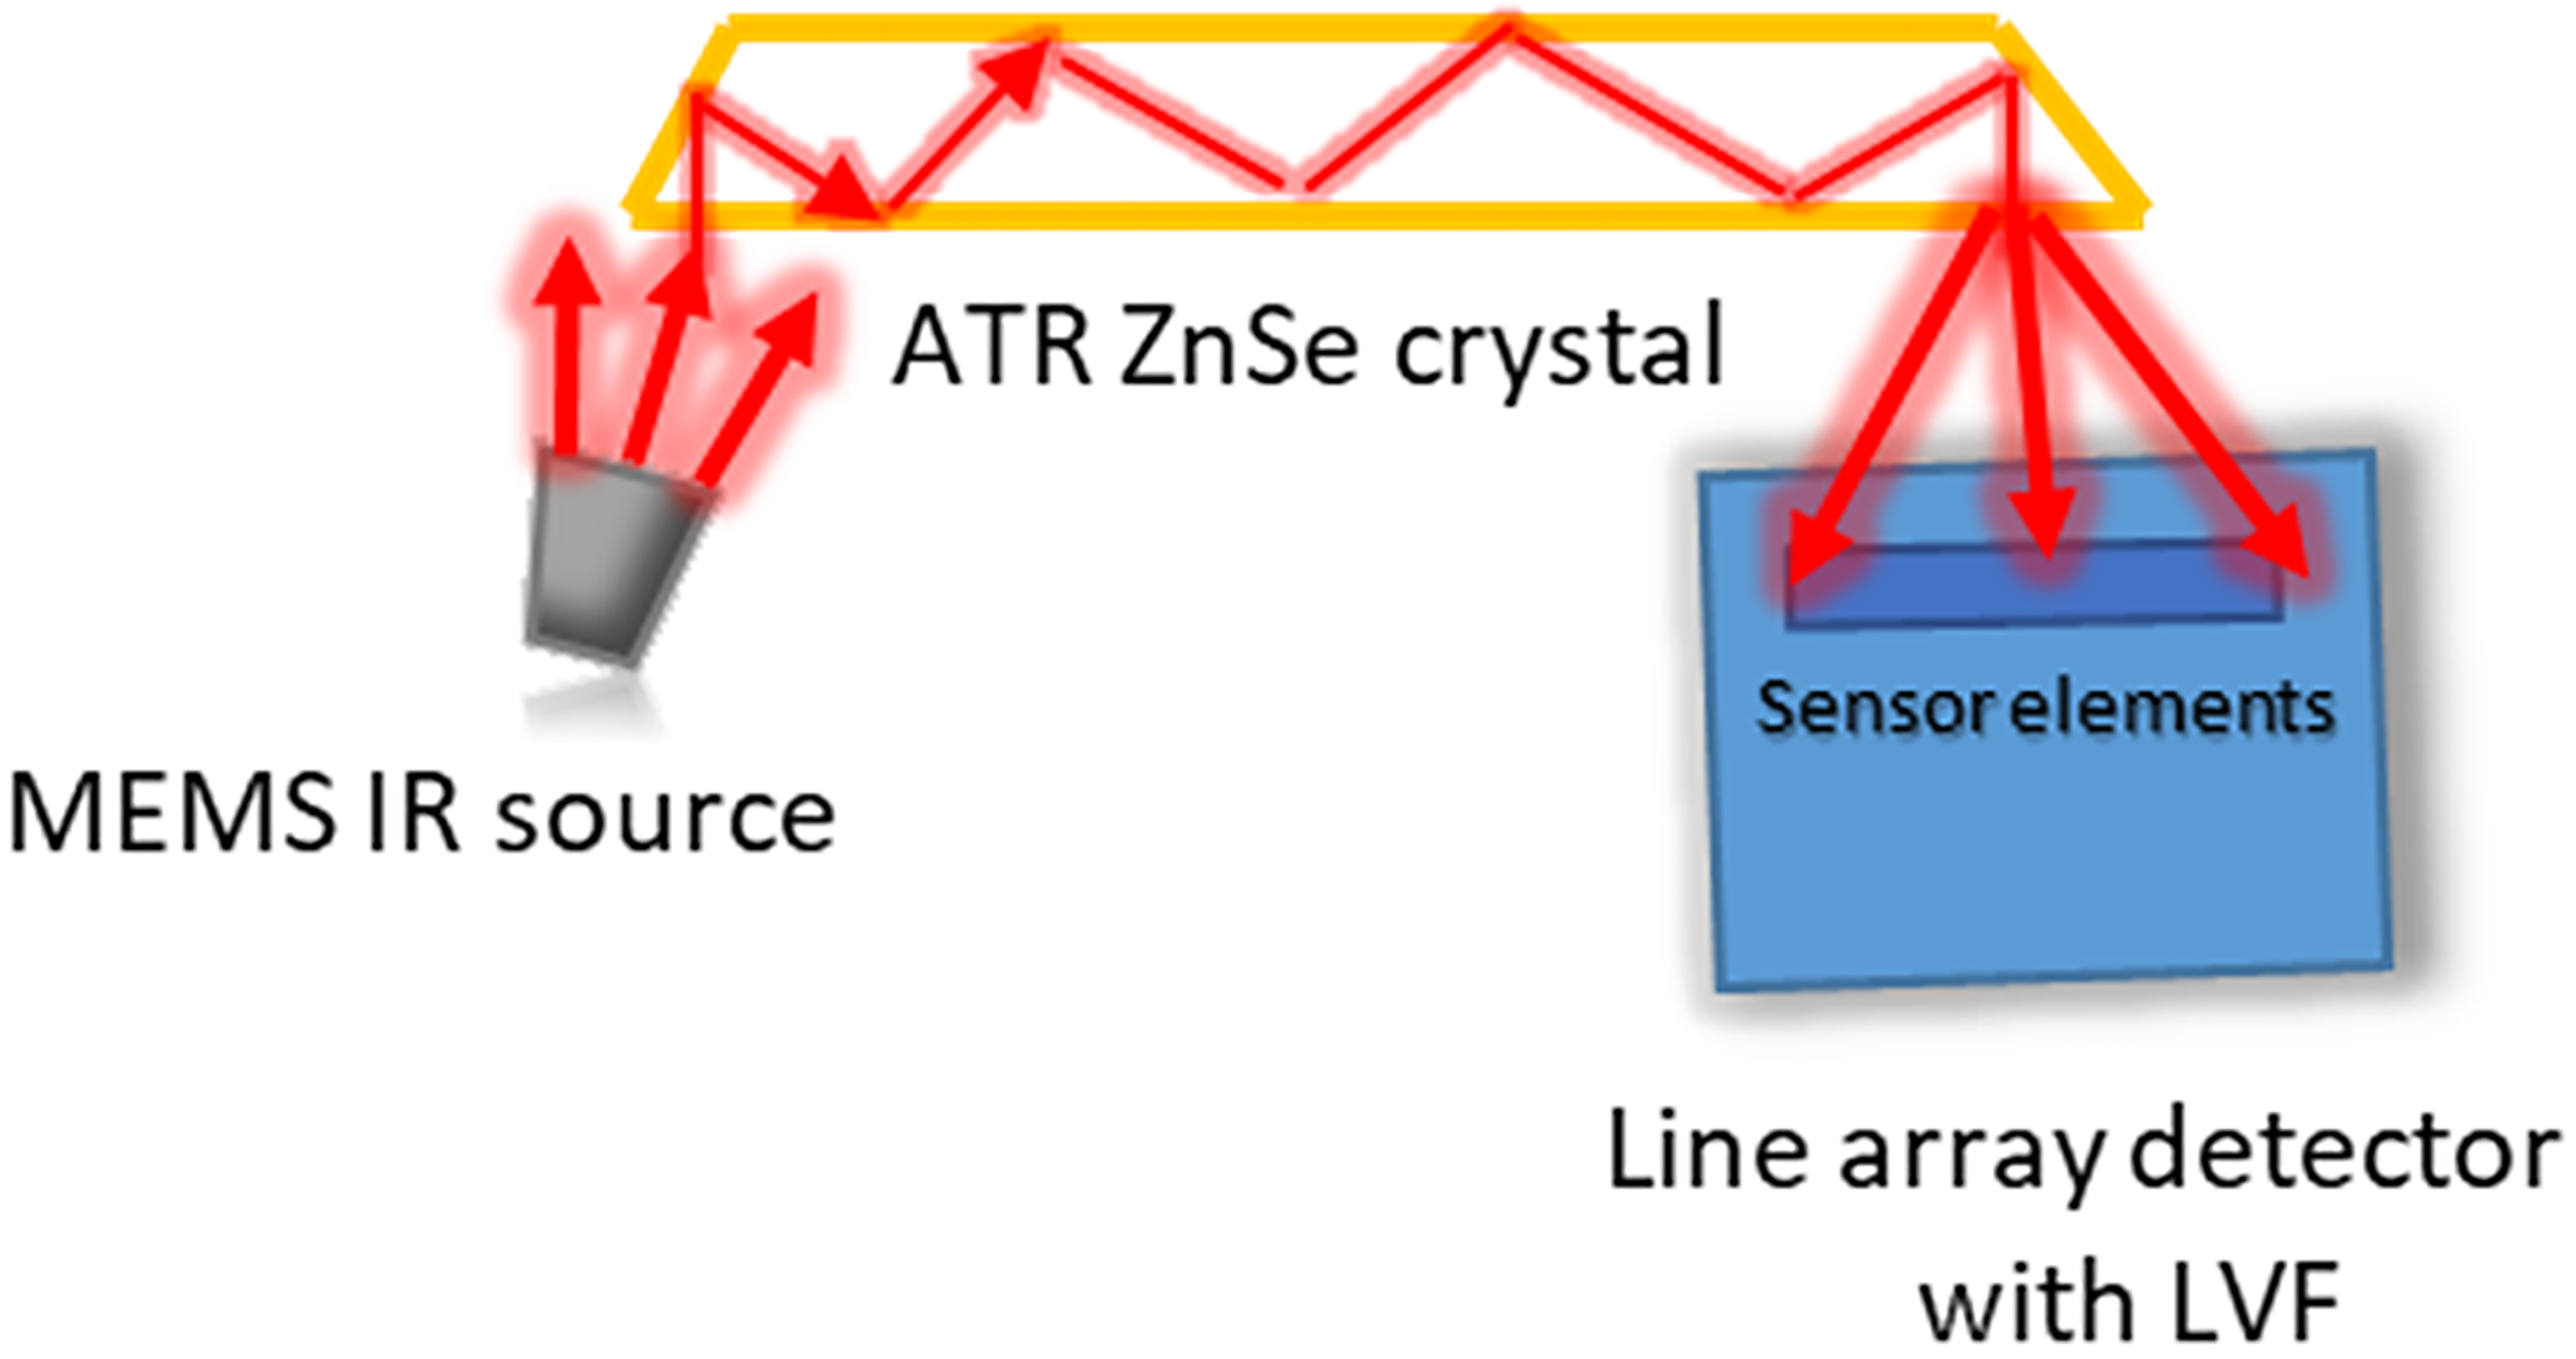
Schematic diagram of the IR-ATR system.
Specifications of the portable IR-ATR analyzers versus the FT-IR system.
For each measurement, 400 scans have been averaged for collecting background and sample spectra, which requires approximately 40 s per measurement. All exemplary analytes were dissolved in water or organic solvents. Hence, spectra of all samples with the exception of DMF were recorded after evaporation of the solvent reconstituting a thin analyte film at the ATR crystal surface avoiding overlapping solvent bands and improving the sensitivity by maximizing the volume of residue within the penetration depth of the evanescent field. DMF was analyzed as dissolved in the liquid phase. To cover the entire sensing area of the ATR waveguide, 0.5 mL sample aliquots were deposited for each measurement. For the spectra pretreatment prior to data evaluation, a baseline correction has been applied.
Conventional ATR FT-IR Spectrometer
For comparison, a laboratory FT-IR spectrometer (Alpha II, Bruker Optics GmbH) was used as a benchmark. This spectrometer is equipped with a SiC light source, a Michelson interferometer, a single-bounce diamond ATR assembly (Platinum, Bruker Optics GmbH), and a room-temperature-operated RT-DLaTGS detector. This device covers the entire MIR range (4000–400 cm–1) with dimensions of 22 × 33 × 26 cm (width × depth × height) at a weight of 7 kg. The specifications of the FT-IR spectrometer are summarized in Table I.
The Opus 8.1. software package (Bruker Optics GmbH) was used to record the spectra. For each spectrum, 128 scans at a spectral resolution of 2 cm–1 were averaged, which requires approximately 5 min for each measurement (for DON samples, 256 scans were averaged during 9 min per measurement). The entire spectral range (4000–400 cm–1) was used; later, the spectra were separated into two ranges (4000–2000 and 1800–900 cm–1) facilitating the comparison with the two different IR-ATR analyzers. Baseline correction (i.e., rubber band correction with 64 baseline points) and Savitzky–Golay smoothing (with a nine-point smoothing window) have been applied for spectra pretreatment. For all examples, except DMF, the analysis was executed after evaporation of a 10 µL aliquot covering the entire surface of the ATR crystal. DMF solutions were analyzed as a liquid.
Calculation of the Analytical Figures-of-Merit
To estimate the analytical performance of the devices, the sensitivity, the repeatability of the measurements, the spectral resolution, and the signal-to-noise ratio (S/N) were determined.
For evaluating the repeatability, the SD and the RSD have been calculated according to Eqs. 1 and 2: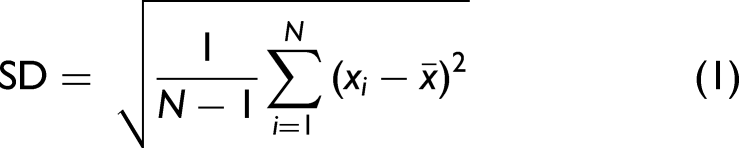
For estimating the sensitivity, the LOD and LOQ have been calculated from the calibration functions according to Eqs. 3 and 4:55,56

The spectral resolution of the IR-ATR analyzers was calculated by dividing Δ(wavenumber) by Δ(pixel), while the spectral resolution of the FT-IR approach was set in the software at 2 cm–1. The S/N was calculated using the root mean square (RMS) approach corresponding to the time average of the signal divided by the RMS noise of the signal in the same period.
OriginPro 2021 (OriginLab Corporation) was used for spectra preprocessing including baseline correction for the IR-ATR systems. The EssentialFT-IR Spectroscopy Software Toolbox (Operant LLC) was used to convert the obtained FT-IR spectra into a format suitable for data evaluation. Microsoft Excel 2016 (Microsoft) was used for calculating the analytical figures-of-merit.
Pixel Versus Wavenumber Correlation with QCLs
For a comparison of the FT-IR device with the compact IR-ATR spectrometers, it is essential to correlate the pixel response of the PLAD with the actual wavenumber. For this purpose, the detectors of the two IR-ATR spectrometers were illuminated with tunable QCLs providing a well-defined radiation output in the MIR range.
The PLAD operating in the range of 1818–909 cm–1 has been illuminated with a broadly tunable external cavity QCL (EC-QCL) system (MIRcat-QT, Daylight Solutions) emitting in the range of 1850–890 cm–1. Tuning the wavelength of the emitted IR radiation, the response of the detector at each individual pixel was registered and repeated three times.
The PLAD operating in the range of 4000–2000 cm–1 has been illuminated with nine different single-mode QCLs (Nanoplus Nanosystems and Technologies GmbH) emitting at 3814, 3495, 3102, 2866, 2681, 2490, 2289, 2171, and 2029 cm–1. For each laser, again the response at individual pixels was registered and repeated three times.
Results and Discussion
Pixels Versus Wavenumbers
Pixel values and corresponding wavenumbers obtained after illuminating the PLAD of the IR-ATR analyzer I with the EC-QCL (see the Pixel Versus Wavenumber Correlation with QCLs section) are summarized in Table S1 (Supplemental Material). Figure 2a shows the dependence of the wavenumbers on the pixels for the analyzer I. The function after approximation can be described as y = 0.0373x2 − 11.721x + 1807.7 (R2 = 0.9988) and was used to convert pixel response into wavenumbers in the remainder of this study. The results are shown in Table S2 (Supplemental Material).
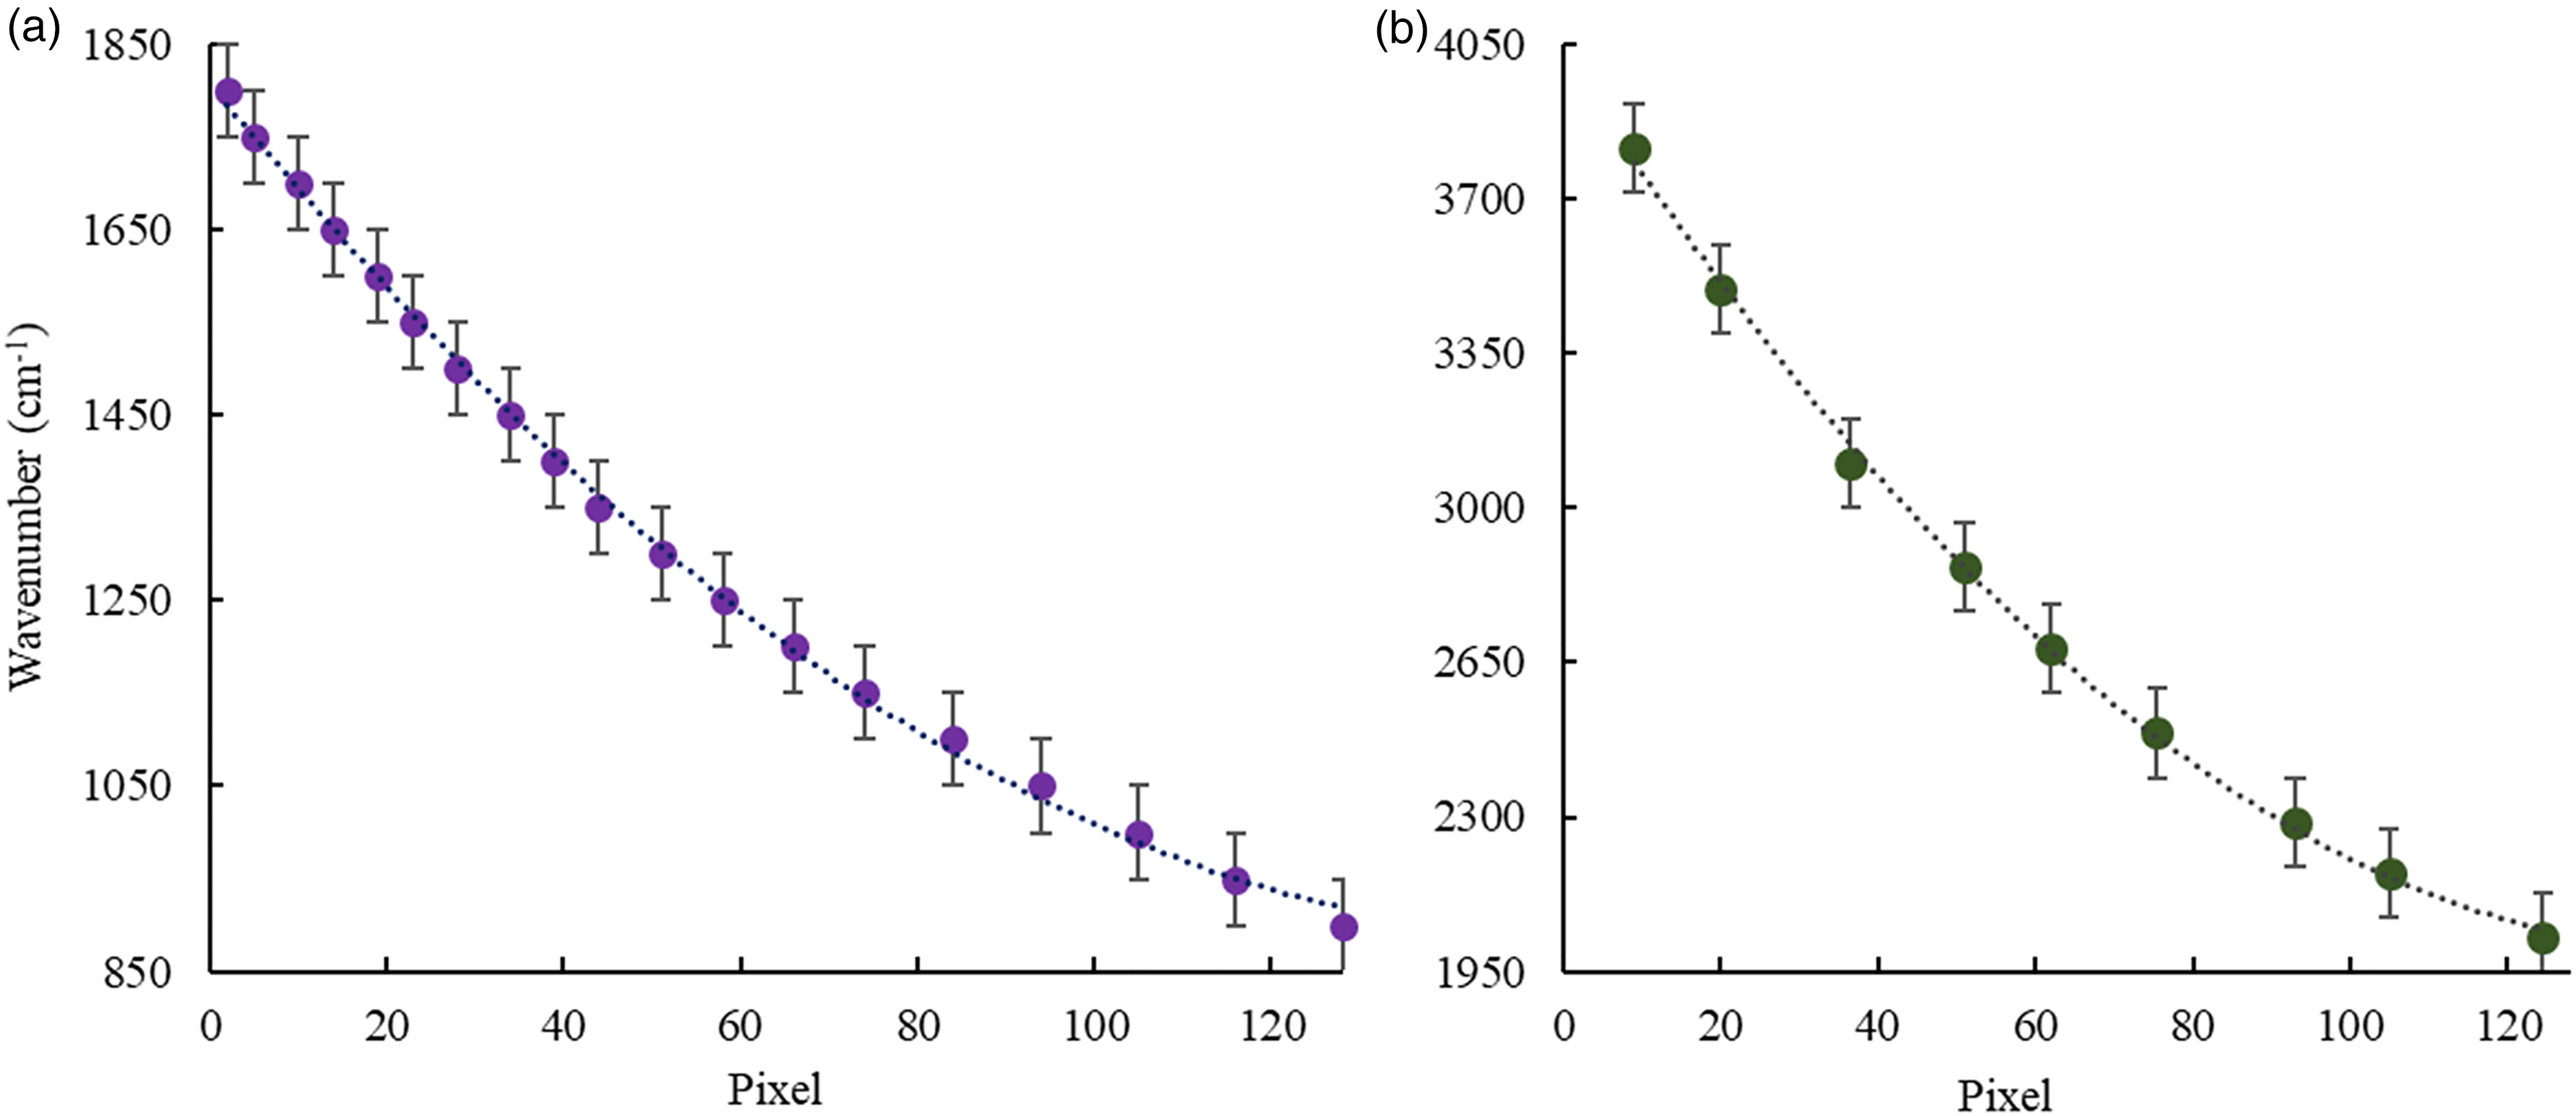
Dependence of wavenumber versus pixel for (a) IR-ATR analyzer I and (b) for IR-ATR analyzer II.
In Table S3 (Supplemental Material), the detected pixel values and corresponding wavenumbers for the IR-ATR analyzer II are summarized. Figure 2b shows the correlation between wavenumbers and pixels. The obtained correlation function after approximation was y = 0.0934x2 − 27.518x + 4023.5 (R2 = 0.9988) and was used for calculating wavenumbers from pixel response (Table S2, Supplemental Material).
The dependence between pixels and wavenumbers is not linear for both IR-ATR analyzers resulting in a variable spectral resolution across the detected wavenumber range. In the case of an FT-IR spectrometer, the spectral resolution is indeed constant across the entire wavenumber range. Therefore, the spectral resolution of the IR-ATR spectrometers may be considered limited in certain wavenumber regions with up to 29 cm–1/pixel (in the range of 3814–3495 cm–1). However, once these characteristics are precisely determined, qualitative and quantitative analysis remains possible taking this aspect into account.
N,N-Dimethylformamide in Water
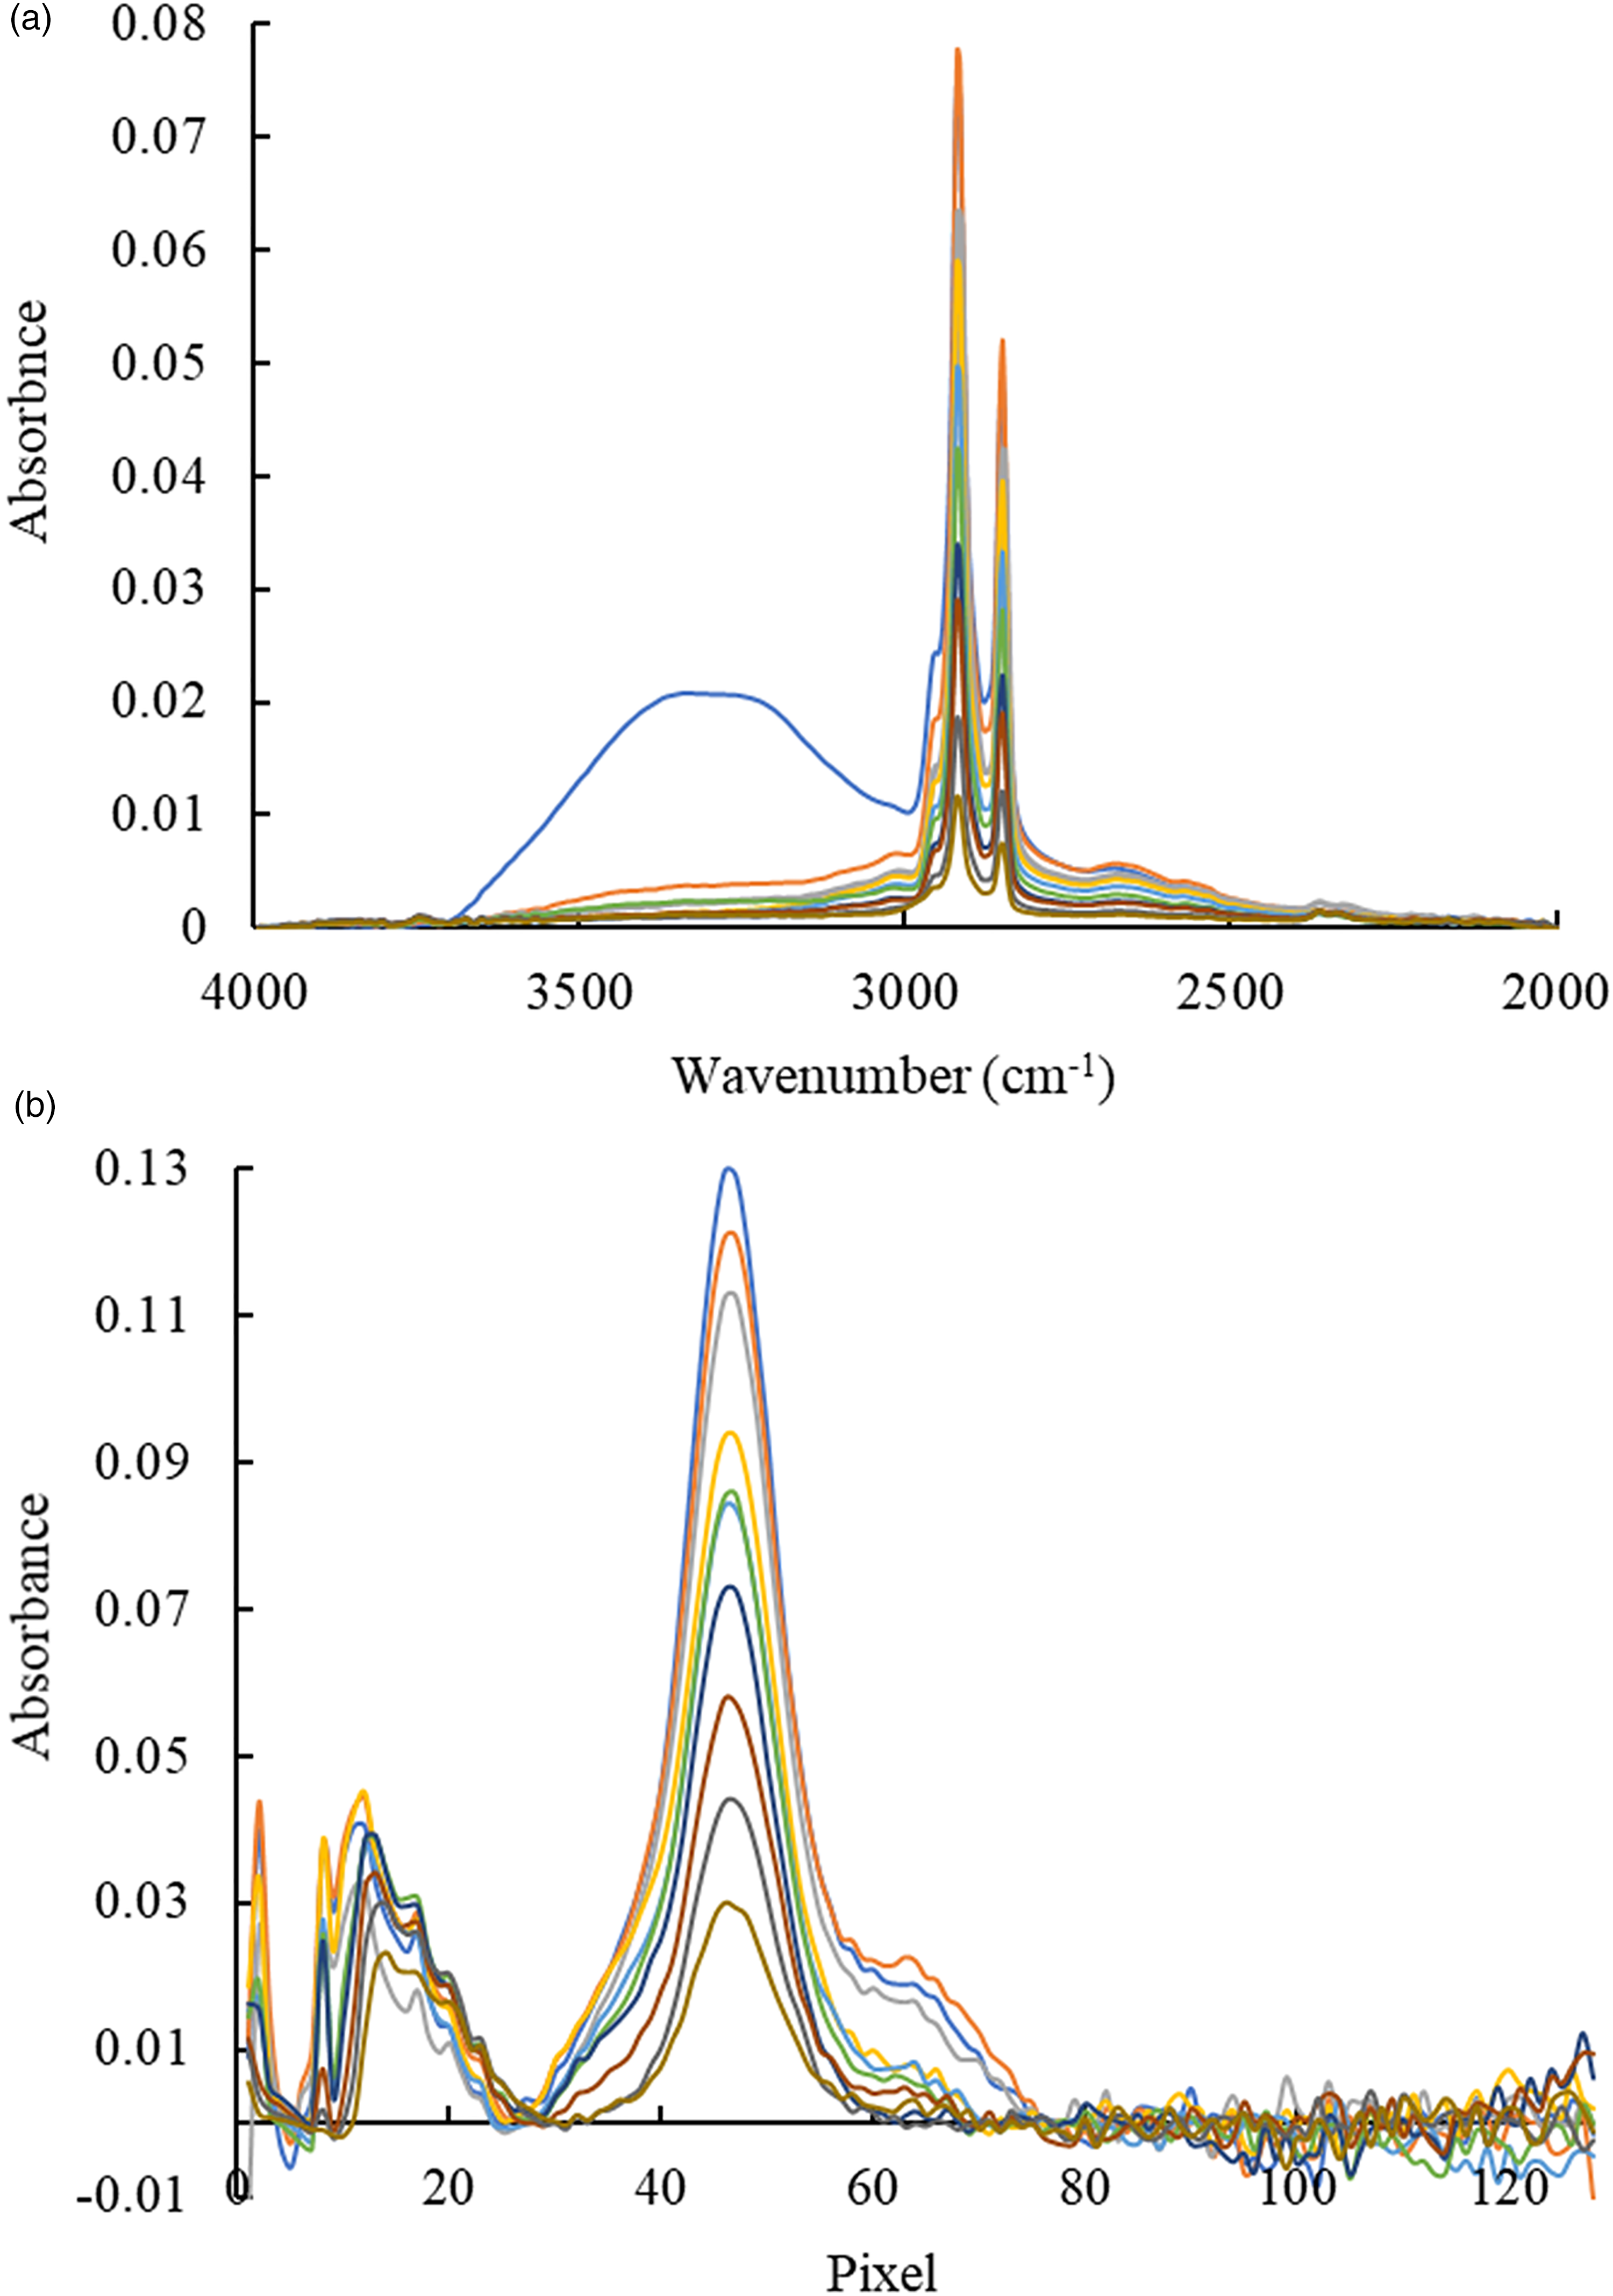
Calibration solutions of DMF in water (10–100 and 100–1000 g/L) as a representative of organic solvents were analyzed using the FT-IR system and the IR-ATR analyzer I. The FT-IR spectra are shown in Fig. 3a. The characteristic bands can be related as follows: the feature at 1650 cm–1 is assigned to the C–O stretching vibration, and bands at 1494, 1453, and 1438 cm–1 are related to the methyl (CH3) bending vibrations. The feature at 1387 cm–1 corresponds to N–C–H bending vibrations, while the band at 1253 cm–1 is attributed to the C–N asymmetric stretch. The features at 1090 and 1062 cm–1 correspond to the CH3 rocking vibrations.57,58 The area under the peaks in the range of 1521–1340 cm–1 was selected for building calibration functions.
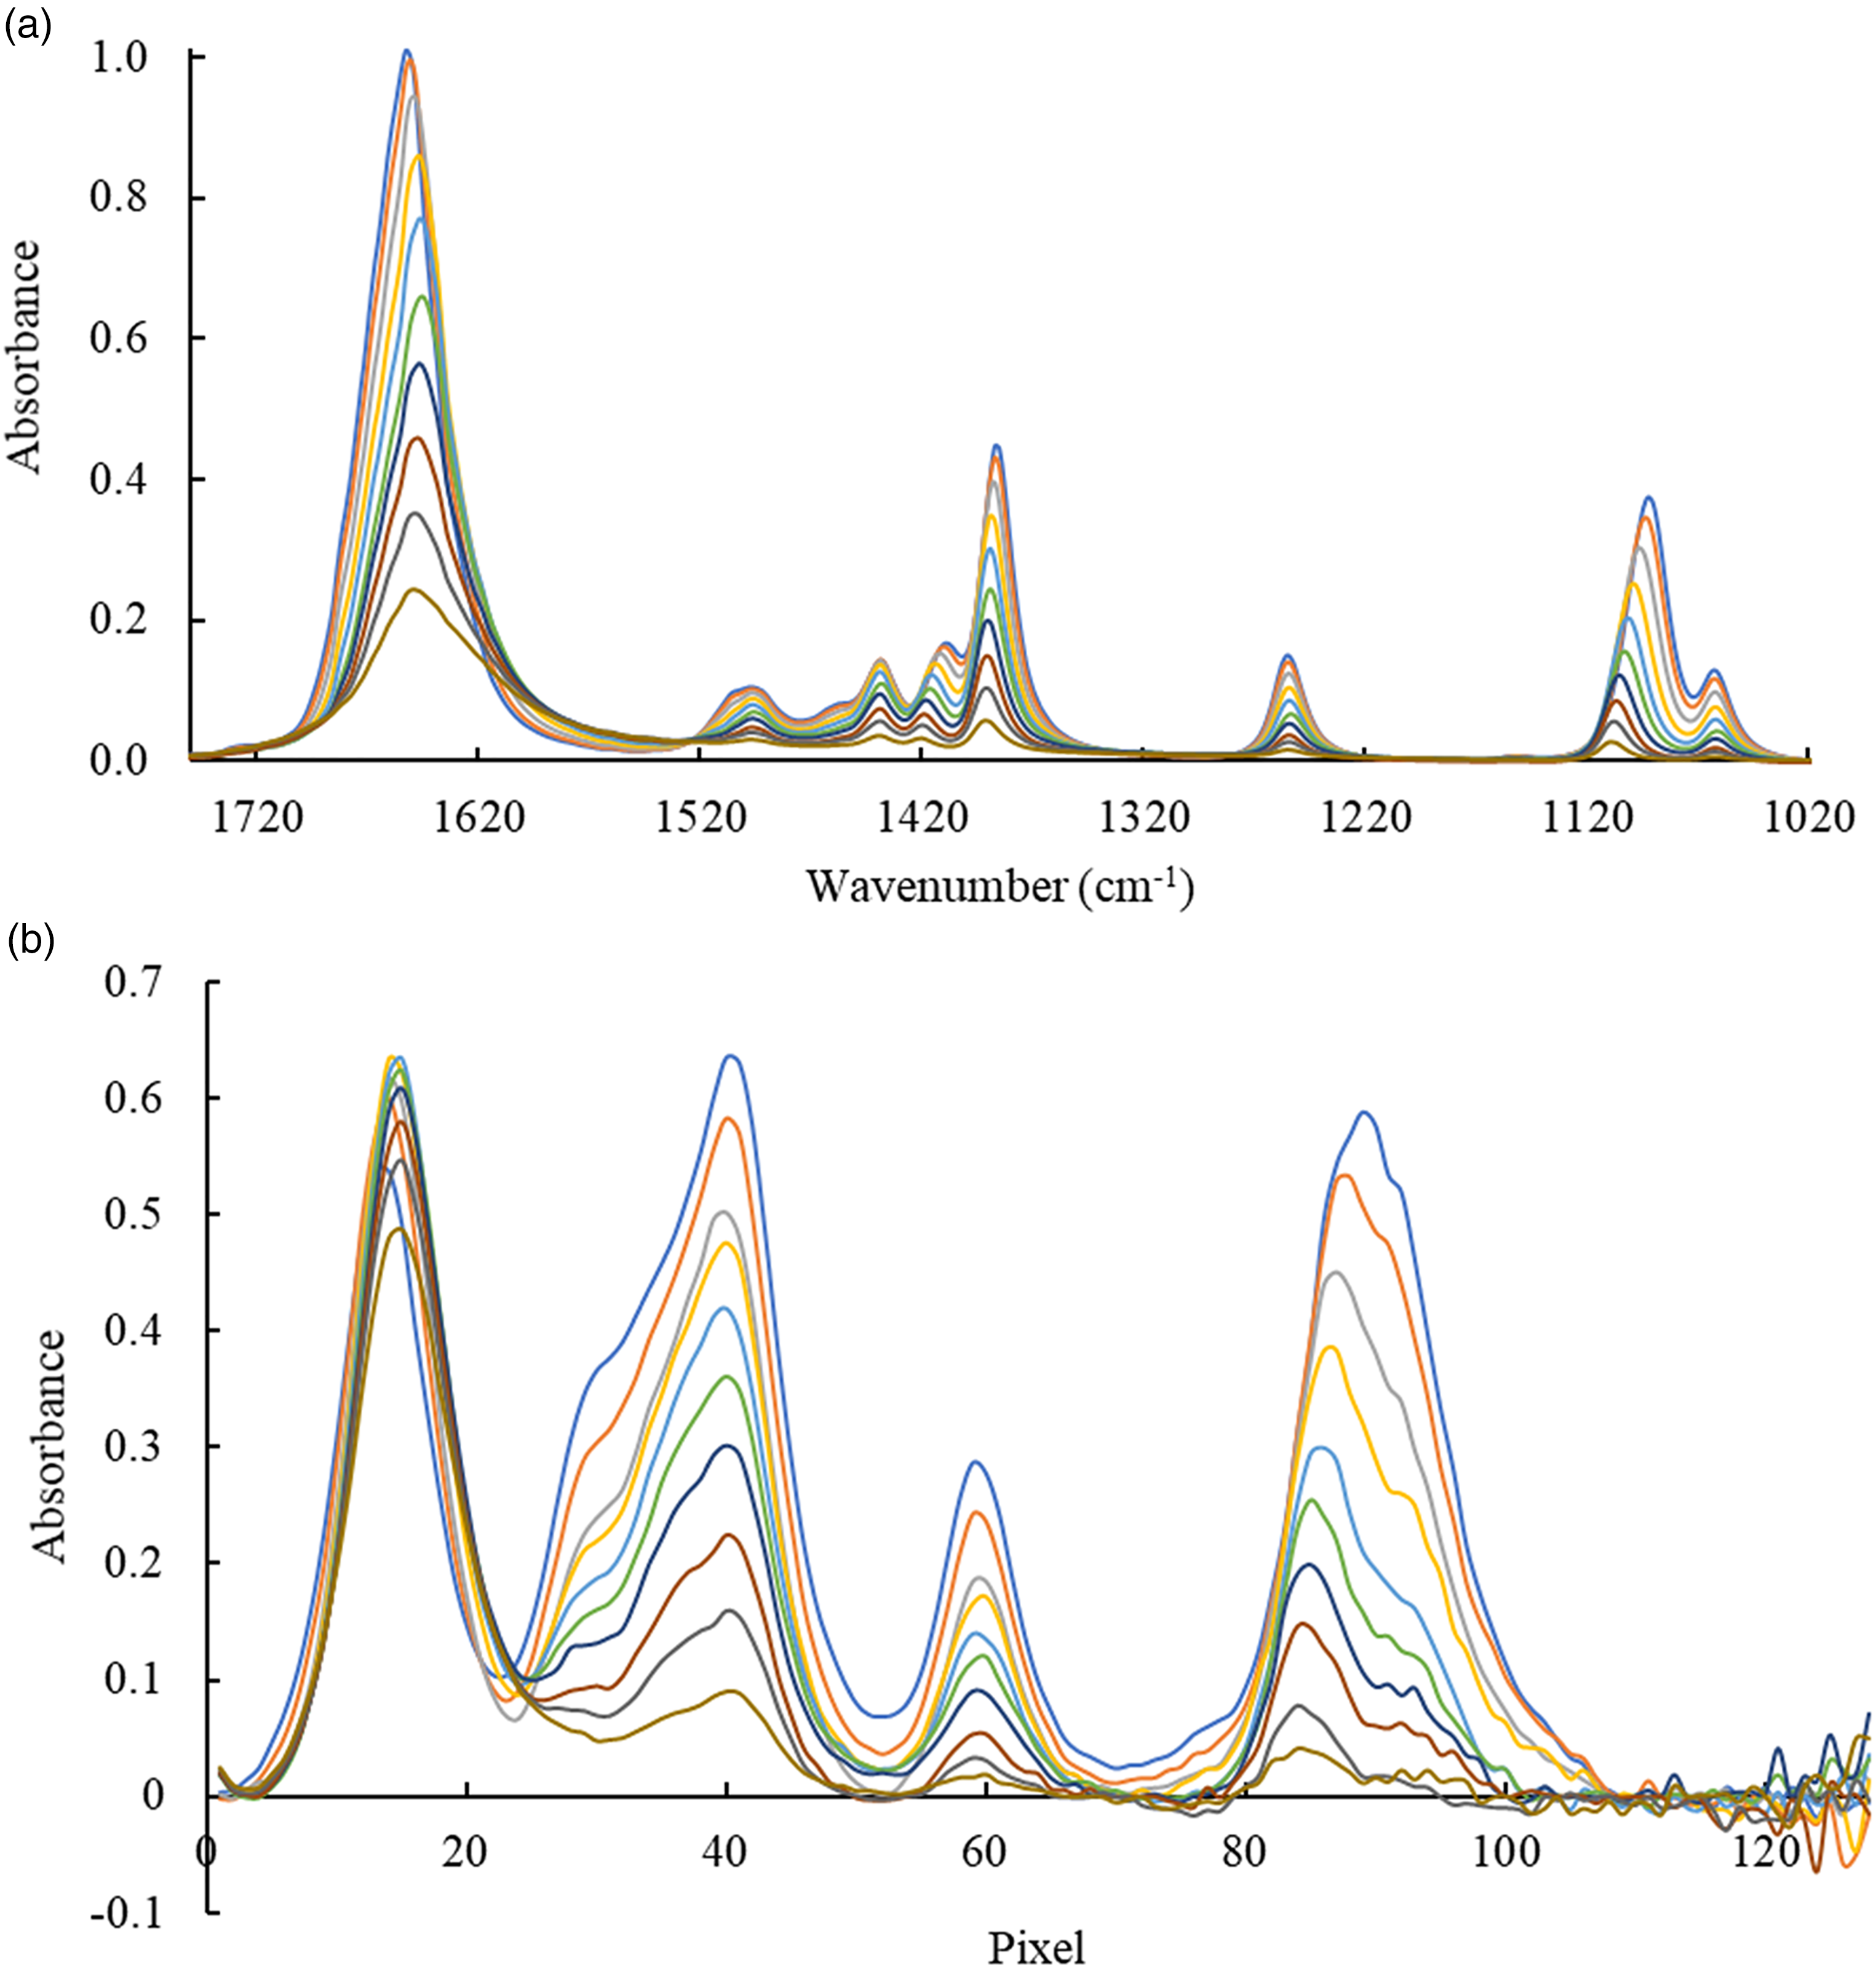
Infrared spectra of DMF in water (1000–100 g/L) recorded via evanescent field absorption spectroscopy with (a) a laboratory FT-IR spectrometer and (b) an IR-ATR analyzer I.
Spectra recorded using an IR-ATR analyzer I are presented in Fig. 3b. Comparing the spectra, it is immediately evident that the spectral resolution of the IR-ATR analyzer is lower than of the FT-IR spectrometer, as previously discussed. For instance, the spectral features at 1521–1340 cm–1, which appear as separate peaks in the FT spectrum (Fig. 3a), merge into one broad peak with “shoulders” in the spectrum obtained using the IR-ATR analyzer (pixels 23–53) (Fig. 3b). A similar phenomenon is observed for the features at 1130–1027 cm–1, which corresponds to one broad peak with a maximum at pixel 41.
N,N-Dimethylformamide in Water (100–1000 g/L)
The calibration function of DMF (100–1000 g/L) obtained with the FT-IR spectrometer is shown in Fig. 4a. The corresponding equation was derived as y = (0.0077 ± 0.0002)x + (0.8976 ± 0.1384), (P = 0.95; N = 10, R = 0.9966), whereby P is the probability, N is the number of experimental points, and R is the correlation coefficient. Standard deviations for the concentrations of 1000 and 100 g/L have been calculated according to Eqs. 1 and 2 providing SD (1000 g/L, N = 6) = 0.0007 g/L, RSD (1000 g/L, N = 6) = 0.2% and SD (100 g/L, N = 6) = 0.0070 g/L, RSD (100 g/L, N = 6) = 12.0%.
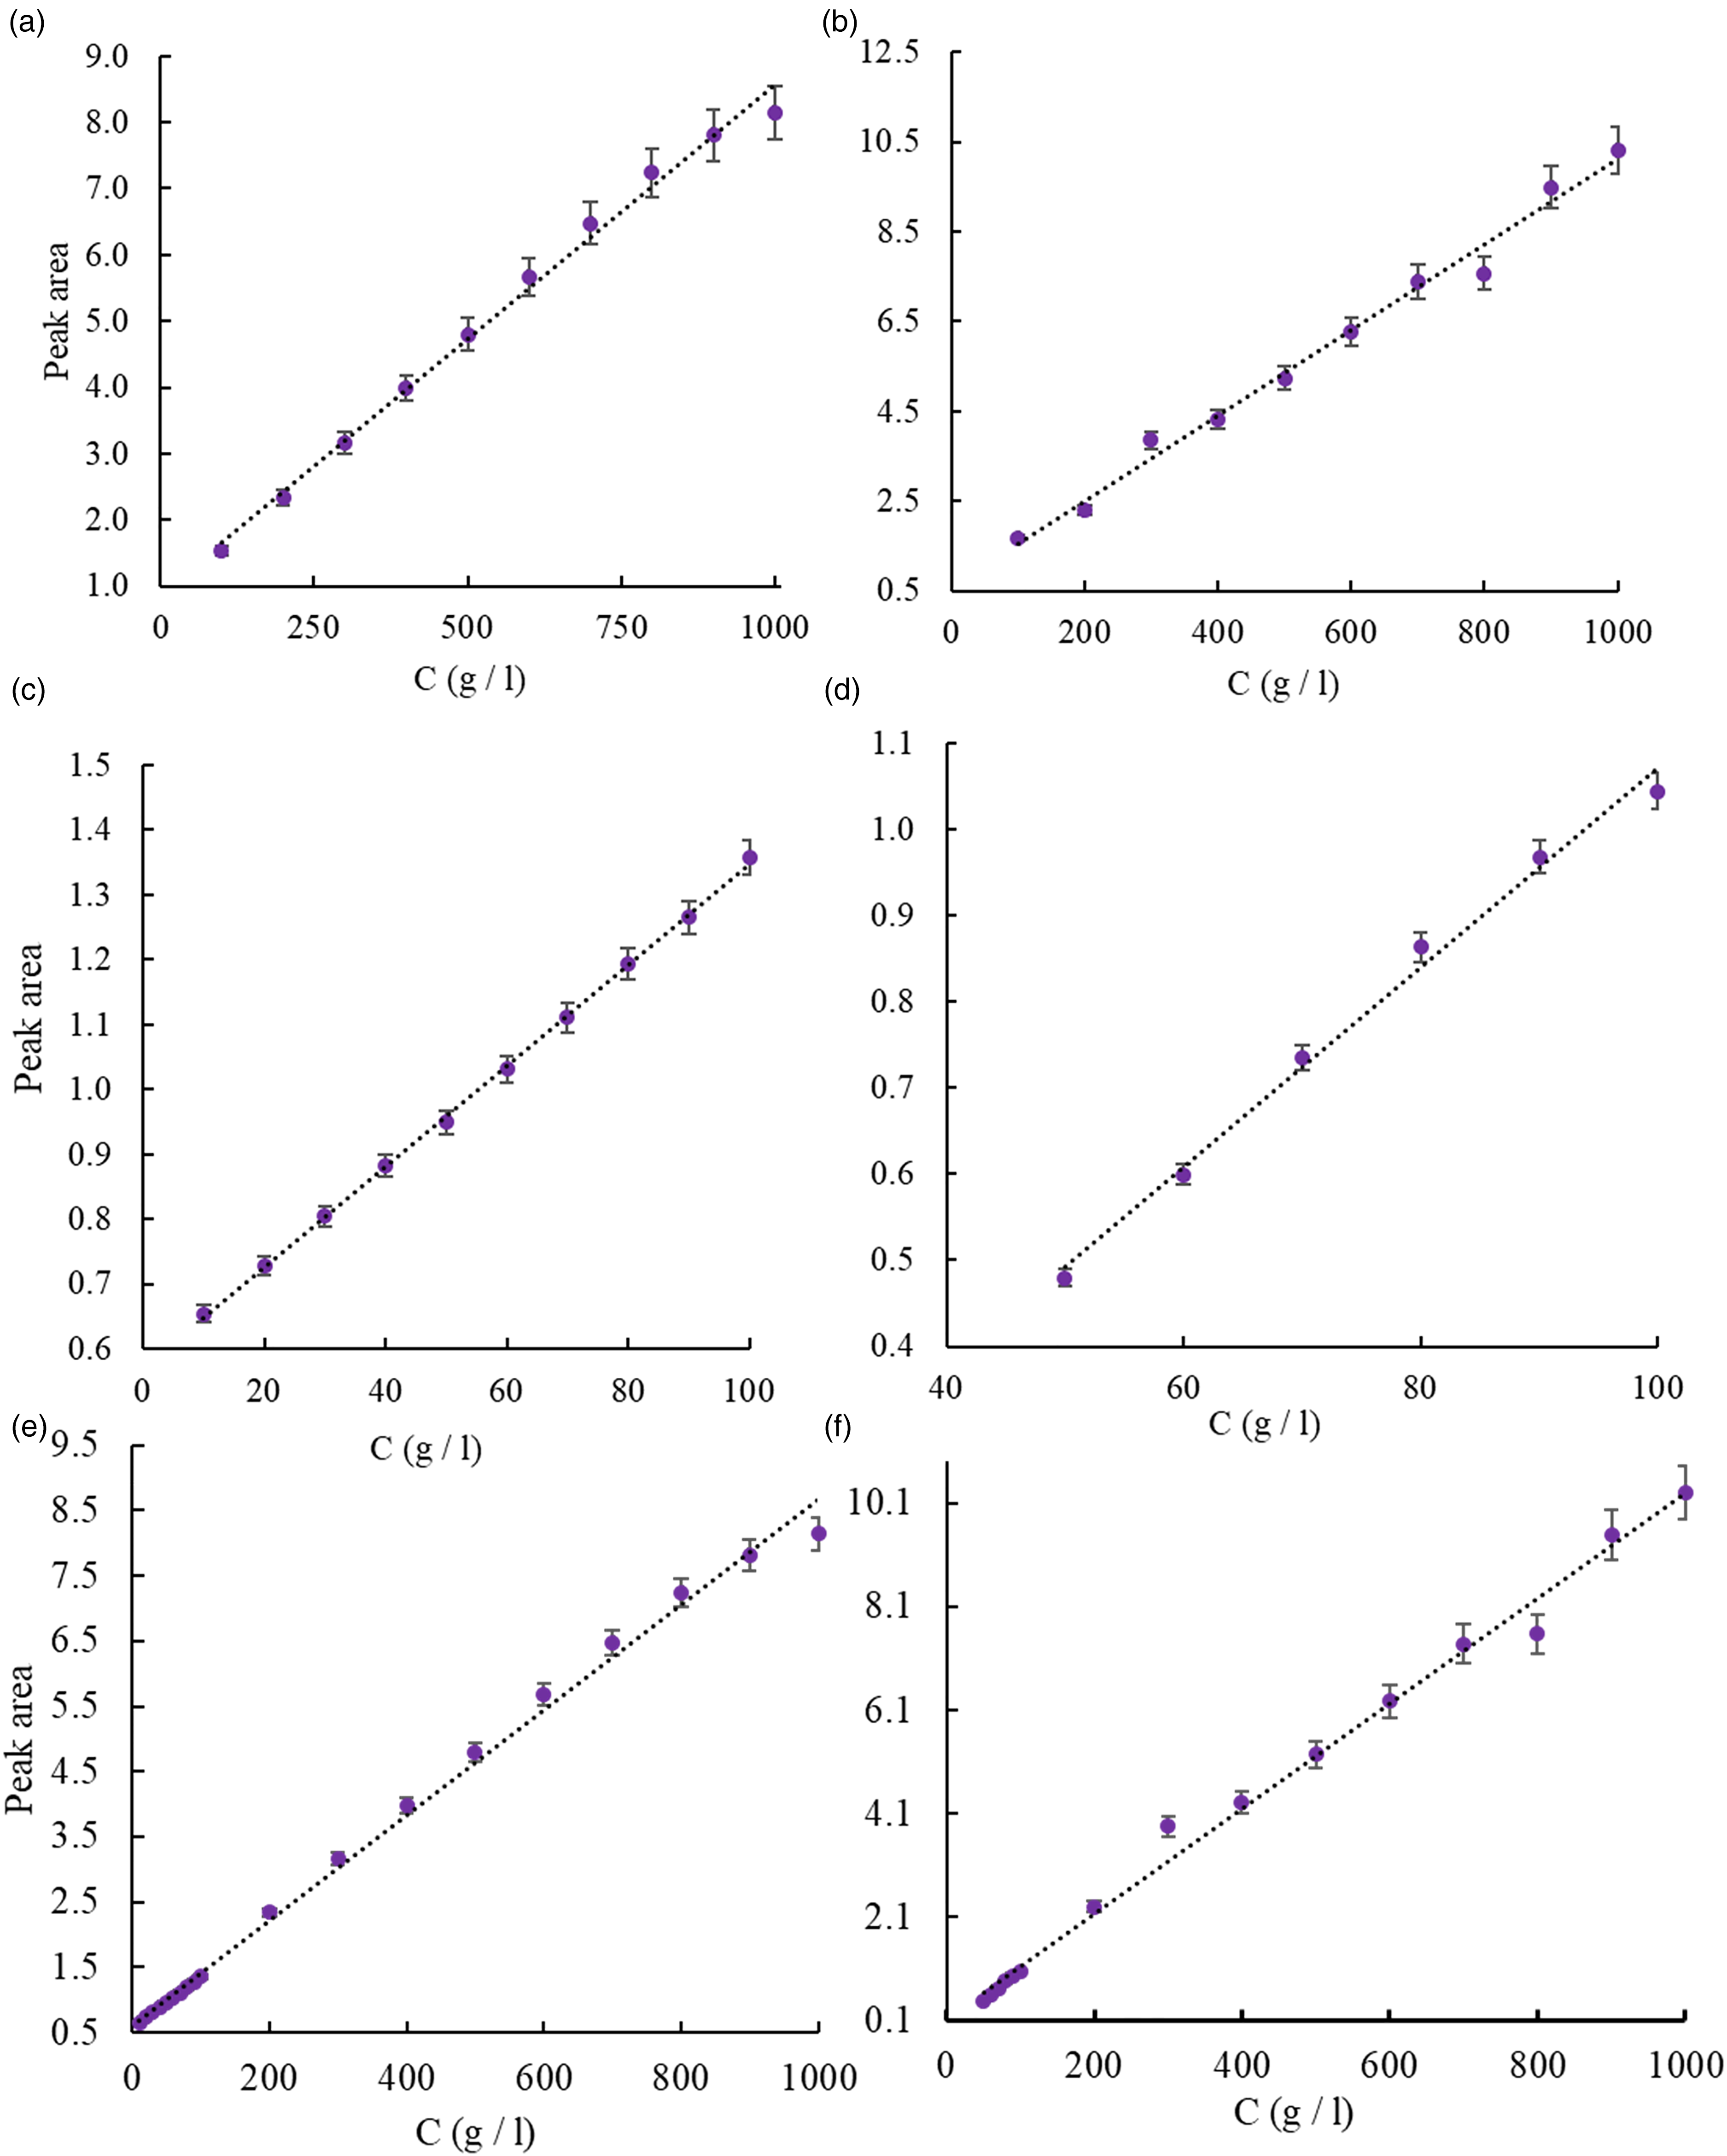
Calibration function of DMF (100–1000 g/L) obtained with (a) FT-IR system, and (b) IR-ATR analyzer I. Calibration function of DMF (10–100 g/L) obtained with (c) FT-IR system and (d) IR-ATR analyzer I. Calibration function of DMF 10–1000 g/L obtained with (e) FT-IR system and (f) IR-ATR analyzer I.
In turn, the calibration function of DMF (100–1000 g/L) obtained using the IR-ATR analyzer is shown in Fig. 4b and the derived equation was y = (0.0095 ± 0.0003)x + (0.615 ± 0.216), (P = 0.95; N = 10; R = 0.9946). The dependence shows a pronounced linear relationship of peak area versus concentration of the sample. Standard deviations have been calculated as SD (1000 g/L, N = 6) = 0.008 g/L, RSD (1000 g/L, N = 6) = 1% and SD (100 g/L, N = 6) = 0.003 g/L, RSD (100 g/L, N = 6) = 0.80%. These values demonstrate high repeatability of the system and for the concentration of 100 g/L even better values versus the FT-IR device. The obtained results prove that the quantitative analysis of DMF as a representative of commonly used organic solvents at high concentrations is indeed feasible with low-cost portable IR-ATR systems.
N,N-Dimethylformamide in Water (10–100 g/L)
After comparison of the devices at high concentrations, the same procedure was followed investigating lower concentrations (10–100 g/L). Calibration functions of DMF solutions using the IR-ATR analyzer and the conventional FT-IR are shown in Figs. 4c and 4d. The calibration equation for the IR-ATR analyzer was y = (0.0116 ± 0.0005)x - (0.0876 ± 0.0394), (P = 0.95; N = 10; R = 0.9961), while for the FT-IR spectrometer yielded y = (0.00776 ± 0.0007)x + (0.5709 ± 0.0042), (P = 0.95; N = 10, R = 0.9996). Both systems show a pronounced linear behavior, which is confirmed by the corresponding correlation coefficients.
The lowest concentration that could be detected using the IR-ATR analyzer was 50 g/L. In comparison, the lowest detected concentration using the FT-IR system appeared to be 10 g/L. To explain this trend, it is important to calculate the S/N. Consequently, the S/NRMS of the FT-IR device for the range of 1550–1327 cm–1 obtained as 5011, while for the IR-ATR analyzer for the corresponding range of 21–50 pixels yielded 350. The expectedly lower S/N of the IR-ATR analyzer explains the difference in the lowest detectable concentration.
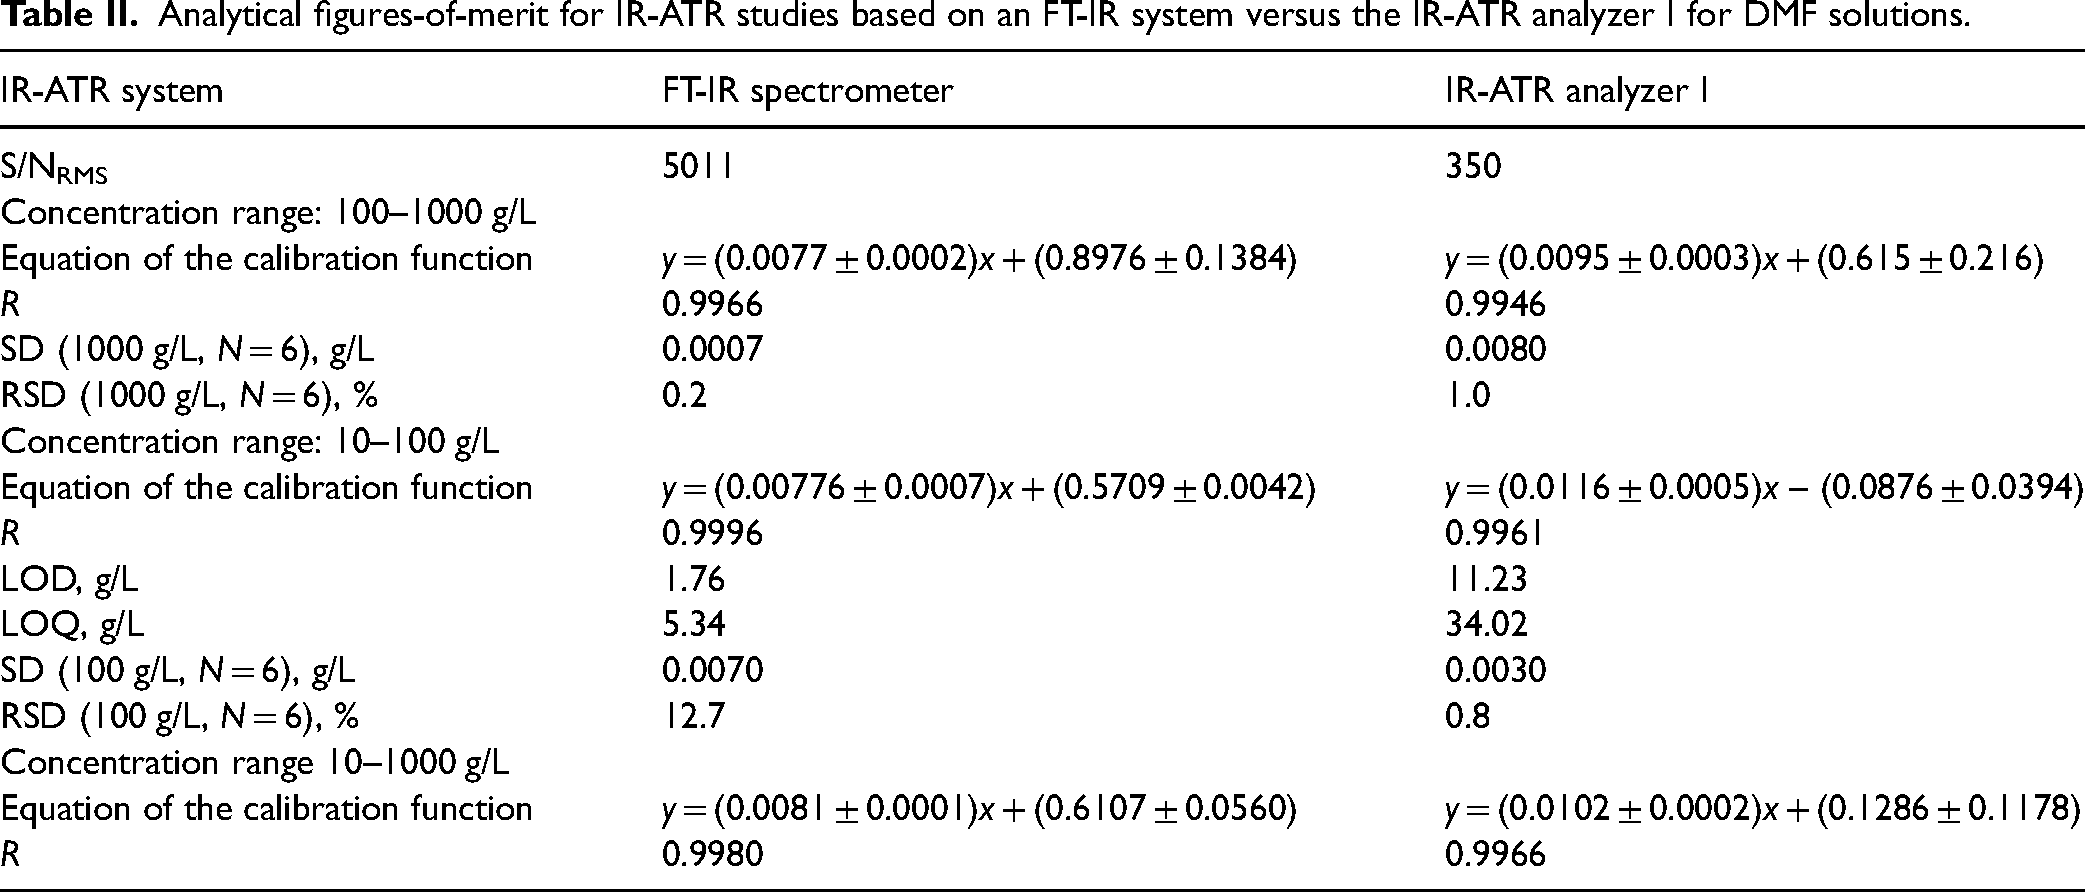
The LOD and LOQ have been calculated for the FT-IR device as LOD = 1.76 g/L and LOQ = 5.34 g/L and for the IR-ATR analyzer as LOD = 11.23 g/L and LOQ = 34.02 g/L. The difference of approximately one order of magnitude in LOD and LOQ is consistent with the difference in S/N. The analytical figures-of-merit calculated for the obtained calibration functions on both IR-ATR systems are summarized in Table II.
Analytical figures-of-merit for IR-ATR studies based on an FT-IR system versus the IR-ATR analyzer I for DMF solutions.
In Figs. 4e and 4f, the concertation series were merged into a single calibration function now covering 10–1000 g/L maintaining linearity for both FT-IR and IR-ATR devices.
The sensitivity of IR-ATR techniques in general depends on the instrumental configuration (i.e., light source, detector, ATR waveguide, single versus multiple internal reflections, etc.). Hence, for the purpose of this study, feasible LODs for the analysis of liquids are derived from the literature in the range of 4–1 × 10⁻⁴ g/L with relative standard deviations (RSD) around 2–10%. Associated linear calibration functions for the concentration ranges of 2–200, 0.5–50, 0–10, and (1–24) × 10–3 g/L, are reported with correlation coefficients of 0.95–1.00. Table II shows that the selected laboratory FT-IR spectrometer performs in the range of the listed literature parameters. The performance of the compact IR-ATR analyzer aligns with reports from the literature except the LOD values, which are clearly affected by the reduced S/N. Despite the lower spectral resolution, the IR-ATR analyzer I demonstrates adequate analytical figures-of-merit in the selected spectral range with sufficient reproducibility, linearity of the calibration function, and sensitivity for the in-field analysis of organic solvents.
Stearic Acid in Ethanol
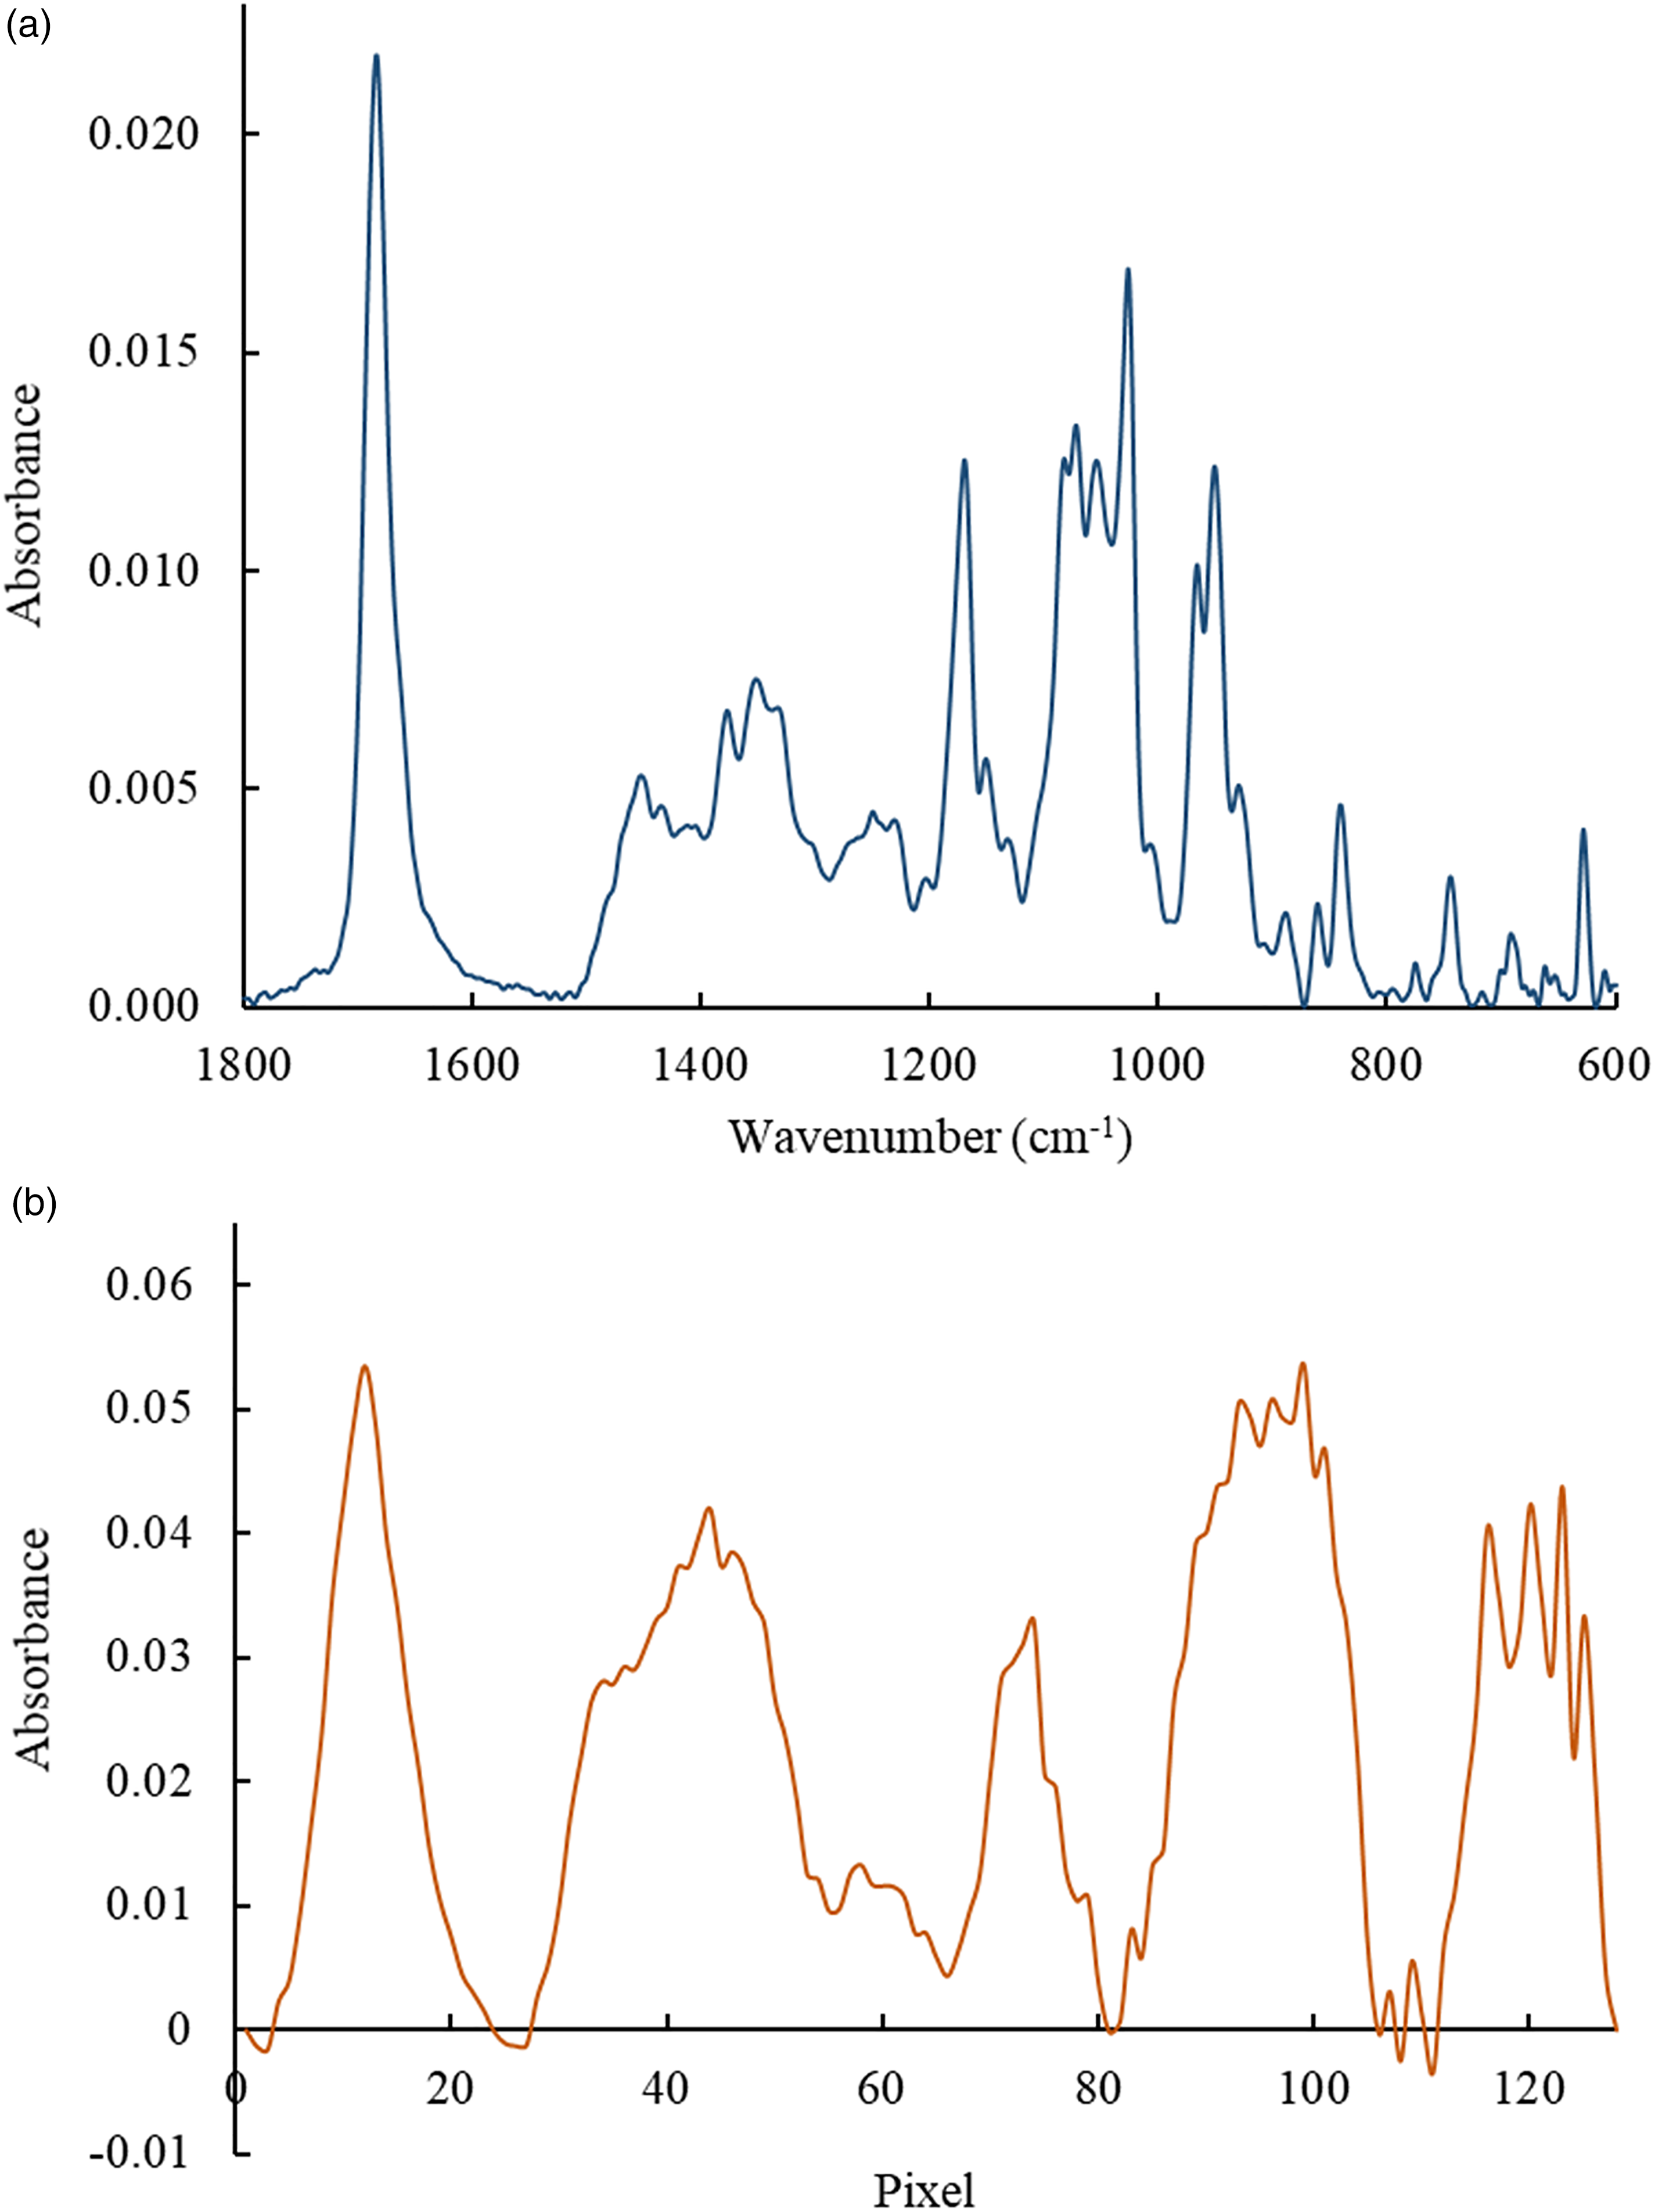
Solutions of the stearic acid in ethanol at concentrations of 0.10–1.00 g/L have been analyzed after evaporation of the solvent via IR-ATR spectroscopy using the FT-IR system and the IR-ATR analyzer II. FT-IR and IR-ATR spectra of the stearic acid are shown in Figs. 5a and 5b, respectively. The bands in the spectrum were assigned as follows. The “shoulder” at 2943 cm–1 corresponds to the CH3 asymmetric stretching vibrations, the band at 2918 cm–1 to the CH2 asymmetric stretching vibrations, the band at 2848 cm–1 relates to the CH2 symmetric stretching vibrations, and the band at 3400 cm–1 to the O–H stretch.59,60 Comparing FT-IR and non-FT-IR spectra, it is evident that the bands in the range of 2943–2848 cm–1, which represent a doublet with a shoulder in the FT-IR spectra appear as one broad peak in the non-FT-IR spectra.
Infrared attenuated total reflection (IR-ATR) spectra of stearic acid after ethanol evaporation (0.10–1.00 g/L) obtained with (a) FT-IR system and (b) with IR-ATR analyzer II.
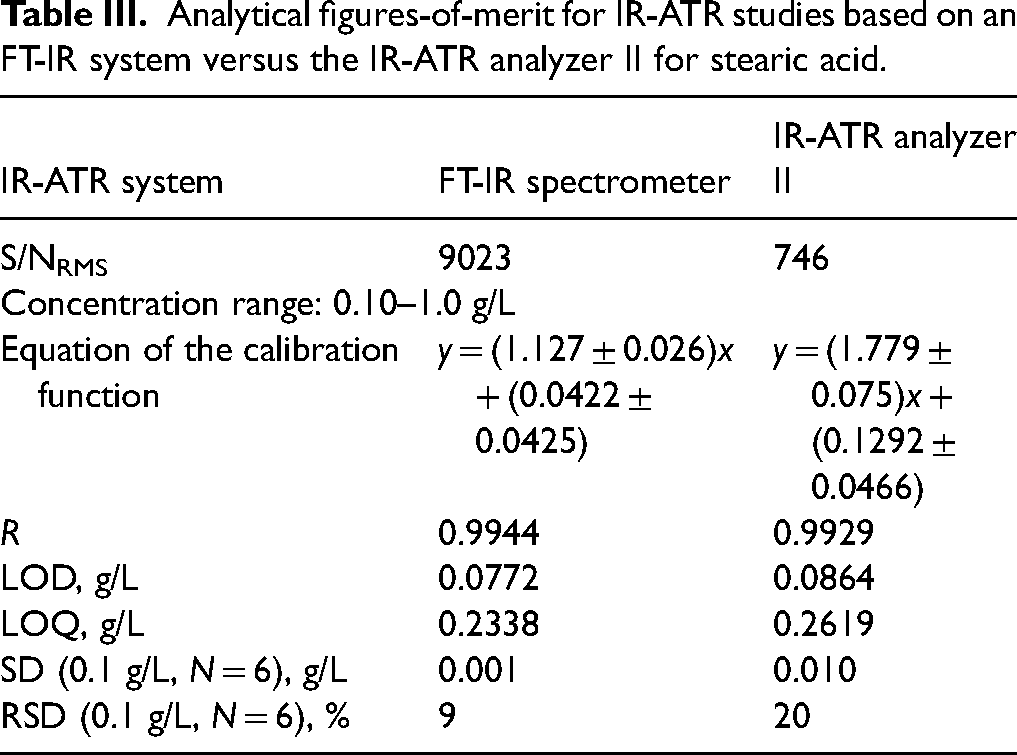
Calibration functions for the bands in the range of 2943–2848 cm–1 obtained from both experiments along with the derived analytical figures-of-merit are summarized in Table III. Both methods demonstrate linear behavior across the investigated concentration regime, which was confirmed by the obtained correlation coefficients >0.9900. LODs and LOQs for both devices are in the same order of magnitude. The S/N has been compared for both devices at the relevant wavenumbers. For the FT-IR system, S/NRMS (3000–2800 cm–1) = 9023, and for the IR-ATR analyzer II S/NRMS (21–75 pixels) = 746 was derived, respectively. Again, the IR-ATR analyzer shows the expectedly lower S/N, and consequently, slightly higher LOD and LOQ values.
Analytical figures-of-merit for IR-ATR studies based on an FT-IR system versus the IR-ATR analyzer II for stearic acid.
The FA content in fish is dependent on the fish type. The low or moderate lipid content for fish such as seabream, mullet, threadfish, etc. corresponds to approximately 0.51–7.35% of the entire fish mass, while fatty fish (e.g., salmon, mackerel, herring, sardines, etc.) are characterized by a lipid content of approximately 18–21%. 61 The FA composition of fish comprises 30–47% saturated FAs (SFAs), 12–38% monosaturated FAs (MUFAs), and 20–49% polyunsaturated FAs (PUFAs).
In the current study, FA at concentrations of 0.01–0.10% was successfully analyzed using the IR-ATR analyzer and the FT-IR system, which demonstrates the potential of qualitative and quantitative analysis of FA even for fish with low FA content. Of course, in real fish samples, other matrix components will interfere with the IR analysis. However, as shown in the literature using IR-ATR spectroscopy along with chemometric methods still allows reliably predicting concentrations of individual FAs and FA content in fish.62,63
It should be noted that milk also comprises different types of FAs, i.e., SFA, MUFA, and PUFA.64–67 FAs in fresh and thawed milked at concentrations of 0.35–22.09 g/L with a total amount of fat at 37.44 g/L have been analyzed and predicted using MIR and NIR spectroscopy, as reported by Coppa et al. 68 In the present study, concentrations at 0.01–1.0 g/L of FA were determined, which confirms sufficient sensitivity to analyze FAs in milk. Hence, it is anticipated that a portable IR-ATR system will prove its utility for detecting and quantifying FAs in liquid extracts or raw samples relevant to food and feed industries.
Deoxynivalenol in Methanol
Solutions of DON (0.050–0.500 g/L) in methanol have been analyzed after solvent evaporation using again both the FT-IR and IR-ATR systems. The associated spectrum at the highest concentration is shown in Figs. 6a and 6b, subject to S/N limitations for lower concentrations. The band with a maximum at 1685 cm–1 can be assigned to the C=O (carbonyl group) vibrations; the maximum at 1167 cm–1 corresponds to the antisymmetric C–O–C stretching; the band near 1069 cm–1 is assigned to the RCH–OH stretching; and the band at 956 cm–1 corresponds to C–O (epoxide ring) stretching.69–71 Again, due to the nonuniform spectral resolution of the IR-ATR analyzer some spectral features that are resolved by the FT-IR system collapse into broadbands. For establishing calibration functions, the band with a maximum at 1685 cm–1 (i.e., pixel 13) was selected.
Infrared attenuated total reflection (IR-ATR) spectra of DON after methanol evaporation (0.500 g/L) obtained using (a) the FT-IR system and (b) the IR-ATR analyzer I.
Calibration functions for IR-ATR spectra obtained with both systems along with the analytical figures-of-merit are summarized in Table IV. From the calculated correlation coefficients, it appears that the linearity of the calibration function for the IR-ATR analyzer was inferior to the FT-IR spectrometer. However, the LOD and LOQ remain comparable to the FT-IR approach.
Analytical figures-of-merit for IR-ATR studies based on an FT-IR system versus the IR-ATR analyzer I for DON.
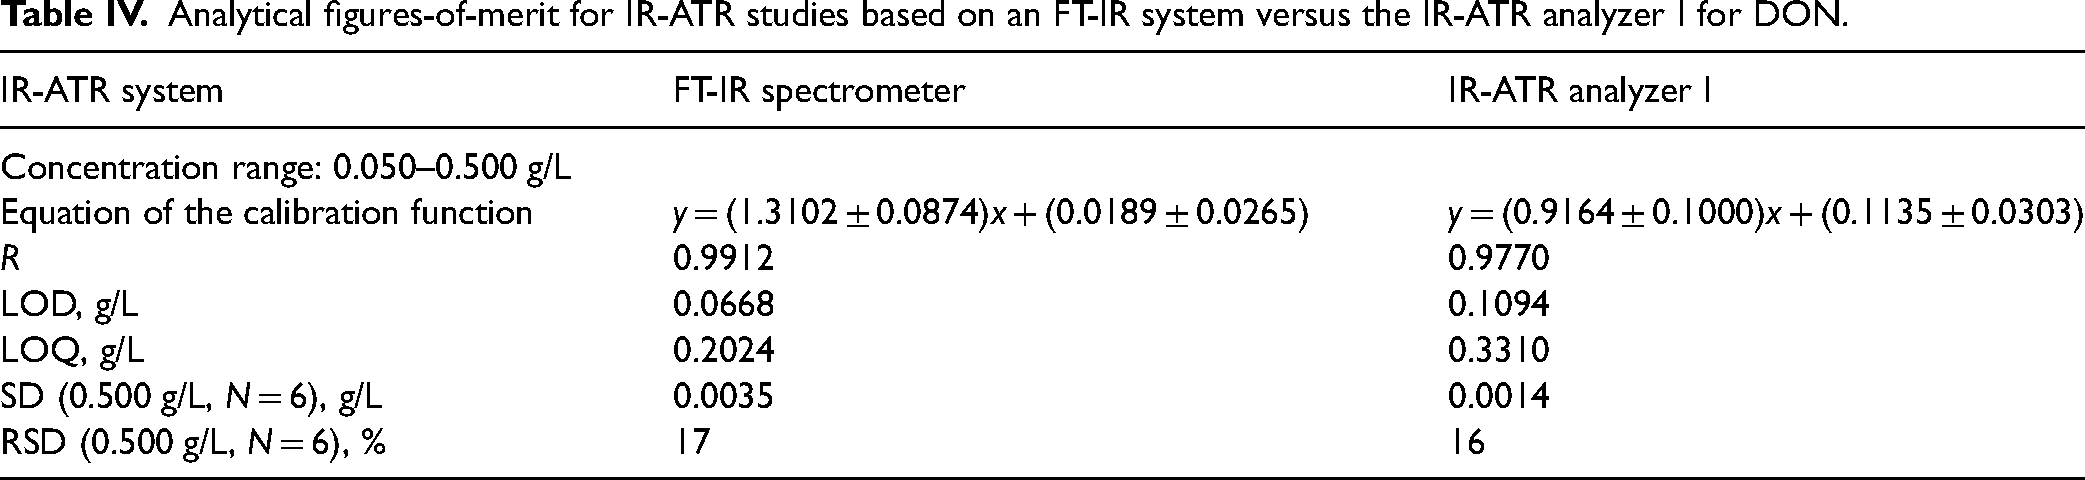
As shown during the present study, the IR-ATR analyzer performs similar or marginally worse than a laboratory FT-IR spectrometer except the spectral resolution, which is clearly inferior yet has no detrimental effect for liquid and solid samples. The derived figures-of-merit demonstrate that it is possible to conduct quantitative and qualitative analysis of mycotoxins in organic solvents (i.e., this would correspond to an extract from a real-world sample) at concentrations ranging at 0.050–0.500 g/L. The obtained results offer a promising perspective for rapid mycotoxin screening in commodities at in-field conditions. Notably, DON contamination values commonly analyzed in the field are in the range of 0.1–10 mg/kg, which is lower than the currently determined LOD and LOQ. However, it is anticipated that the combination with appropriate preconcentration and chemometrics strategies including but not limited to immunoaffinity enrichment or solid-phase extraction will lead to portable devices suitable for this task as well.18,52,72
Conclusion
In the present study, the utility of portable and compact IR-ATR systems was showcased, and the systems were benchmarked against conventional laboratory FT-IR devices likewise using IR-ATR technologies. The comparison confirms for several case studies including the detection of a mycotoxins, the analysis of FAs, and the quantification of organic solvents that indeed a broad range of applications in food and feed industries with compact IR-ATR analyzers can be envisaged. Of particular interest is the fact that the comparison of compact devices with conventional FT-IR spectrometers yields similar analytical performance characteristics, which facilitates a multitier analytical concept combining medium-resolution in-field data with high-resolution laboratory data, as recently proposed by the European Union project PHTONFOOD (No. 101016444). Moreover, we believe that the resolution of the compact IR-ATR systems can be further improved by using array detectors with an increased number of sensor elements (i.e., pixels).
All calculated figures-of-merit (i.e., LOD, LOQ, R, S/N, SD, and RSD) show the expected yet not detrimental differences, which confirms the perspective use of compact IR-ATR devices for in-field on-site rapid analysis with the required sensitivity, repeatability and accuracy ensuring food and feed quality/safety. It is anticipated that appropriately adapted multivariate data evaluation schemes considering limitations such as the nonconstant spectral resolution will further advance the utility of these devices in industrial monitoring and quality control scenarios. Future studies aim at analyzing more complex systems including real fish samples, and extracts from various cereals containing fungal contaminants/mycotoxins along with advanced data analysis approaches for the development of label-free rapid screening methods.
Supplemental Material
sj-docx-1-asp-10.1177_00037028231190660 - Supplemental material for A Portable Infrared Attenuated Total Reflection Spectrometer for Food Analysis
Supplemental material, sj-docx-1-asp-10.1177_00037028231190660 for A Portable Infrared Attenuated Total Reflection Spectrometer for Food Analysis by Polina Fomina, Antoni Femenias, Michael Hlavatsch, Julian Scheuermann, Nicolas Schäfer, Stephan Freitag, Nageshvar Patel, Achim Kohler, Rudolf Krska, Johannes Koeth and Boris Mizaikoff in Applied Spectroscopy
Footnotes
Declaration of Conflicting Interests
The author(s) declared no potential conflicts of interest with respect to the research, authorship, and/or publication of this article.
Funding
The author(s) disclosed receipt of the following financial support for the research, authorship, and/or publication of this article. This work was supported by the EU Horizon 2020 project PHOTONFOOD (No. 101016444) which is part of the Photonics Public Private Partnership and by the Research Council of Norway vias project SFI Digital Food Quality (DIGIFOODS) No. 309259 (grant numbers 101016444 and 309259).
Supplemental Material
All supplemental material mentioned in the text is available in the online version of the journal.
References
Supplementary Material
Please find the following supplemental material available below.
For Open Access articles published under a Creative Commons License, all supplemental material carries the same license as the article it is associated with.
For non-Open Access articles published, all supplemental material carries a non-exclusive license, and permission requests for re-use of supplemental material or any part of supplemental material shall be sent directly to the copyright owner as specified in the copyright notice associated with the article.