
Abstract
Attenuated total reflection (ATR) Fourier transform infrared spectroscopy (FT-IR) is used to characterize a vast array of materials at the molecular level in various industry types. Here we compare the performance of a portable spectrometer with a novel three-bounce–two-pass (3B2P) ATR scanning interface to the same device with a standard one-bounce (1B) ATR, and to a benchtop spectrometer with a 10-bounce (10B) ATR, in ideal sample–interface conditions and an applied dermatological study setting. In both application settings, the benchtop 10B ATR interface showed the highest signal-to-noise ratio (SNR), however, the novel 3B2P produced a six-fold increase in the sensitivity of the portable spectrometer when analyzing isopropanol and showed the greatest consistency of SNR of all devices when analyzing isopropanol and in vivo skin samples. Spectral data were sourced from a recently undertaken dermatological study involving a cohort of 180 healthy, full-term babies, using both 1B and 3B2P interfaces. Use of the 3B2P interface resulted in a 55% greater successful high-quality spectrum collection rate, compared to the 1B, and showed significantly superior SNR at both observed study time points, i.e., birth (1B: 68.37; 3B2P: 77.37), and at four weeks (1B: 74.53; 3B2P: 80.22). The utility of ATR FT-IR spectrometers as a dermatological clinical tool was also exemplified here, by quantifying the moisture level of newborn skin. By gathering rich spectroscopic data on the molecular structure of the skin, this technique holds great promise for the quantification of skin disease-specific biomarkers.
This is a visual representation of the abstract.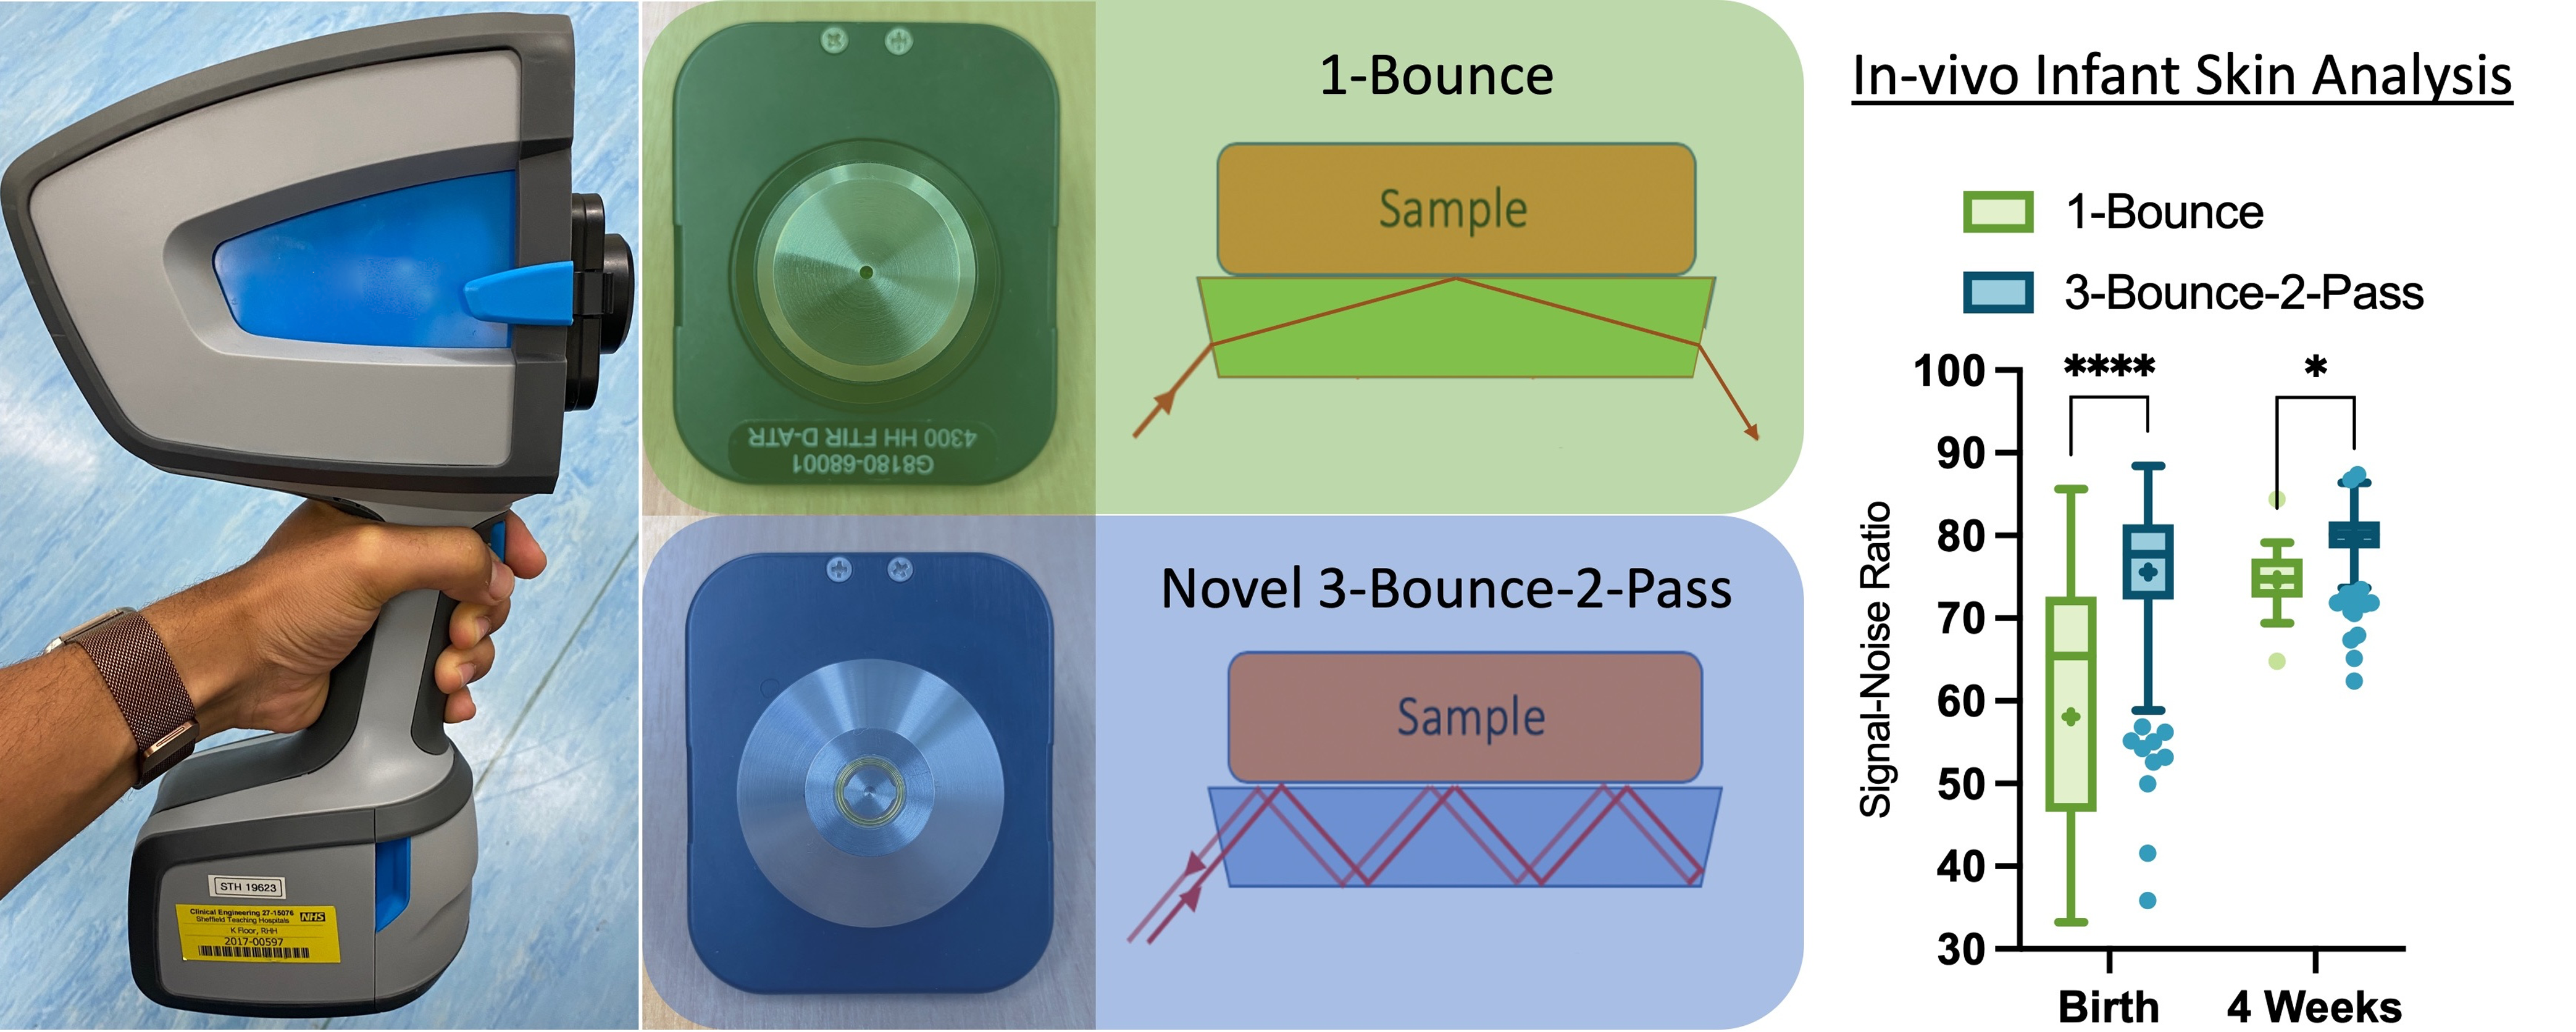
Keywords
Introduction
Fourier transform infrared spectroscopy (FT-IR) has been used historically in the chemical characterization of a diverse array of samples and has increasingly been used in the assessment of the skin since the 1990s.1,2 Attenuated total reflection (ATR) FT-IR is suited to dermatological research because researchers can ascertain the molecular structure of the stratum corneum (SC) in situ, without the use of pre-treatments such as dyes or tissue preservatives.3–5 Technological advancements continue to improve spectrometers, with new devices being able to scan at an increased spatial resolution, resulting in modern spectrometers with the capability to analyze micrometer-sized samples such as single cells in tissues and human skin in vivo.6,7 The optical setup of spectrometers affects the resultant spectrum collected, impacting overall performance. For example, mercury–cadmium–telluride (MCT) detectors are typically associated with greater sensitivity and faster scanning rates, in comparison to room temperature deuterated triglycine sulfate (DTGS) detectors, but require extensive cooling to prevent noisy signals. 8 The exact manner of IR–sample interaction also greatly impacts the spectra collected, as alterations in the angle of incidence and number of IR–sample bounces capable in ATR interfaces impact the depth of scanning and device sensitivity. 9
Attenuated total reflection (ATR) FT-IR has capabilities in the rapid identification of biomarkers linked to the pathogenesis of skin conditions such as atopic dermatitis (AD) 10 and could aid clinicians with diagnosis. Skin conditions are typically diagnosed through visual assessment methods which can be unreliable as many conditions exhibit similar pathologies, exemplified by one study of 769 clinic patients showing a 48.2% rate of misdiagnosis. 11 One key symptom of dry-skin conditions such as AD and psoriasis is dehydrated, flaky skin. Newborns are prone to dehydration, and an increased susceptibility to conditions such as AD, 12 which is highly prevalent in infants, affecting ∼1-in-3 children in the UK. 13 Dermatitis symptoms are commonly combatted with topical emollient creams and although some studies have found no link to treatment of infants with emollients and subsequent eczema onset in general populations,14,15 there is evidence that in children at high risk of eczema, through family history of the condition, early treatment can delay eczema onset and reduce overall severity of symptoms.16,17
In this study, we compare the performance of a novel three-bounce–two-pass (3B2P) ATR scanning interface to a standard one-bounce (1B) ATR accessory, fitted to a portable handheld spectrometer using either a cooled MCT or room temperature DTGS detector (Figure 1). Spectra were also compared to those collected on a research-grade benchtop FT-IR spectrometer with 10-bounce (10B) out-of-compartment horizontal ATR.
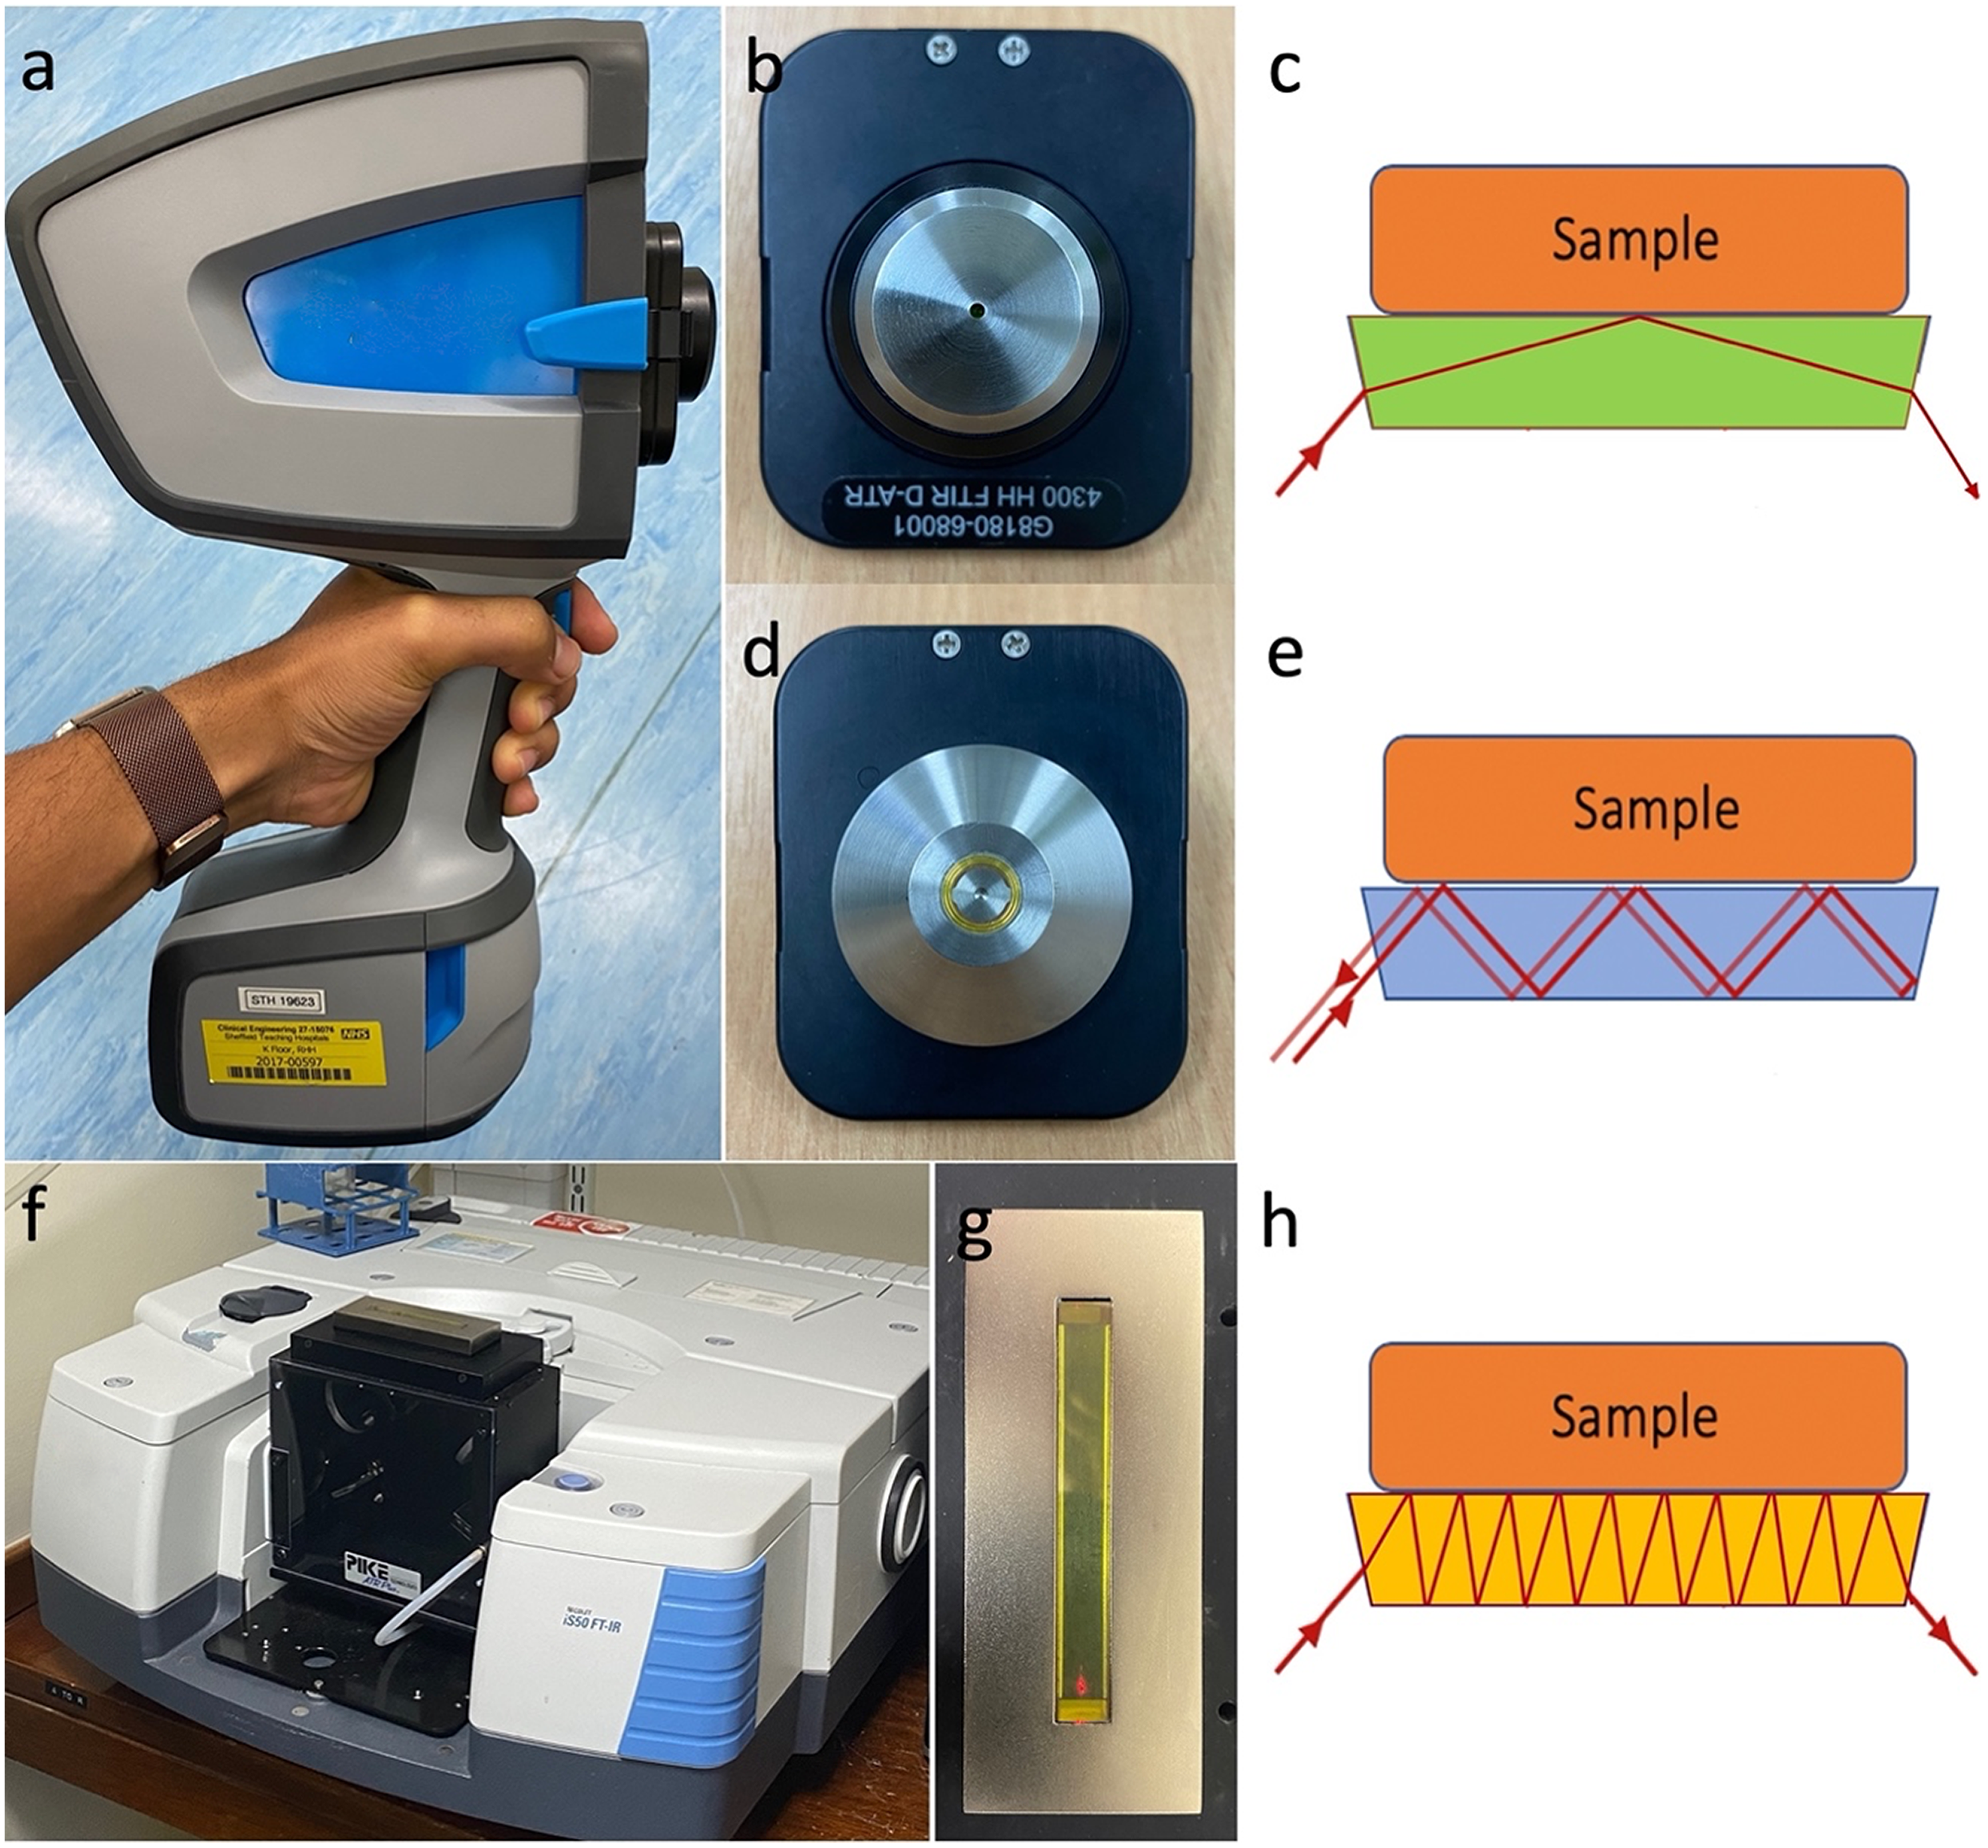
Devices compared during this study. (a) The portable spectrometer was fitted with either an MCT or DTGS detector and a (b) 1B or (d) 3B2P ATR interface. (f) The benchtop spectrometer was fitted with an MCT detector and a 10B ATR interface. Diagrams depict sample–IR interaction caused by ATR design in (c) 1B, (e) 3B2P, and (h) 10B ATR interfaces.
The devices were tested through spectral collection in ideal conditions, with theoretically perfect sample–crystal contact, and then applied to dermatological studies of the skin in vivo. Each device was assessed through peak area, signal-to-noise ratio (SNR), and the rate of successful spectrum collection when applied to the clinical study setting to investigate the utility of applying ATR FT-IR as a portable clinical tool for condition diagnosis and treatment. With improved diagnostics, we can identify biomarkers of disease earlier and improve the long-term health outcomes of patients.
Experimental
Materials and Methods
Infrared (IR) Spectroscopy
All spectrometers were used with the same set-up to ensure observed performance differences were due to interface and detector used. Mid-IR spectra were collected using a benchtop or handheld spectrometer fitted with an ATR interface. With all instruments, an average of 32 scans were collected for each measurement, with 32 background scans also collected prior to each mid-IR spectrum collected to minimize the impact of any atmospheric changes, at a resolution of 4 cm–1. Between measurements, the sampling crystal was cleaned with a 70% alcohol wipe. Background spectra were visually checked to ensure no sample remained on the crystal before a new spectrum was collected. Measurements were collected in the Skin Barrier Research Facility, in a temperature-controlled area maintained at 19–24°C and 30–60% relative humidity, except where sourced from the previously undertaken STAR clinical study.
Benchtop ATR FT-IR
The benchtop spectrometer used was the Thermo Scientific Nicolet iS50 fitted with a 10B zinc–selenide (ZnSe) ATR scanning accessory (Pike Technologies) and an MCT detector that was cooled with liquid nitrogen prior to sampling (Thermo Fisher Scientific). Nitrogen gas was used to purge the device and pumped into the spectrometer body at 25 psi for the duration of scanning to remove interference from local atmospheric gases (BOC Group Ltd).
Portable ATR FT-IR
The handheld spectrometer used was the Agilent 4300 fitted with either an MCT or DTGS detector, scanning with the 3B2P or 1B Diamond ATR crystal interface (Agilent Technologies).
Analysis of Mid-IR Spectra
Pre-processing of all spectra was done using Spectragryph (v.1.2.15, 2020, http://www.effemm2.de/spectragryph/) and quantification of peak intensities and locations was performed using Omnic 9.0 software (Thermo Electro Corp.).
ATR FT-IR Analysis of Isopropanol
Three replicate mid-IR spectra of isopropanol were collected at 10 min intervals over a 2 h test duration (Product code: 59300; Sigma-Aldrich).
ATR FT-IR Measurements of Human Adult Skin
Three replicate mid-IR spectra of in vivo human skin were collected at 10 min intervals over a 2 h test duration. Measurements from all devices were collected from the same skin site in one individual, located on the volar forearm, centered vertically. Topical solutions were not applied to skin test sites for at least 24 h prior to data collection.
Clinical Study Application: STAR
Spectral data were sourced from the STAR study, conducted previously. 18 The STAR study design was as follows: an observational study was undertaken of the skin of babies, wherein each participant underwent three skin-assessment sessions, over a 12-month period. During the assessment skin sites on the arms and legs were characterized to compare the structure of the skin in participants who went on to develop eczema to those who did not.
The study, entitled “A Longitudinal (12 Months) Investigation of Skin Barrier Development from Birth and the Validation of Early Predictors of Atopic Eczema Risk”, was conducted at the Jessop Wing Maternity Unit (Sheffield Teaching Hospitals NHS Foundation Trust) from April 2017 until December 2019. The National Research Ethics Service Committee East Midlands–Derby, approved the study under reference: 16/NW/0848. All subjects’ parents provided informed consent to participate, and the study was performed in accordance with the Helsinki Declaration of 1964, and later amendments.
A cohort of 180 healthy, full-term babies was recruited. Recruitment was open to mothers at least 18 years old, who were carrying singleton pregnancies, scheduled to give birth in the Jessop Wing maternity unit, and who lived a maximum of five miles from the University of Sheffield. The recruited babies were required to have been carried to full-term (≥37 weeks gestation) and able to have their first skin assessment within 72 h of birth. The participants’ parents were required to give informed consent before they could be enrolled in the study, after which basic demographic data were obtained such as date of birth, skin type, and ethnicity. Participants’ parents received remuneration for their participation in the study. Spectral data sourced from the STAR study were collected either in the Jessop Wing Maternity Unit (Sheffield Teaching Hospitals NHS Foundation Trust) (within 72 h of birth) or in the participants’ home (4 weeks after birth).
Statistical Analysis
All data were analyzed using Prism 9 (GraphPad Software). Comparisons between severity groups were made using ordinary analysis of variance function. The significance threshold was p < 0.05. Results are presented as mean ± standard deviation (SD) unless otherwise indicated.
Results and Discussion
Five ATR FT-IR configurations were compared based on their sensitivity, consistency, and overall performance. Sensitivity was characterized as absorbance, at designated frequency regions, quantified as peak area. Coefficient of variance (CV) provided a measure of consistency, with low inter-spectral variance indicating high device precision. The SNR 19 factors in signal interference and thus provides quantification of overall spectral quality or spectrometer performance.
Investigating Device Performance in Ideal Sample–Interface Conditions
To establish the performance of the 3B2P ATR interface under conditions of ideal sample-to-crystal contact the mid-IR spectrum of isopropanol was analyzed using a range of spectrometers and sampling interfaces: (i) The portable spectrometer with MCT detector and 1B interface; (ii) MCT detector and 3B2P interface; (iii) DTGS detector and 1B interface; (iv) DTGS detector and 3B2P interface; and (v) a benchtop spectrometer with MCT detector and 10B interface (Figure 1).
When assessing ATR FT-IR performance on a liquid sample, the configuration with the 10B and 3B2P interfaces (MCT or DTGS) shows higher sensitivity across the full spectrum than the 1B devices (Figure 2a), as indicated by the higher signal intensity.
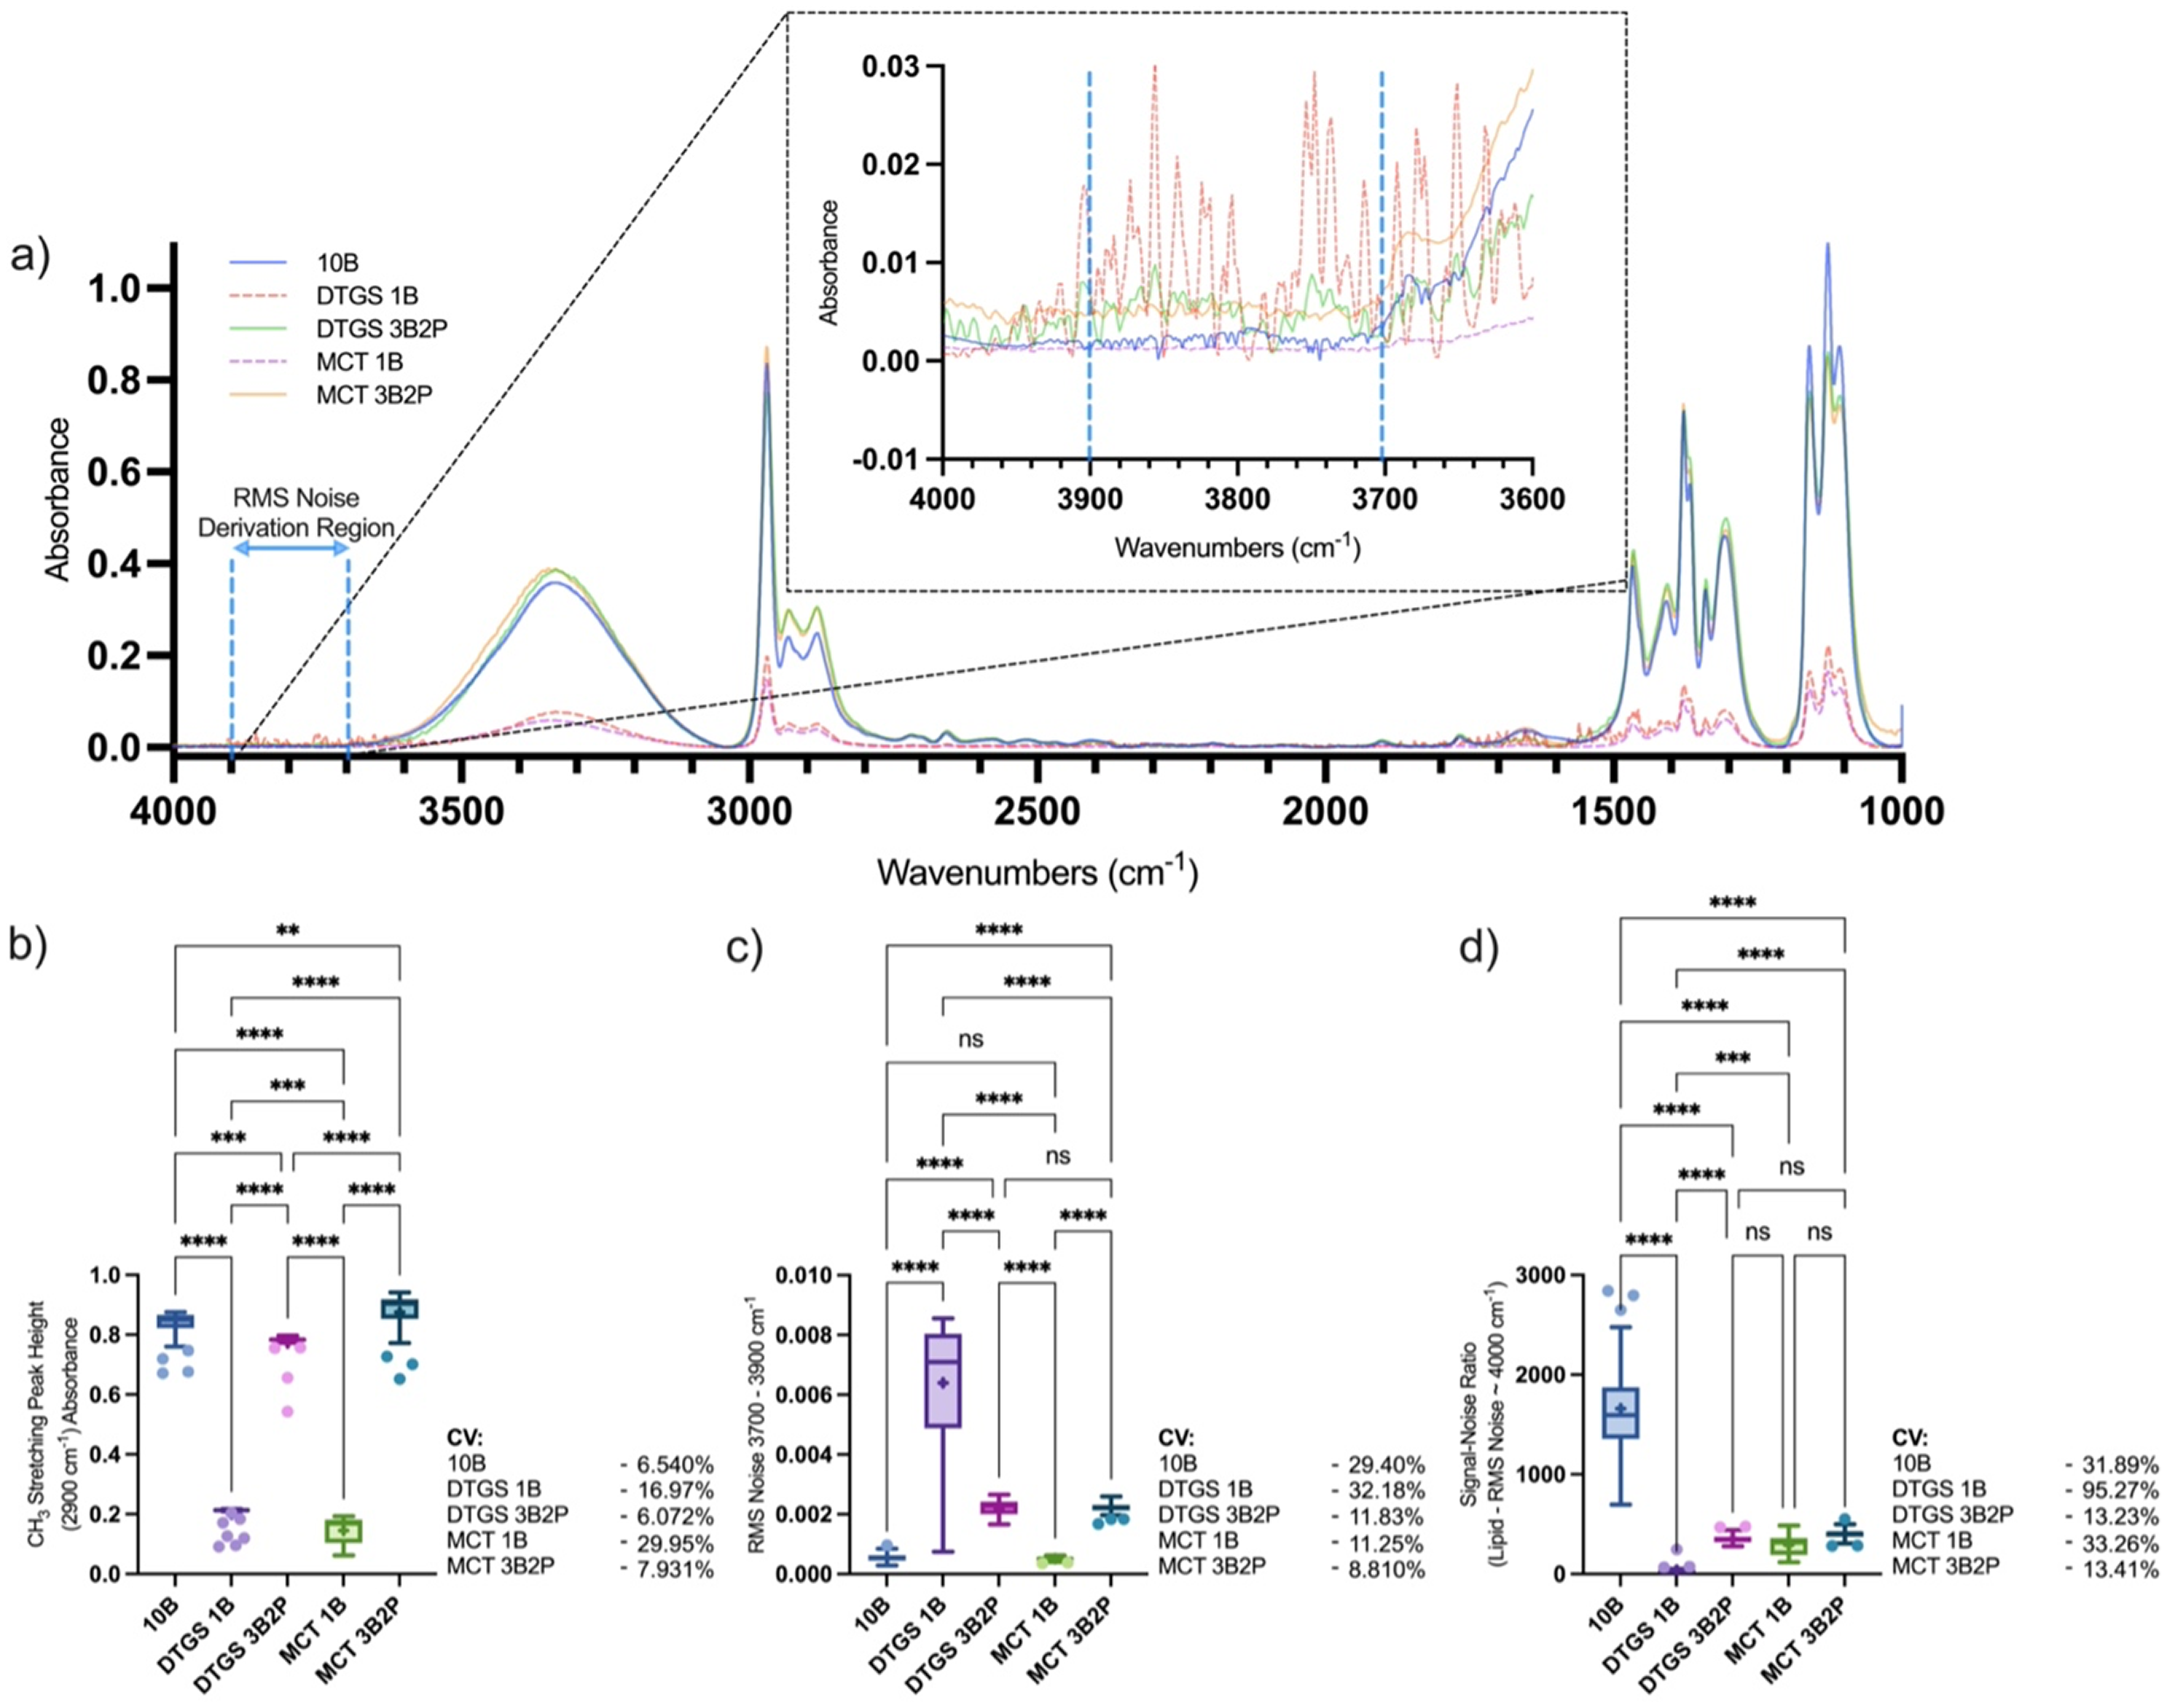
(a) Mid-IR average spectrum and quantified spectral regions of isopropanol; (b) CH3 stretching peak height at 2900 cm–1, (c) RMS noise at 3700–3900 cm–1, and (d) SNR defined as CH3 stretching peak height divided by RMS noise within 3700–3900 cm–1 region, collected using a benchtop spectrometer fitted with a 10B ATR interface or portable spectrometer (MCT or DTGS detector) fitted with a 1B or novel 3B2P ATR interface. Callout highlights selected regions for RMS noise calculation. Box-and-whisker plots depict the lower quartile, median, and upper quartile values present in each group, with outliers indicated by Tukey's post-test. +Indicates the mean value. Asterisks indicate the results of statistical testing (ns = not significant, *p < 0.05, **p < 0.01, ***p < 0.001, ****p < 0.0001). Average spectrum formed of 39 individual spectra collected in triplicate, every 10 min over a period of 2 h. Each individual spectrum collected is formed of an average of 32 scans. Each device was set to perform 32 background scans prior to sample scanning, with a resolution of 4 cm–1.
Visual assessment of the spectra was verified by quantification of a selected peak's height, where the 10B and 3B2P (MCT and DTGS) showed substantially higher (6.2× and 4.7×) absorbance at 2900 cm–1 (mean peak height absorbance of 0.83 ± 0.054, 0.88 ± 0.069, and 0.77 ± 0.047 absorbance, respectively) compared to the 1B configurations (0.15 ± 0.044 and 0.20 ± 0.034 absorbance) for the MCT and DTGS detectors, respectively (Figure 2b).
This equates to approximately six-fold more signal with the 3B2P compared to the 1B interface when using the spectrometer with the MCT detector, consistent with the increase in bounces across the sample surface. These findings are in agreement with Mossoba et al. 9 who quantified a five-fold increase in sensitivity when comparing the performance of a nine-bounce diamond ATR interface on a portable device compared to a benchtop 1B ATR spectrometer, in an in vitro study of trans fats. The CV was similar for the 10B and 3B2P interfaces irrespective of the detector used in both spectral regions assessed (6–8%) but significantly higher where the 1B interface was used (DTGS: 16.97%; MCT: 29.95%), indicating lower precision in measurement collection.
The SNR (Figure 2d) was calculated through the division of a selected peak's height by the root mean square (RMS) noise in the wavenumber region 3700–3900 cm–1 (Figure 2c), where no chemical species are absorbed in the sample. However, given that water vapor absorbs within the 3700–3900 cm–1 region and can impact the spectrum, new background spectra were collected prior to each measurement to minimize any impact of changing atmospheric conditions. The SNR of the 10B was superior to all portable 3B2P and 1B devices (10B: 1659 ± 529.2; DTGS 1B: 38.82 ± 36.98; DTGS 3B2P: 354.7 ± 46.92; MCT 1B: 290.7 ± 96.68; MCT 3B2P: 400.8 ± 53.76), which were found to perform similarly, with the exception of the DTGS 1B. The 3B2P showed the greatest consistency in SNR with 13.23 and 13.41% CV recorded for the DTGS and MCT devices, respectively, compared to 31.89% (10B), 95.27% (DTGS 1B), and 33.26% (MCT 1B).
Our isopropanol analysis concurs with the findings of Mossoba et al., 9 as a six-fold increase in sensitivity is seen, in terms of peak height, from the 1B to the 3B2P sampling interface in both the MCT and DTGS devices. However, the benchtop 10B device surprisingly showed similar sensitivity capabilities to the portable 3B2P, indicating that the relationship between sample–crystal interface size, through ATR bounce number, and sensitivity is not a linear relationship and that overall spectrometer composition contributes to sensitivity. Although spectral processing such as normalization would allow comparability of peak areas from 1B devices to 3B2P and 10B, the SNR values indicated that the amplification of noise would render the spectra of a lower overall quality. Overall, the novel 3B2P interface showed under ideal contact conditions, performance was elevated in sensitivity, SNR, and CV when compared to the 1B interface, both attached to a portable spectrometer. Whilst the benchtop 10B device exhibited the highest SNR, this did not translate into superior measurement accuracy as indicated by the comparable CV between measurements made with the 3B2P and 10B configurations.
Assessment of the 3B2P Interface Compared to the 1B in the Assessment of In Vivo Human Skin
The devices were then compared in the context of imperfect crystal–sample contact conditions in the form of in vivo volar forearm skin analysis. All measurements were collected from the same skin site, so the resultant variation is due to device and interface differences. Unlike when sampling isopropanol, skin–crystal contact alters with each measurement, therefore a relative approach to quantification is required, attained by equating the maximum absorbance or height, normalized to the amide II group of protein at 1550 cm–1.3,19–22 The resultant average spectrum collected from each device–interface combination is depicted in Figure 3a, where noise of the averaged spectra is visibly greater when collected with the 1B interface, compared to the 3B2P or 10B.
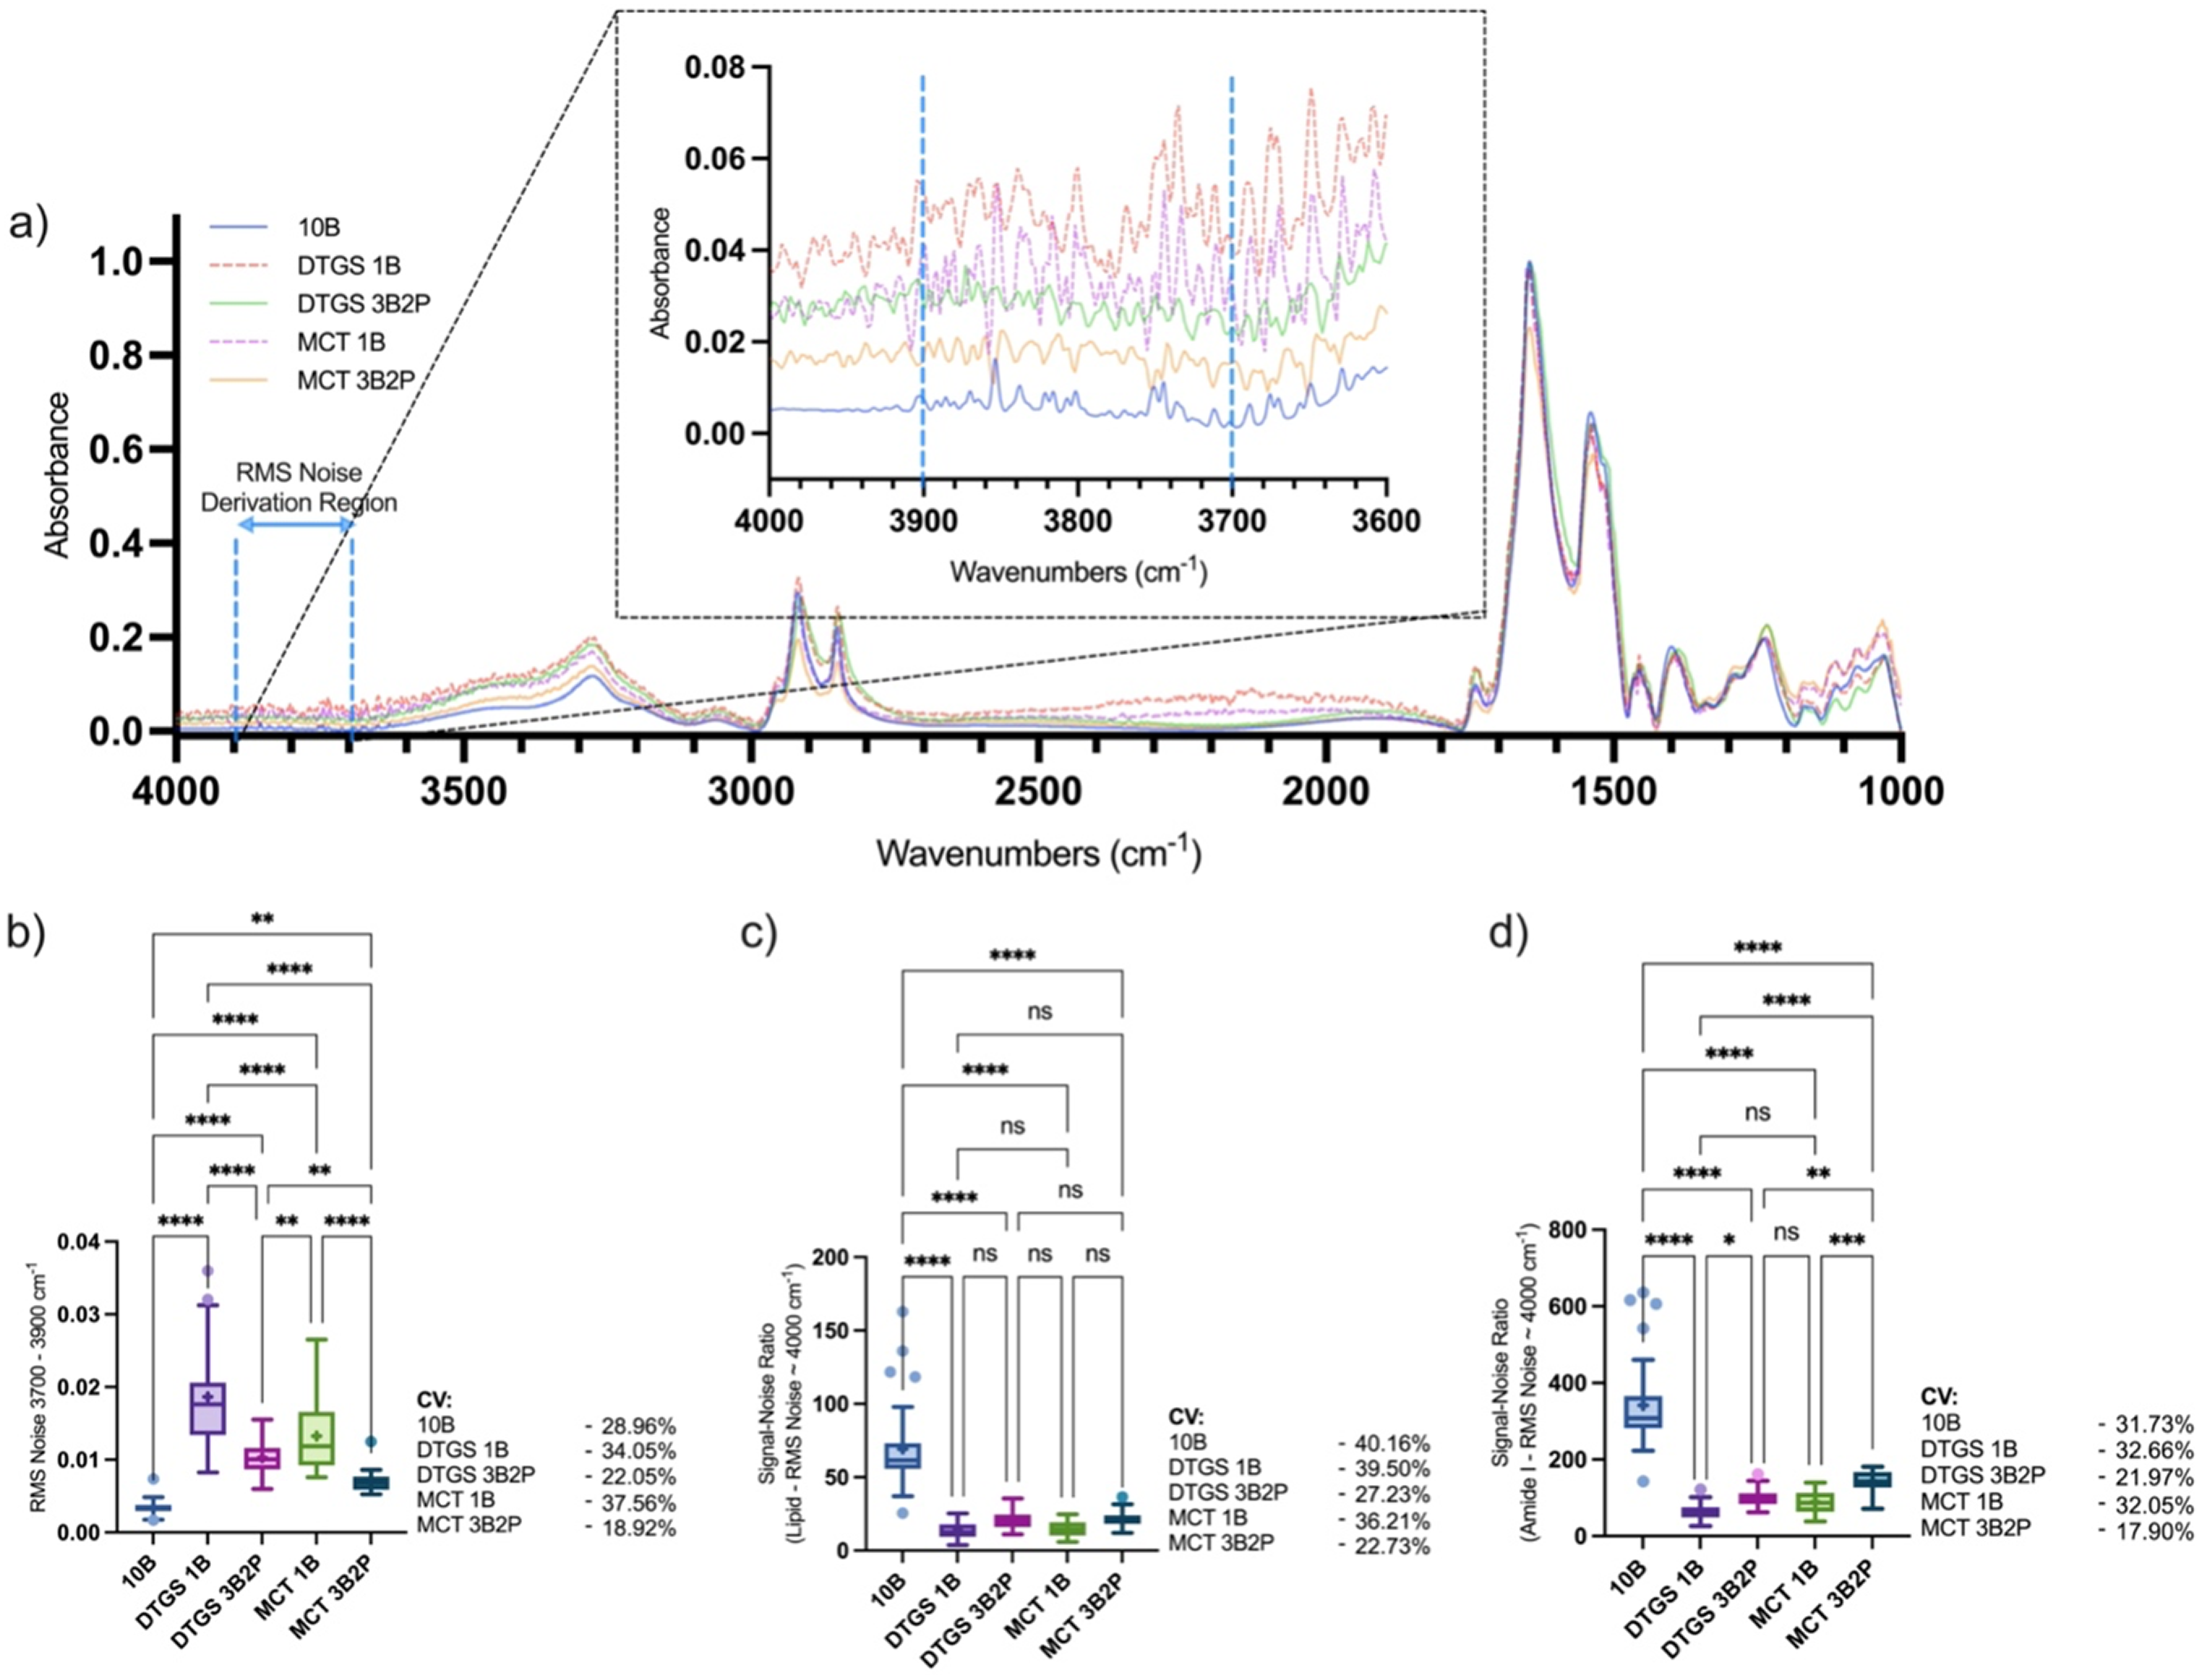
(a) Mid-IR average spectrum and quantified spectral regions of human skin; (b) RMS noise at 3700–3900 cm–1 with (c) SNR defined as 2850 cm–1 lipid or (d) 1650 cm–1 amide I peak height divided by RMS noise within the 3700–3900 cm–1 region, collected using a benchtop spectrometer fitted with a 10B ATR interface or portable spectrometer (MCT or DTGS detector) fitted with a 1B or novel 3B2P ATR interface. Callout highlights selected regions for RMS noise calculation. Box-and-whisker plots depict the lower quartile, median, and upper quartile values present in each group, with outliers indicated by Tukey's post-test. The + indicates the mean value. Asterisks indicate the results of statistical testing (ns = not significant, *p < 0.05, **p < 0.01, ***p < 0.001, ****p < 0.0001). Average spectrum formed of 39 individual spectra collected in triplicate, every 10 min over a period of 2 h. Each individual spectrum collected is formed of an average of 32 scans. Each device was set to perform 32 background scans prior to sample scanning, with a resolution of 4 cm–1.
Two bands were quantified relative to amide II, the lipid band at 2850 cm–1 and the amide I band at 1650 cm–1, to assess performance in different frequency regions which are both of interest in dermatological analysis; with the lipid band providing a measure of total lipids relative to protein in the superficial SC, 23 and amide I band which when normalized to amide II providing a measure of SC moisturization due to O–H scissoring/bending absorbance in the same region as amide I.10,24 As peaks have been normalized, the quantified area values no longer provide a basis for performance comparison, thus we have focused on consistency through SD and CV shown in Table I, and overall spectral quality through SNR (Figures 3c and 3d), using the RMS noise plotted in Figure 3b.
Table of SD and CV of two quantified spectral peaks (lipid C–H stretching peak area at 2850 cm–1 and amide N–H stretching peak and O–H scissoring area at 1650 cm–1) normalized to amide II at 1550 cm–1. Values calculated from 39 spectra, collected from the same volar forearm in vivo skin site, were recorded with five different ATR FT-IR spectrometer–interface combinations.
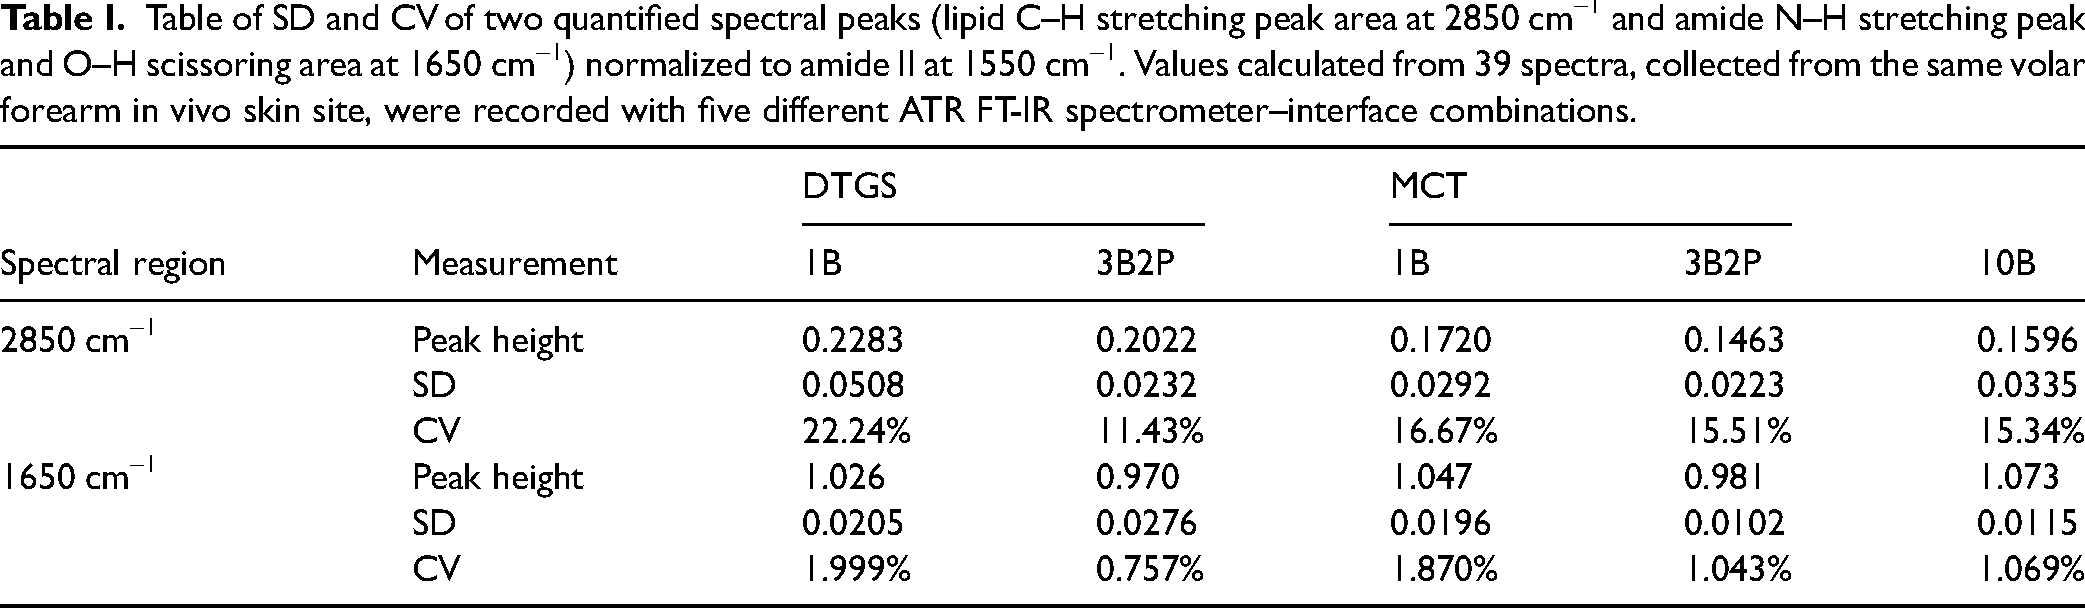
At 2850 cm–1, the quantified lipid band showed the 3B2P and 10B interfaces to perform most consistently. The DTGS 3B2P recorded the lowest CV (11.43%), followed by the 10B (15.34% CV) and the MCT 3B2P (15.51% CV). The 1B interfaces performed considerably worse in DTGS (22.24% CV) and slightly worse in the MCT (16.67% CV) devices. At 1650 cm–1, the normalized amide I band variance was lower overall, with the DTGS 3B2P interface performing best (0.757% CV). The CV for the 3B2P MCT configuration was similar to the 10B configuration (1.043% vs. 1.069% CV, respectively). As with the previously assessed region, the 1B device performed the least consistently (1.999% CV for the DTGS and 1.870% CV for the MCT version).
The SNR was reported at 2850 and 1650 cm–1 to assess performance across the full spectrum as different spectrometer configurations can result in altered sensitivity in certain frequency regions based on components and experimental set-up. 16
Direct comparisons between the benchtop and portable devices may not be relevant in terms of how increasing bounce number affects sensitivity as these devices have different configurations and components, which alter performance. Analysis of how bounce number or detector type affects sensitivity is more suited to comparing the same device, fitted with 1B or 3B2P ATR scanning interfaces and an MCT or DTGS detector. MCT detectors typically allow scans at a narrower frequency range, 1000–4000 cm–1, compared to 400–4000 cm–1 in devices with DTGS detectors, but are noted to be more sensitive and can scan at a greater rate. 25 Our results suggest slightly greater performance in skin analysis with an MCT detector, in terms of both SNR and CV when comparing MCT and DTGS devices with either scanning interface fitted, and the SNR was significantly greater with the novel 3B2P interface fitted when assessing the amide I at 1650 cm–1 toward the fingerprint region of the spectrum. The 3B2P interface also enhanced the precision of results, showing greater stability, with improved CV in DTGS and MCT devices when assessing both regions.
Comparison of 3B2P and 1B Interfaces During an Observational Cohort Study
Spectra were next collected in newborn babies as a practical test of clinical bedside use. Data analyzed here comprised 520 mid-IR spectra collected from the right volar forearm of newborn babies, within 72 h of birth and again after four weeks. A portable FT-IR spectrometer enables measurement collection in “out-of-lab” settings and thus was selected for use in this study, where measurements were undertaken on the ward at birth and in participants’ homes at four weeks for participant convenience and to facilitate study engagement. Spectra were included for analysis here if a satisfactory spectrum could be acquired at both time points, resulting in a cohort of 130 infants, with two measurements (before and after the skin site was cleaned with a 70% alcohol wipe) analyzed at both time points using either the 1B or 3B2P ATR interface, fitted onto the MCT version of the portable spectrometer. Overall parents of participants were content with the collection of spectral information, shown in over 90% of exit questionnaire responses (Table S1, Supplemental Material), recording “somewhat satisfied” or “extremely satisfied” with ATR FT-IR measurements throughout the study. The most frequent cause for complaint was the need for multiple repeats to collect an adequate spectrum, highlighting the need for improved sampling interfaces.
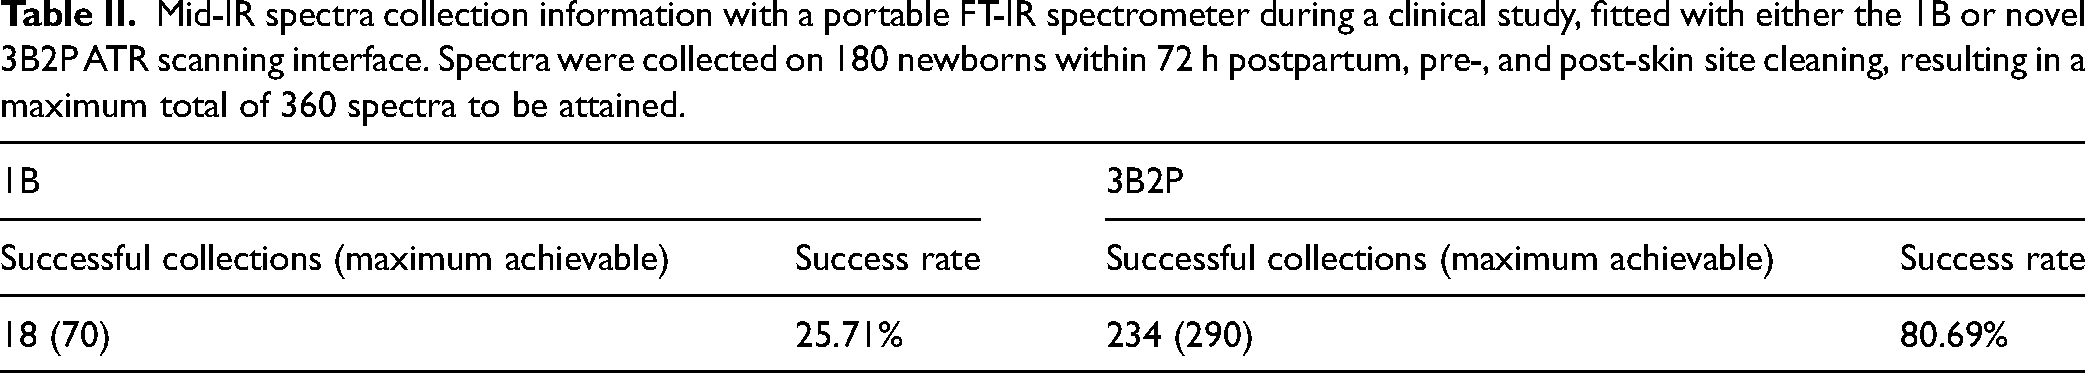
For the purpose of dermatological applications, spectrometers capable of collecting adequate spectra without the need for multiple repeats are essential, for both researchers and study participant satisfaction. Previous works have determined that crystal–sample contact is key in producing reliable spectra for analysis of skin using ATR FT-IR, so the useability of devices is a key factor for study success. 25 Here, up to four repeat measurements were permitted to attain an adequate spectrum, if previous attempts resulted in an SNR below one or clear negative peaks indicative of incorrect background collection. The spectrum collection success rate at the study visit just after the birth, of both devices, shown in Table II, and indicates the useability of both devices in a clinical setting by non-expert users, as all spectra were collected within the hospital wards during this time point. The 80.69% successful spectrum collection rate of the 3B2P compared to the 25.71% when using the 1B ATR interface was a key finding and highlights greatly enhanced feasibility of clinical use of the 3B2P.
Mid-IR spectra collection information with a portable FT-IR spectrometer during a clinical study, fitted with either the 1B or novel 3B2P ATR scanning interface. Spectra were collected on 180 newborns within 72 h postpartum, pre-, and post-skin site cleaning, resulting in a maximum total of 360 spectra to be attained.
The 54.98% increased spectrum collection success rate indicates a greater chance of collecting a high-quality spectrum and is validated by recorded SNR, calculated using the amide I peak as reference, which was significantly higher in the 3B2P at both time points (Birth: 1B–58.11, 3B2P–75.62; and four weeks: 1B–74.65, 3B2P–79.67) indicating greater spectral quality attained during measurement collection. Higher measurement precision was also seen when using the 3B2P interface during the clinical study with 27.25% lower CV (1B: 38.28% vs. 3B2P: 11.03%) at birth, reducing to a 1.74% (1B: 6.10% vs. 3B2P: 4.36%) better CV after four weeks (Figure 4a).
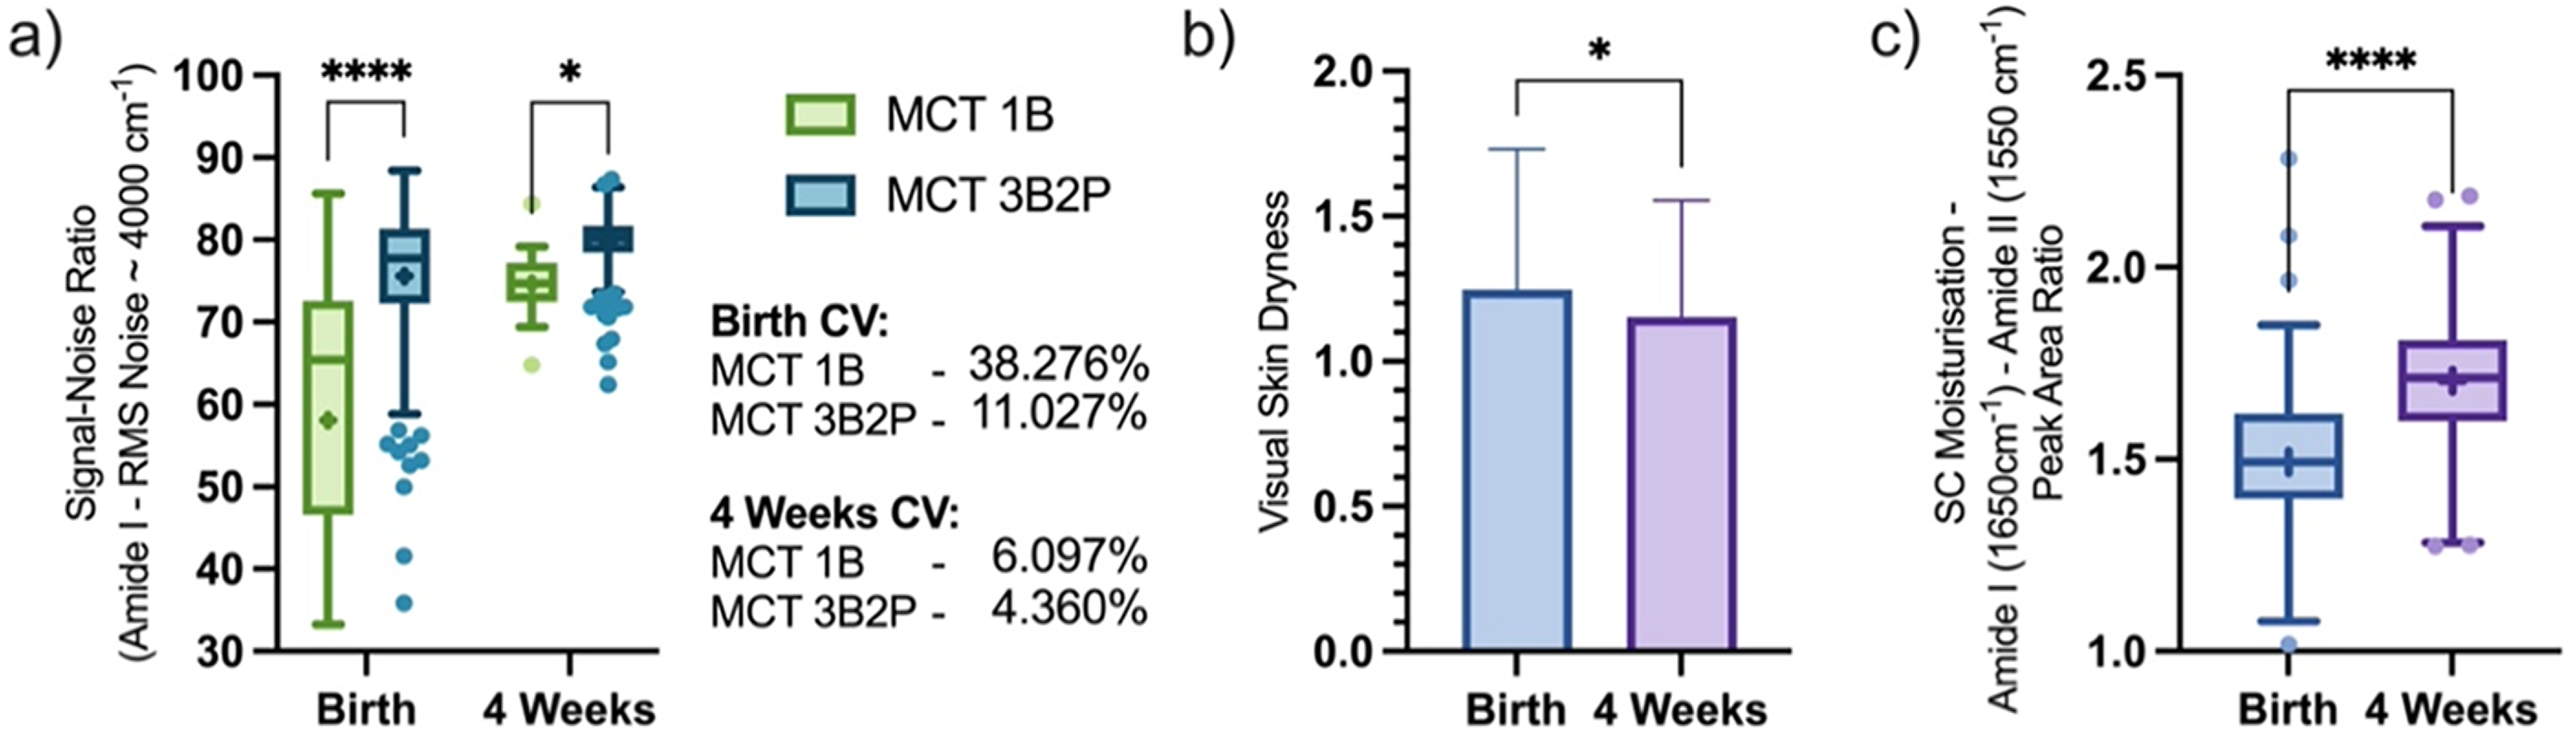
(b) Visually assessed skin dryness and device comparison of quantified spectral regions (a, c) of in vivo human volar forearm skin of newborns, collected in a clinical study setting at birth and four weeks postpartum using the 1B or 3B2P ATR interface; the SNR was defined as 1650 cm–1 amide I peak height divided by RMS noise within 3700–3900 cm–1 region (a), and SC moisturization defined as 1650 cm–1 amide I peak area normalized to 1550 cm–1 amide II peak area (c). Box-and-whisker plots depict the lower quartile, median, and upper quartile values present in each group, with outliers indicated by Tukey's post-test. The + indicates the mean value. Asterisks indicate the results of statistical testing (ns = not significant, *p < 0.05, **p < 0.01, ***p < 0.001, ****p < 0.0001).
Visual skin dryness assessments (Figure 4b) showed newborn skin became significantly less dry four weeks postpartum than at birth (1.25 ± 0.48 vs. 1.15 ± 0.40) and was then compared to mid-IR data collected during the study which yielded information regarding the SC moisturization using the neonate skin condition score criterium (detailed in Table S2, Supplemental Material). Using both 1B and 3B2P interfaces we saw a significant uplift in skin hydration in the cohort after four weeks (1.70 ± 0.16 AU), compared to birth (1.49 ± 0.20 AU) (Figure 4c). We have previously used the amide I band to monitor uplift in SC hydration in participants applying topical emollients to dry skin, 10 and our results here suggest ATR FT-IR can be used as a clinical tool to directly monitor infant skin hydration qualitatively, with greater sensitivity to subjective visual assessments, and potentially flag whether a child is deemed at high risk for eczema. This method could also monitor the effectiveness of any treatments targeted at increasing skin hydration. Studies of Raman spectroscopy in both adults and infants have shown that it is possible to achieve quantification of SC water content through spectroscopic methods.26,27
However, Raman spectroscopy typically uses a higher-power laser, up to class 3, 28 which exhibits a greater laser injury risk than the IR spectroscopy used here. Given this study required the use of non-expert users, collecting measurements from newborns in hospital wards, Raman spectroscopy was not considered for use here.
Conclusion
Under ideal sample–interface conditions we have shown the novel 3B2P ATR interface increased a portable spectrometer's sensitivity by ∼6× compared to the standard 1B interface, and sensitivity was compared to a benchtop 10B ATR spectrometer. Although the SNR was greatest in spectra collected using a benchtop spectrometer with a 10B interface, the portable spectrometer with a novel 3B2P interface showed the greatest measurement precision.
When applied to the analysis of skin, spectra were normalized to adjust for different sample–interface contact, rendering sensitivity equivalent. However, the 3B2P interface again showed greater consistency of quantified peaks when compared to the 1B interface fitted to the portable spectrometer. When assessing under ideal contact conditions, the 10B benchtop spectrometer acquired spectra with the greatest SNR, but the 3B2P showed the greatest consistency of all devices and produced spectra of significantly higher quality than the 1B, both when analyzing a single in vivo skin sample and during the newborn cohort study. The 3B2P interface brings the performance usually associated with a research-grade benchtop spectrometer to a portable instrument and enables new clinical applications. Here we show its utility for rapidly determining SC moisturization, and the rich spectral data on the molecular makeup of the SC promises wider uses. Moisture meters have wide dermatological applications, but current instruments based on capacitance or impedance are confounded by ingredients commonly found in topical products, limiting their application for evaluating the effects of topical interventions for skin dryness among other conditions. 29 SC hydration over the first four weeks of a child's life, when they are particularly susceptible to dry skin, maybe a useful biomarker for general skin health or to inform on the risk of dry skin conditions such as atopic eczema. Early interventions for eczema could potentially prevent or delay the onset of the disease.
Supplemental Material
sj-docx-1-asp-10.1177_00037028241289147 - Supplemental material for Neurodevelopmental Process Monitoring of Cytosine Arabinoside-Exposed Neurons Using Raman Spectroscopy
Supplemental material, sj-docx-1-asp-10.1177_00037028241289147 for Neurodevelopmental Process Monitoring of Cytosine Arabinoside-Exposed Neurons Using Raman Spectroscopy by Kosuke Hashimoto and Hidetoshi Sato in Applied Spectroscopy
Footnotes
Acknowledgments
We would like to thank all volunteers for their participation in the STAR Study, as well as staff at the Jessop Wing Maternity Unit, Sheffield for their help with measurement collection, namely; Hilary Rosser, Sarah Senbeto, Beth Lally, and Natalie Khoaz. We would also like to thank Agilent Technologies for providing us with the handheld spectrometer for research purposes, and everyone in the Field Detection team for their time and assistance in spectrometer use and data analysis. SFW thanks the Engineering and Physical Sciences Research Council for PhD studentship funding.
Data Availability Statement
The data used to support the study findings is available from the author upon reasonable request.
Author Contributions
Samuel F. Williams contributed to the investigation, data curation, formal analysis, and writing—original draft, review, and editing. John Chittock, Kirsty Brown, and Linda J. Kay contributed to the investigation (STAR Study). Michael J. Cork contributed to supervision and conceptualization. Simon G. Danby contributed to supervision, conceptualization, and writing—review and editing.
Declaration of Conflicting Interests
The authors declared no potential conflicts of interest with respect to the research, authorship, and/or publication of this article.
Funding
The authors disclosed receipt of the following financial support for the research, authorship, and/or publication of this article: This work was supported by the Engineering and Physical Sciences Research Council (grant number EP/R513313/1).
Supplemental Material
All supplemental material mentioned in the text is available in the online version of the journal.
References
Supplementary Material
Please find the following supplemental material available below.
For Open Access articles published under a Creative Commons License, all supplemental material carries the same license as the article it is associated with.
For non-Open Access articles published, all supplemental material carries a non-exclusive license, and permission requests for re-use of supplemental material or any part of supplemental material shall be sent directly to the copyright owner as specified in the copyright notice associated with the article.