
Abstract
Previous research on predictors of populism and nativism has predominantly focused on socio-economic (e.g., education, employment, social status), and socio-cultural explanations (e.g., social identity and social status). In recent years, however, the role of negative emotions has become increasingly important in the study of populism and related concepts. In the current study, we examined two distinct negative emotions: anxiety and anger. We collected survey data from participants in 15 European countries (N = 7,726) and tested three sets of measures reflecting different explanations, economic (e.g., education), socio-cultural (e.g., social identity), and emotional in predicting populist attitudes (compromising items on anti-elitism and people-centrism) and nativism. We tested these different predictors using structural equation modeling (SEM). The results of our basic SEM models show that negative emotions (anxiety and anger) predict both populist attitudes (people-centrism and anti-elitism) and nativism. In particular, anxiety predicts anger, which in turn predicts both populist attitudes and nativism. In our advanced SEM models, people-centrism was predicted by anger and social identity, whereas nativism was predicted by anger, anxiety, social identity, and education. Our study shows that negative emotions (anger, anxiety) are much better predictors of populist attitudes and nativism than mere socio-economic and socio-cultural factors.
The Upsurge of Populism
Populism has been on the rise across Europe for some time (Rooduijn & Akkerman, 2017), and numerous studies in communication science, political science, psychology, and sociology have been published to explain populism, ranging from the political system and opportunity structures (Salmela & von Scheve, 2018), the role of the media (Aalberg & de Vreese, 2016; Krämer, 2014; Schaub & Morisi, 2019; Schulz, Wirth, & Müller, 2018), communication styles (Abadi, 2017; Busby et al., 2019; de Vreese et al., 2018; Nai, 2018), public health inequality (Lindström, 2020), political participation (Zaslove et al., 2020), and individual factors, such as personality traits (Bakker et al., 2016), or lower cognitive abilities (Hodson & Busseri, 2012). As part of the Triple Special Issue “The Emotional Side of Populist Support: Key Affective Mechanisms at Test,” the study at hand takes a look at the far less investigated role of emotional underpinnings of populism.
There is much debate about the precise conceptualization of populism (see Hameleers et al., 2017; Hameleers, 2018; Schulz, Müller, Schemer, et al., 2018; Wirth et al., 2016; Wirz, 2018), and whether it should be considered a style, a strategy or an ideology. In this study, we do not focus on populist leaders or populist messages, but on citizens’ support for populist viewpoints (i.e., populist attitudes). We examine three types of explanations that have previously been offered for citizens’ populist views (see also Kyle & Gultchin 2018; Oesch, 2008). The first relates to socio-economic factors, implying that economic hardship, such as poverty and unemployment, is the main reason why people would adopt populist perspectives. The second refers to socio-cultural determinants, that is, the loss of cultural values, or threats to one’s social identity. The third focuses on the role of negative emotions, implying that societal events can trigger negative emotions, such as anxiety or anger, which would explain people’s support for populist attitudes.
These three types of explanations are not mutually exclusive and may be equally important. However, to date, socio-economic, socio-cultural, and emotional factors have not been examined simultaneously in the same study with the same sample, making it challenging to compare each of these sets of predictors in explaining populist attitudes. Therefore, in the current study, we include various socio-economic, socio-cultural, as well as emotional measures within a large, cross-national sample, and compare the contribution of each of these measures in explaining citizens’ populist attitudes. In addition, we include the resurgent political concept of nativism, which can be vaguely described as “ethnic nationalism,” into our study and compare it to populism, by examining how it is predicted by the same three aforementioned factors. Similar to the nationalist-conservative rationale of populism, nativism implies an opposition between social groups: the “benign natives” (i.e., the natives) versus the “malign non-natives” (i.e., the immigrants or the elites).
Conceptualizing Populism
Although there is much debate about the precise conceptualization of populism (see Hameleers et al., 2017; Hameleers, 2018; Schulz, Müller, Schemer, et al., 2018; Wirth et al., 2016; Wirz, 2018), there is a growing consensus that populism is defined by the opposition between “the people” and “the elites” (e.g., Rodrik, 2020; Zaslove et al., 2020). This consensus is based in part on the description of populism as “. . .a [thin-centered] ideology that considers society to be ultimately separated into two homogeneous and antagonistic groups, the ‘pure people’ versus the ‘corrupt elite’, and which argues that politics should be an expression of the general will of the people” (Mudde, 2004, p. 543). At the individual level, a populist ideology can be conceptualized as attitudes that reflect the core elements of populism. In studies measuring populist attitudes, populism is considered a multidimensional concept and at least three dimensions have been distinguished (e.g., Akkerman et al., 2014; Castanho Silva et al., 2018; Schulz et al., 2018): people-centrism, anti-elitism, and Manichean outlook (Castanho Silva et al., 2019). People-centrism refers to the will of the people as the highest principle, implying that the people should have a more prominent role in political decisions. Anti-elitism is the idea that there is an elite, distinct from the ordinary people, forming the political establishment. Sometimes, other social groups are also included as elites, such as academics, experts, or interest groups (Akkerman et al., 2014). Finally, the anti-pluralist dimension is operationalized as the division of groups into good and evil, also referred to as the Manichean outlook, which implies that the ordinary people are morally superior to the elites. Within the so-called ideational approach, populism is defined as a limited set of ideas about society based on people-centrism, anti-elitism and Manichean outlook. According to this definition, an ideology is populist when all three elements are present (Hawkins & Rovira Kaltwasser, 2018; Mudde & Rovira Kaltwasser, 2018).
Conceptualizing Nativism
One concept related to populism that to date has not been much studied as a measure is nativism. Mudde (2007, p. 19) defines nativism as “an ideology, which holds that states should be inhabited exclusively by members of the native group (‘the nation’) and that non-native elements (persons and ideas) are fundamentally threatening to the homogenous nation-state.” Moreover, he argues that nativism (and not populism) is the ultimate core feature of the populist radical right ideology (Mudde 2007, p. 26).
The main difference between populism and nativism is the “us” versus “them” dichotomy; nativism considers racial and cultural natives as “in-groups,” whereas racial and cultural others are described as “out-groups” (e.g., Newth, 2021). Populism distinguishes between the “pure people” and the “corrupt elite” (Mudde, 2004, p. 543).
Nativism focuses on the idea that people who are native to a country believe they have more rights to be treated fairly, and to receive preferential treatment when living in the country of their birth (Hochschild, 2018). In fact, one prominent argument of five European populist radical right parties (Ivaldi & Mazzoleni, 2020) is that the economic prosperity of the heartland should be defended against the elite and immigrants. Natives should protect their economic interests because their ancestors built the country (Betz, 2017; Heiss & Matthes, 2020; Hochschild, 2018; Mudde, 2012), whereas “foreigners” and elites behaving in a “foreign” manner are seen as a threat to the native nation (see Kešić & Duyvendak, 2019).
Recent research has described both populism and nativism as binary moral frameworks based on an antagonistic relationship between “us” and “them” and has called for a more comprehensive measure of populism by taking nativism into account (Rooduijn et al., 2021). The aforementioned ideational approach has gained increasing support because it allows for the investigation of both the supply side (e.g., populist actors and parties) and the demand side (populist attitudes) of populism (Hawkins & Rovira Kaltwasser, 2018; Hawkins et al., 2020).
However, many scholars have recently called for distinguishing populism from related ideational constructs, such as nativism (Bonikowski, 2017; Clark & Rohrschneider, 2021; De Cleen et al., 2018; Rooduijn, 2019). Therefore, we are interested in comparing the concept of nativism as a specific measure of the populist radical right ideology with the measure of populist attitudes and to determine to what extent the different predictors of the two concepts actually differ.
The Role of Socio-Economic Factors
The first explanation of the support for populist arguments relates to socio-economic factors. At the individual level this economic hardship would explain the distrust of poor and low-educated people toward the government and the elites. Indeed, previous studies have shown that economic insecurity, based on unemployment, precarious job prospects, or low income, is strongly associated with support for right-wing populist parties (e.g., Lubbers et al., 2002). Increased economic uncertainty, especially for relatively low-skilled workers would be consistently associated with the growth of a right-wing populist electorate (e.g., Betz, 2018; Jay et al., 2019; Lubbers et al., 2002; Oesch & Rennwald, 2018; Sprong et al., 2019; Swank & Betz, 2003). In addition, unemployment indicators are also important sources of individual perceptions of economic hardship. This points to the importance of relative deprivation, namely the subjective assessment that one or one’s social group is worse off compared to other individuals or groups (Burgoon et al., 2019; Ellemers, 2001; Rooduijn & Burgoon, 2018; H. J. Smith & Ortiz, 2002).
Thus, based on previous research, we expect that uncertain economic prospects, as indicated by unemployment or low educational attainment, may partly explain populist attitudes.
The Role of Socio-Cultural Factors
The second type of explanation for the support for populism relates to socio-cultural determinants, that is, the loss of cultural values, or threats to one’s social identity (e.g., Hochschild, 2018). According to modern versions of social identity theory (Brown, 2000; Hogg, 2001, 2002), people derive their psychological well-being and self-esteem not only from feeling good about themselves as individuals but also from the important social groups or country to which they belong. This social identity becomes even more important in times of rapid and recurrent social change, be it a terrorist attack, the influx of refugees, a global pandemic, or an economic or political crisis. People begin to feel threatened not only because of their personal vulnerability but also because their very own social identity becomes the target of unpredictable change. People who perceive themselves to be at the bottom of the social hierarchy are particularly sensitive to threats to their social identity, which is often more positive than their personal identity. Questions about who they are, where they come from, and what kind of society they live in, all become more salient when their own personal situation is negative and uncertain. The salience of one’s social identity is further enhanced by populist communicators’ use of social identity cues (see Bos et al., 2019; Huguet-Cabot et al., 2021), interpreting their situation as victims of unpredictable societal changes (Abrams & Hogg, 2010; Brown, 2000; Hogg, 2001, 2002), whereas disparaging the out-group (in-group favoritism versus out-group derogation). In other words, the populist feature of “us” versus “them” reasoning (social categorization) can thus be seen as a direct result of the perceived threats to one’s social identity (see also Elad-Strenger & Kessler in this Special Issue, Part One).
In sum, one’s perceived status in the social hierarchy as well as the identification with one’s cultural homeland are both indicators of a socio-cultural explanation. We expect that the stronger one’s social (national) identity, and the lower one’s perceived social status, the more likely one is to be attracted to populist attitudes.
The Role of Negative Emotions
Lately, several scholars have argued for paying more explicit attention to the role of emotions in explaining support for populist attitudes (e.g., Rhodes-Purdy et al., 2021; Salmela & Von Scheve, 2017). The importance of emotions in the development of populist attitudes, extremism, or negative attitudes toward out-groups has been demonstrated in several lines of research. First of all, it has been shown that populist messages contain more emotional appeals than messages from non-populist leaders. More specifically, populist rhetoric is more negative and contains more character attacks and fear messages (Bos et al., 2019; Hameleers et al., 2019; Hameleers et al., 2017; Nai, 2018). Wirz et al. (2018) further showed that conflictive populist appeals (but not advocative appeals), in which elites are discredited and blamed for people’s misery, elicited both more anger and fear, when compared to pluralist appeals. However, populist attitudes only moderated the relationship between conflictive messages and anger: individuals with strong populist attitudes felt more anger, but not fear, in response to the conflictive messages, and also agreed more with the policies promoted in these messages. Thus, this persuasive effect did not hold for fear either. In support of the more prominent role of anger, further research (Rico et al., 2017; 2020) also showed that anger, and not fear about the economic crisis was significantly associated with populist attitudes in Spain (see also Filsinger, 2025 in this Special Issue, Part Two; Rico, 2024, Part Three).
Thus, these studies suggest that anger and fear may play different roles in populist support, which may be explained by their core appraisal components (i.e., core relational themes; Lazarus 2001; Smith & Lazarus, 1993). Two defining components of emotional experience are appraisals and action tendencies (Frijda, 1986; Scherer et al., 2001). Appraisals refer to the interpretation of a situation in light of one’s own concerns, and action tendencies refer to the motivation to respond in a certain way to the change in one’s environment. The core appraisal of anxiety is threat. Feelings of anxiety imply that, for example, societal changes, such as climate change or the arrival of immigrants, are perceived as a threat to one’s social identity and access to resources (see also Hochschild, 2018; Huguet-Cabot et al., 2021; Nguyen et al., 2022; Wirz et al., 2018). Other appraisals of anxiety include uncertainty and a lack of control over unpredictable future events (see Roseman, 2001; Roseman & Smith, 2001). The core relational theme of anger, on the other hand, is other-blame (Lazarus 2001; Smith & Lazarus, 1993). Anger is elicited when one’s goals are frustrated, or norms are violated by others, which is appraised to be caused by others rather than by oneself. In contrast to anxiety, anger is further characterized by appraisals of control: one believes that one is able to remove the goal blockage, resulting in an action tendency to (verbally or physically) attack, protesting against, or criticize others (e.g., Frijda, 1986; Fischer & Roseman, 2007; Moors et al., 2013; Roseman, 2001).
The different appraisal patterns of anger and anxiety may explain why previous studies of populist attitudes and negative emotions have found a more prominent role for anger than for anxiety (Rico et al., 2017; Wirz et al., 2018). Populist rhetoric emphasizes goal blockage that is the fault of elites or corrupt governments, which is perfectly consistent with the core appraisals of anger rather than anxiety. Several scholars have argued, however, that anxiety should not be overlooked because it may be the underlying sentiment on which other emotions are built. Salmela and von Scheve (2017), for example, argue that in the case of right-wing populism, the mechanism of ressentiment transforms insecurity and fear through repressed shame into more generalized anger and resentment (see also Nguyen et al., 2022). In other words, even if anger may be more closely associated with populist attitudes, anxiety may still be a necessary condition for supporting populist arguments. Anxiety may be a response to negative socio-economic or socio-cultural circumstances. Poverty, low levels of education, and a dead-end low income may lead to constant worry about one’s financial situation. Such worries and anxieties about the future can easily feed people’s anger about their situation, especially if politicians pave the way for such a framework of anger.
Although several different emotions have been recently studied in the context of populism (see also Salmela & Capelos, 2021), in the current study, we focus on anxiety and anger. Both anger and anxiety are considered prominent emotions (e.g., Abadi et al., 2021; Huguet-Cabot et al., 2021; Nguyen et al., 2022; Rico et al., 2017; Wirz et al., 2018), as evidenced by research on the emotional content of populist messages, predictors of support for populist parties, anti-immigrant sentiments, or populist attitudes in general.
The Current Study
In the current study, we compared socio-economic, socio-cultural, and emotional predictors, indicating the different types of explanations. To the best of our knowledge, this is the first large-scale study to comprehensively analyze the relation between variables that simultaneously tap these three different explanations. Socio-economic variables were measured at the individual level (Education and Employment of the participants). Socio-cultural variables were measured using two existing scales: Subjective Social Status and Social Identity (operationalized as the identification with one’s current country). Emotional factors included Anxiety, measured by core appraisals of threat, and Anger, as measured by core appraisals and action tendencies. Asking respondents to report their appraisals and action tendencies is a common way of operationalizing emotions in questionnaires (Schorr, 2001).
We wanted to study populist attitudes in a diverse sample and therefore included respondents from 15 European countries. Although there are differences between these countries in terms of the history, size, and nature of populist movements or parties, there are also large similarities. All of the countries included have populist parties, varying in size and position of power, that are characterized by the core elements we have identified. Thus, we do not focus here on cross-national differences because we are interested in the more general pattern of relations between citizens’ socio-economic position, social identity, and emotions as potential predictors of populist attitudes. However, these three explanations may not be mutually exclusive, especially since negative emotions and their appraisals may arise from economic deprivation or a sense of loss of socio-cultural values. Therefore, we will also examine how emotions may mediate the role of socio-economic and socio-cultural factors.
Our quantitative analyses are guided by the following research questions:
RQ1. How do socio-economic, socio-cultural, and emotional measures predict populist attitudes and nativism?
RQ2. How do anger and/or anxiety mediate the effects of socio-economic or socio-cultural predictors on populist attitudes and nativism?
Methods and Design
Sampling Procedure and Data Collection
We collected survey data from participants in 15 European countries. 1 The diversity of European countries with different socio-economic structures and political cultures allowed us to account for differences in individual-level variables. Our desired representative sample size was approximately 500 respondents per country, with quotas based on current UN census data (UNdata) for age, gender, and geographical region. The main eligibility criterion for respondents was to have lived in their current country of residence for at least 10 years, which we believe is sufficient time to feel at home in the country of residence. In the Informed Consent respondents were informed about the purpose of our study, their voluntary participation, and guaranteed privacy based on GDPR regulations. We obtained ethical approval from the Faculty Ethics Review Board of the University of Amsterdam. (Number 2019-SP-10754).
Survey
The survey began with information about the study and a request for informed consent. All respondents were required to provide informed consent before proceeding to the actual questions. Unless otherwise stated, and with the exception of demographics and media usage behavior, respondents were asked to indicate their agreement with a statement on a seven-point Likert-scale, ranging from strongly agree to strongly disagree. Our survey included mainly existing scales. 2 Cronbach’s alpha (α) is the most common measure of the internal consistency (“reliability”) of survey items and is used here to determine how reliable our multiple Likert-scale questions are. 3 Pre-analysis of our dataset included both exploratory- and confirmatory factor analyses (EFA and CFA), in which certain items were removed from our final scales if, for example, they loaded on a different factor. In such cases, items were removed from the original scale to ensure the internal consistency (“reliability”) of our scales. A detailed overview of our changes to the various scales is provided in the following sections.
Populist Attitudes
To measure Populist Attitudes, we included items from the original scale developed by Castanho Silva et al. (2019) because in a cross-national study comparing seven different populist attitudes scales, it showed an appropriate questionnaire design, one of the best model fits, and was the only scale that resulted in invariant factor loadings across countries, which is important for our current research (Castanho Silva, et al., 2019). The scale taps three dimensions: People-Centrism (e.g., “Politicians should always listen closely to the problems of the people”), Anti-Elitism (e.g., “The government is pretty much run by a few big interests looking out for themselves”), and Manichean Outlook (e.g., “You can tell if a person is good or bad if you know their political views”). Furthermore, the scale is based on and supported by previous research (see Castanho Silva et al., 2018, p. 158), in which items were selected based on scalar invariance, average loadings, and distributional properties, including at least one negatively worded item in each subscale. In our study, we were unable to establish measurement invariance, which may be due to the particularly large number of diverse groups to compare (i.e., 15 countries), which has been shown to be a common issue in recent literature (De Roover, 2021).
The original Populist Attitudes scale consisted of three factors (People-Centrism, Anti-Elitism, and Manichean Outlook) with three items each (see Castanho Silva et al., 2019). A reliability analysis for all three factors separately showed a low reliability for each factor (alphaPeople-Centrism = .45, alphaAnti-Elitism = .56, alphaManichean-Outlook = .39). When the negatively worded items (three in total, one per dimension) were removed, reliability improved (alphaPeople-Centrism = .66; alphaAnti-Elitism = .61; alphaManichean-Outlook = .51). A CFA with three factors did not converge. An EFA with parallel analysis indicated that four factors best described the data. The EFA revealed that all of the negatively worded items did not load well on the factors, and that the items of the Manichean Outlook dimension loaded on two different factors. In addition, two of the three items belonging to the Manichean Outlook dimension had low factor loadings (.45). Unfortunately, including only one item for the Manichean Outlook dimension made the model unidentifiable, so we had to remove this dimension altogether. Therefore, we decided to remove all negatively worded items as well as the Manichean Outlook dimension. A CFA with two factors (People-Centrism, Anti-Elitism) showed a good model fit (robust chi-square (1) = 6.41, p = .01), comparative fit index (CFI) = 0.99, Tucker-Lewis index (TLI) = 0.99, root mean square error of approximation (RMSEA) = 0.02, standardized root mean square residual (SRMR) = 0.01). When the only promising items were included in our models, the fit indices met acceptable thresholds (RMSEA < 0.8, CFI & TLI > 0.9). 4 Overall, the four items formed a reliable scale (Cronbach’s α = .65), despite the large size and great diversity of the sample across 15 European countries in terms of political and socio-cultural history.
Nativism
A previous attempt to measure nativism includes the Ipsos Nativism Scale (Young, 2016; Young, Ziemer and Jackson, 2019; Zhao, 2019), which uses five items from the World Values Survey (WVS) and the General Social Survey (GSS). The scale captures anti-immigrant perceptions, in which foreigners are described as taking away jobs and social services from the “native” populations, thereby weakening the economy as a result. We found these items too constrictive and narrow for our research as they did not cover other important issues, such as the housing market, identity, culture, and values. Therefore, we developed our own scale to measure Nativism (Abadi et al., 2024), in which participants indicated how much they agreed with three different statements representing nativist attitudes, such as “The political elites have failed to protect our cultural identity,” “People who are born in [country name] should be given priority over immigrants in the employment and housing market,” and “People who have immigrated to [country name] should adjust to our habits, values and traditions here and give up their own culture.” The internal consistency of our scale was reliable (Cronbach’s α = .70). The CFA was just identified, and all items showed acceptable factor loadings (all standardized factor loadings > .60).
Socio-Economic Measures
Education level was measured as low (up to high school diploma), medium (technical/vocational diploma) and high levels (university degree). For Employment status, participants could check the following categories: unemployed, retired, student, employed, self-employed and inapplicable. Because this variable is nominal (categorical) and not ordinal, we dummy-coded all employment categories and compared them to being employed.
Socio-Cultural Measures
Subjective Social Status
We used the MacArthur Scale of Subjective Social Status (Adler et al., 2000), which represents an ascending ladder from zero to ten and measures socio-economic status as subjectively perceived by respondents.
Social Identity
This scale is based on Ellemers et al. (2002), Self and Social Identity and uses three items: “Do you feel [British]?,” “Being [British] is an important part of who I am,” and “Do you feel at home in [the UK]?,” with higher scores reflecting greater identification with the country in question. The three items formed a reliable scale (Cronbach’s α = .82). The CFA was just identified, and all items showed acceptable factor loadings (all standardized factor loadings > .66).
Emotional Measures
Anxiety
We measured Anxiety about different types of future events using three items from the realistic threat scale (Stephan et al., 2009). These three items tap participants’ anxiety about their personal well-being and economic circumstances (e.g., “I am anxious about what the future will bring,” “I am afraid that I will lose my job in the near future,” and “I fear that it will be very difficult for me to find proper housing”). The three items formed a reliable scale (Cronbach’s α = .71). Our first realistic threat scale consisted of four items and one factor. The analysis showed a low reliability (alpha = .57). When removing one item, the reliability improved considerably. This was consistent with a CFA showing that one item (item 3: I expect that my living standards will improve in the coming years) did not load well on the factor (robust chi-square [0] = 124.28, p < .001, TLI = 0.90, CFI = 0.96, RMSEA = 0.10, 95% CI [0.08, 0.11], SRMR = .03). When this item was excluded, the model was just identified, and all factor loadings were acceptable (all standardized factor loadings > .63). Therefore, we excluded item 3 from our further analyses.
Initially, we also considered to use a four-item symbolic threat scale. However, the reliability analysis showed that the items did not form a reliable scale (alpha = .42). Removing one item slightly improved reliability (alpha = .46). The CFA did not converge on all four items. Therefore, we decided not to use this scale in our further analyses.
Anger
We developed a scale based on previous items measuring anger (Fischer & Roseman, 2007) and applied them to appraisals of the government, the elites and the people (Abadi et al., 2024). We used items reflecting appraisals (other-blame and unfairness) and action tendencies characteristic of anger (e.g., criticism, abolition, accusation). Because politics is a very sensitive topic in some of the European countries included in our study, and respondents are afraid to report negative evaluations of their government, we tried to circumvent this self-censorship by asking participants indirectly about their feelings toward their government. For example, we asked them how people around them thought about a statement, such as, “Many people around me think that the government has betrayed us.” This wording thus does not tap individual anger, but is an operationalization of collective anger, assuming that the feelings of friends and acquaintances on this topic can be viewed as a proxy for their personal feelings, and indicating the feelings that others share with them. Our original Anger scale consisted of 11 items, including three reverse-coded items, all loading on one factor. The reliability analysis indicated a good reliability (alpha = .87). The CFA with all items and one factor showed a poor model fit (chi-square [44] = 5087.42, p < .001), CFI = 0.81, TLI = 0.76, RMSEA = 0.14, SRMR = 0.10). An EFA revealed that all three negatively worded items loaded on a separate factor. Removing these items and re-running the CFA resulted in an acceptable model fit (chi-square [20] = 315.93, p < .001), CFI = 0.98, TLI = 0.97, RMSEA = 0.05, SRMR = 0.02). According to our EFA and CFA results, the reversed items loaded on a different factor than the remaining items and therefore had to be removed from our analysis. The remaining eight items formed a reliable scale (Cronbach’s α = .88).
Demographics
Our survey also included background questions regarding demographics, which will not be reported in the current study. We used self-reported data on age, education, employment status, gender, and (geographic) location (see Appendix A for sample characteristics and descriptive statistics).
Procedure
The survey was initially developed in English and then translated into 14 other languages by native speakers of our consortium partners, before being back-translated into English. In addition, each translation was customized based on country specifications, such as country name and language terms. All translations were uploaded on the Qualtrics XM (2019) online platform (version: July 2019) and the data were collected after being synchronized with a global research platform (Cint), which provided us with a heterogeneous pool of respondents across the 15 European countries involved in our project. 5 In total, our survey yielded 10,018 respondents, whereas 2,292 respondents who did not meet our main eligibility criterion (having lived in their current country of residence for at least 10 years), and those with missing values were excluded (“listwise deletion”), were excluded, resulting in 7,726 complete respondents. 6
Results
As a first step, we report the means, standard deviations and correlations of all included variables.
Descriptive Statistics
Respondents
Our survey sample included quotas based on current UN-census data (UNdata), which were set for age, gender, and geographical region. 7
Relations Between Variables
Table 1 presents the means, standard deviations, and Pearson’s correlations of the variables in this study. 8
Means, Standard Deviations, and Pearson’s Correlations.
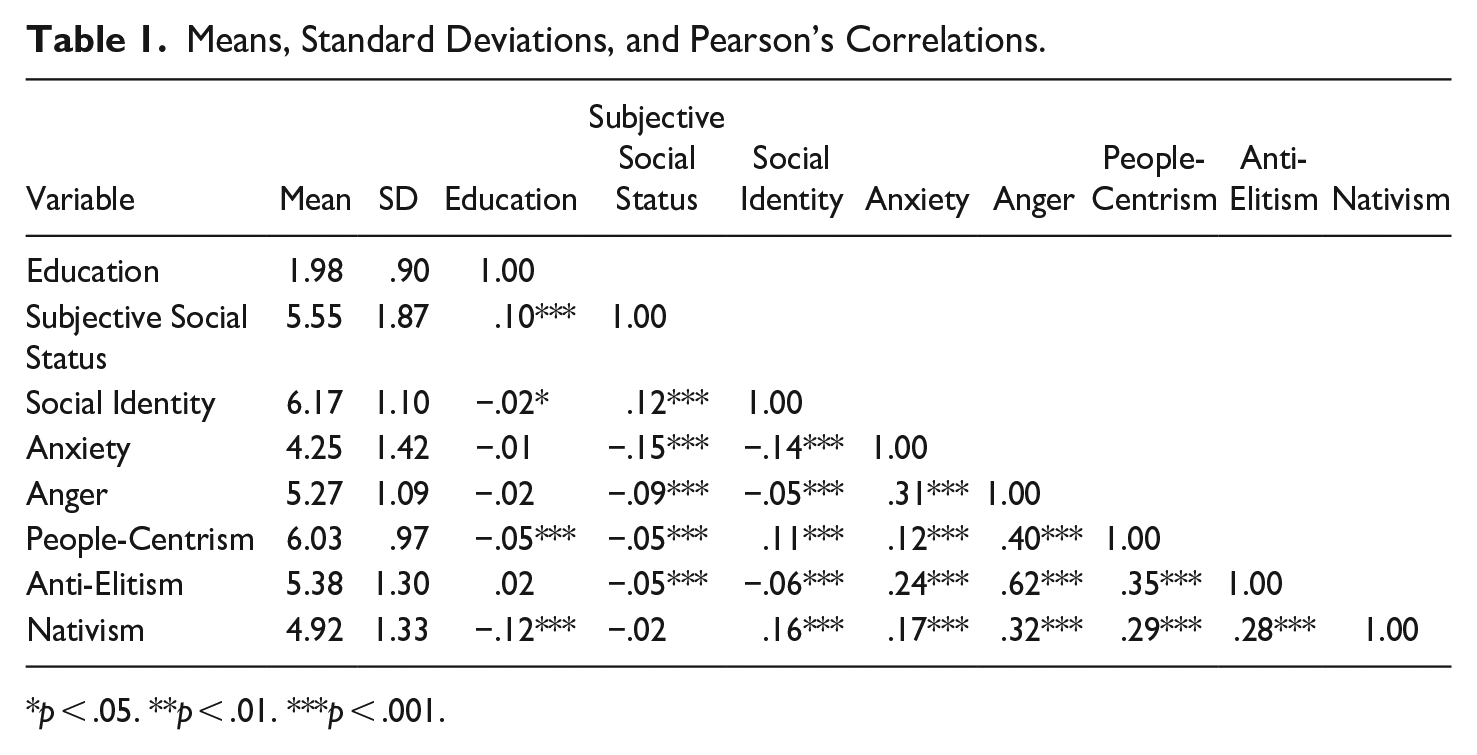
p < .05. **p < .01. ***p < .001.
Regarding socio-economic factors, there is no significant correlation between Education and Populist Attitudes; however, there is a negative correlation between Education and Nativism (r = −.12, p < .001). Regarding socio-cultural factors, there is no correlation between Subjective Social Status and Populist Attitudes as well as Nativism, however there is a positive, albeit weak, correlation between Social Identity and People-Centrism (r = .11, p < .001) as well as with Nativism (r = .16, p < .001). Interestingly, there is also a weak positive correlation between Subjective Social Status and Social Identity (r = .12, p < .001), whereas the former is negatively correlated with Anxiety (r = −.15, p < .001). Regarding the emotional factors, the correlations between Anxiety and Populist Attitudes (r = .12, p < .001 and r = .24, p < .001) as well as Nativism (r = .17, p < .001) are also weak. However, the correlations between Anger and Populist Attitudes (r = .40, p < .001 and r = .62, p < .001) and Nativism (r = .32, p < .001) are moderate to strong. The correlation between Populist Attitudes and Nativism is also moderate (r = .28, p < .001 and r = .29, p < .001). There is no correlation between Education and emotional factors.
In summary, our correlations show that the relationship between emotional measures (Anxiety, Anger) and Populist Attitudes as well as Nativism is much stronger than between them and socio-economic (Education) as well as socio-cultural (Subjective Social Status, Social Identity) measures.
Structural Equation Modeling
First, we investigated whether using multilevel analysis should be used to incorporate the clustered nature of our data into the analysis. We found that for all but one variable, the intracluster correlation coefficient (ICC) ρ is below the threshold that would be considered appropriate for multilevel analysis (for all but one variable: ρ <= .07). This means that there is little variance between the 15 countries in our dataset. In addition, the number of clusters (15) is insufficient for a multilevel analysis. Originally, our study included the country-level variable inequality index to explain the difference in economic deprivation between countries. However, we excluded this variable from our analysis because the multilevel SEM showed that there was not much variance to explain. To still account for the clustered nature of the data, we deployed an SEM analysis with cluster-adjusted standard errors to investigate how the interactions between socio-economic factors (Education and Employment) and socio-cultural factors (Subjective Social Status, Social Identity) affect Populist Attitudes. It should be noted that all of our SEM models are exploratory and that other potential models may explain the data as well.
First, we examined whether emotional factors (Anxiety, Anger) predict Populist Attitudes. To estimate our SEM models, we used the statistical software R (version 4.1.2) and the lavaan-package (Rosseel, 2012) as well as the Mplus software (version 7.3; Muthén & Muthén, 2012). The model fit of an SEM model is assessed using the chi-square test, the CFI, the RMSEA, and the SRMR. According to Hu and Bentler (1999) and Kline (2015), a reasonable fit is indicated by a non-significant chi-square (divided by the degrees of freedom in case of large sample sizes), a CFI value > 0.95, an RMSEA < 0.06, and an SRMR < 0.08.
As mentioned in “Methods” section, we used “listwise deletion” to deal with missing data. The Mardia-Test for Multivariate Normality (Skewness and Kurtosis) indicated that multivariate normality could not be assumed (Mardia, 1970). Therefore, we used maximum likelihood estimation with robust standard errors and a Satorra-Bentler Scaled Chi-square test statistic (Satorra & Bentler, 2001, 2010). Before we can test our structural model, we need to examine the measurement part of our model. We can test this by allowing all latent variables to be freely correlated without a regression coefficient. The measurement model met the threshold of the RMSEA and SRMR criterion, but not the threshold of the TLI and CFI (robust chi-square [85] = 586.19, p < .001, CFIr = .94, TLIr = .92, SRMRr = 0.03, RMSEAr = 0.03 [90% CI [0.03, 0.03]]). This means that we cannot confidently assume that the model fits, and therefore it should be interpreted with caution.
Our first basic SEM model (Figure 1) shows a significantly strong predictive effect (standardized) of Anger on Populism (β = .86); however there is no direct predictive effect of Anxiety on Populism (β = .04). Anxiety also predicted Anger (β = .39). The structural model yielded the following fit indices: (robust chi-square [85] = 586.19, p < .001, CFIr = 0.94, TLIr = 0.92, RMSEAr = 0.03 with the 90% CI [0.03, 0.03], SRMRr = 0.03). The explained variance (R2) of our model is .78 for Populism, .92 for Anti-Elitism, and .35 for People-Centrism.
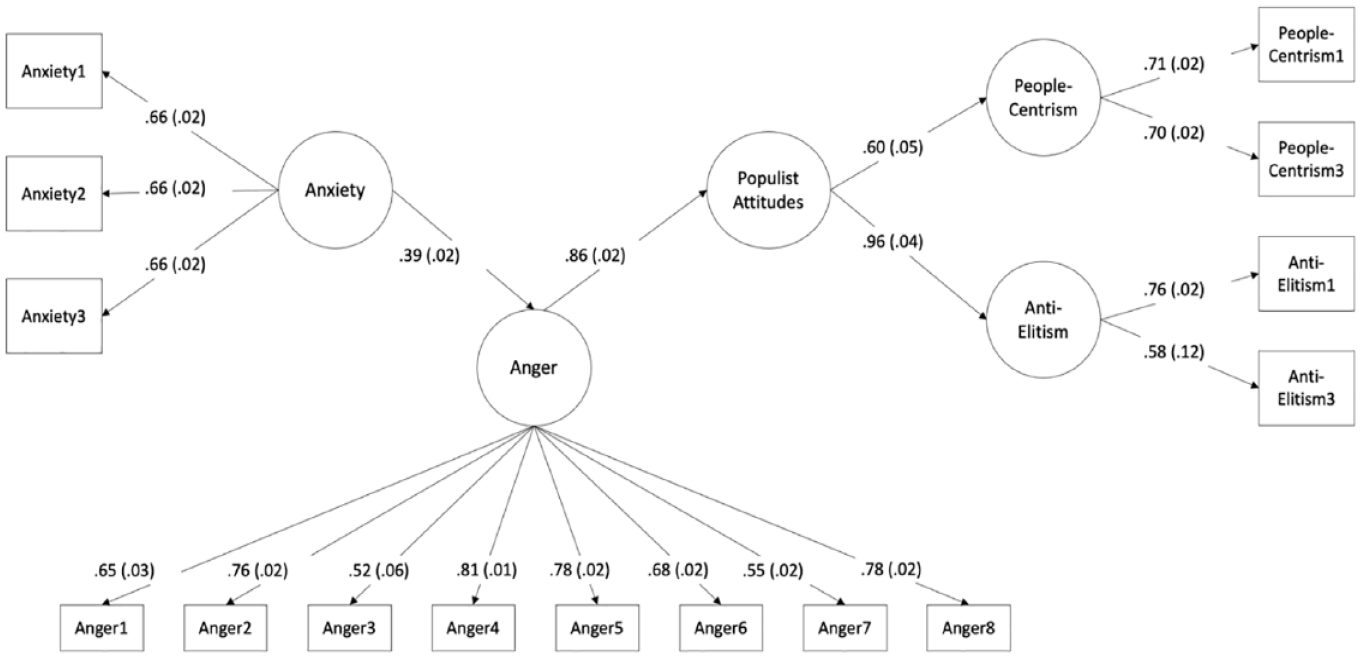
Model estimates (populist attitudes) including emotional factors. All values are standardized.
Next, in our second advanced SEM model (Figure 2), we further tested the indirect effects of socio-cultural factors (Social Identity, Subjective Social Status) as well as socio-economic factors (Employment, Education) to compare their influence with emotional factors (Anxiety, Anger). The corresponding measurement model showed an acceptable fit for RMSEA and SRMR, but a fit below the acceptable threshold for TLI and CFI (robust chi-square [127] = 836.26, p < .001, CFIr = 0.94, TLIr = 0.93, RMSEAr = 0.03 with the 90% CI [0.03, 0.03], SRMRr = 0.04). The structural model had the following fit indices: robust chi-square (247) = 1544.75, p < .001, CFIr = 0.92, TLIr = 0.91, RMSEAr = 0.03 with the 90% CI [0.03, 0.03], SRMRr = 0.04. The standardized factor loadings (lambda λ) of the model are shown in Table 2.
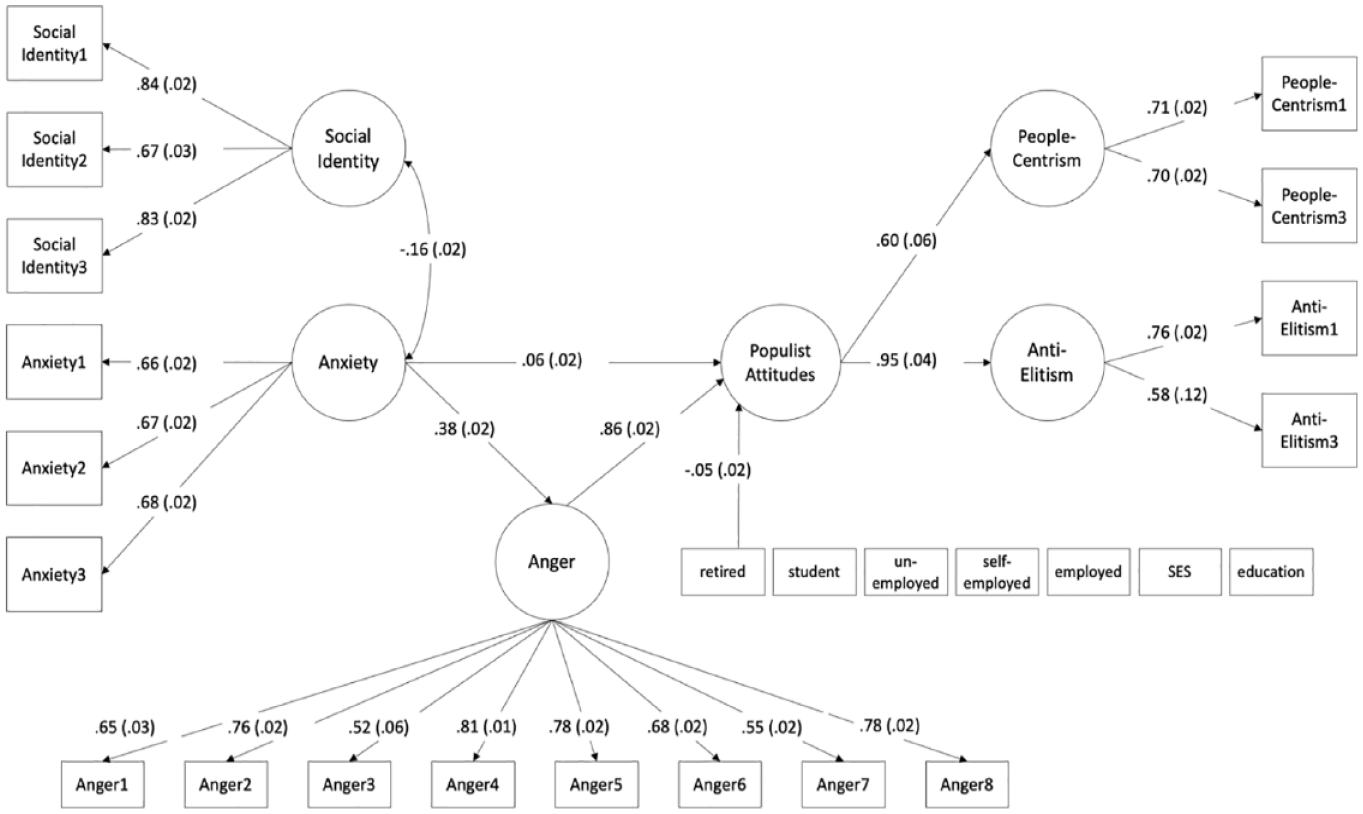
Standardized regression coefficients for the structural equation model (populist attitudes) including socio-economic, socio-cultural, and emotional factors. All values are standardized.
Standardized Factor Loadings for the Structural Equation Model (Populist Attitudes).
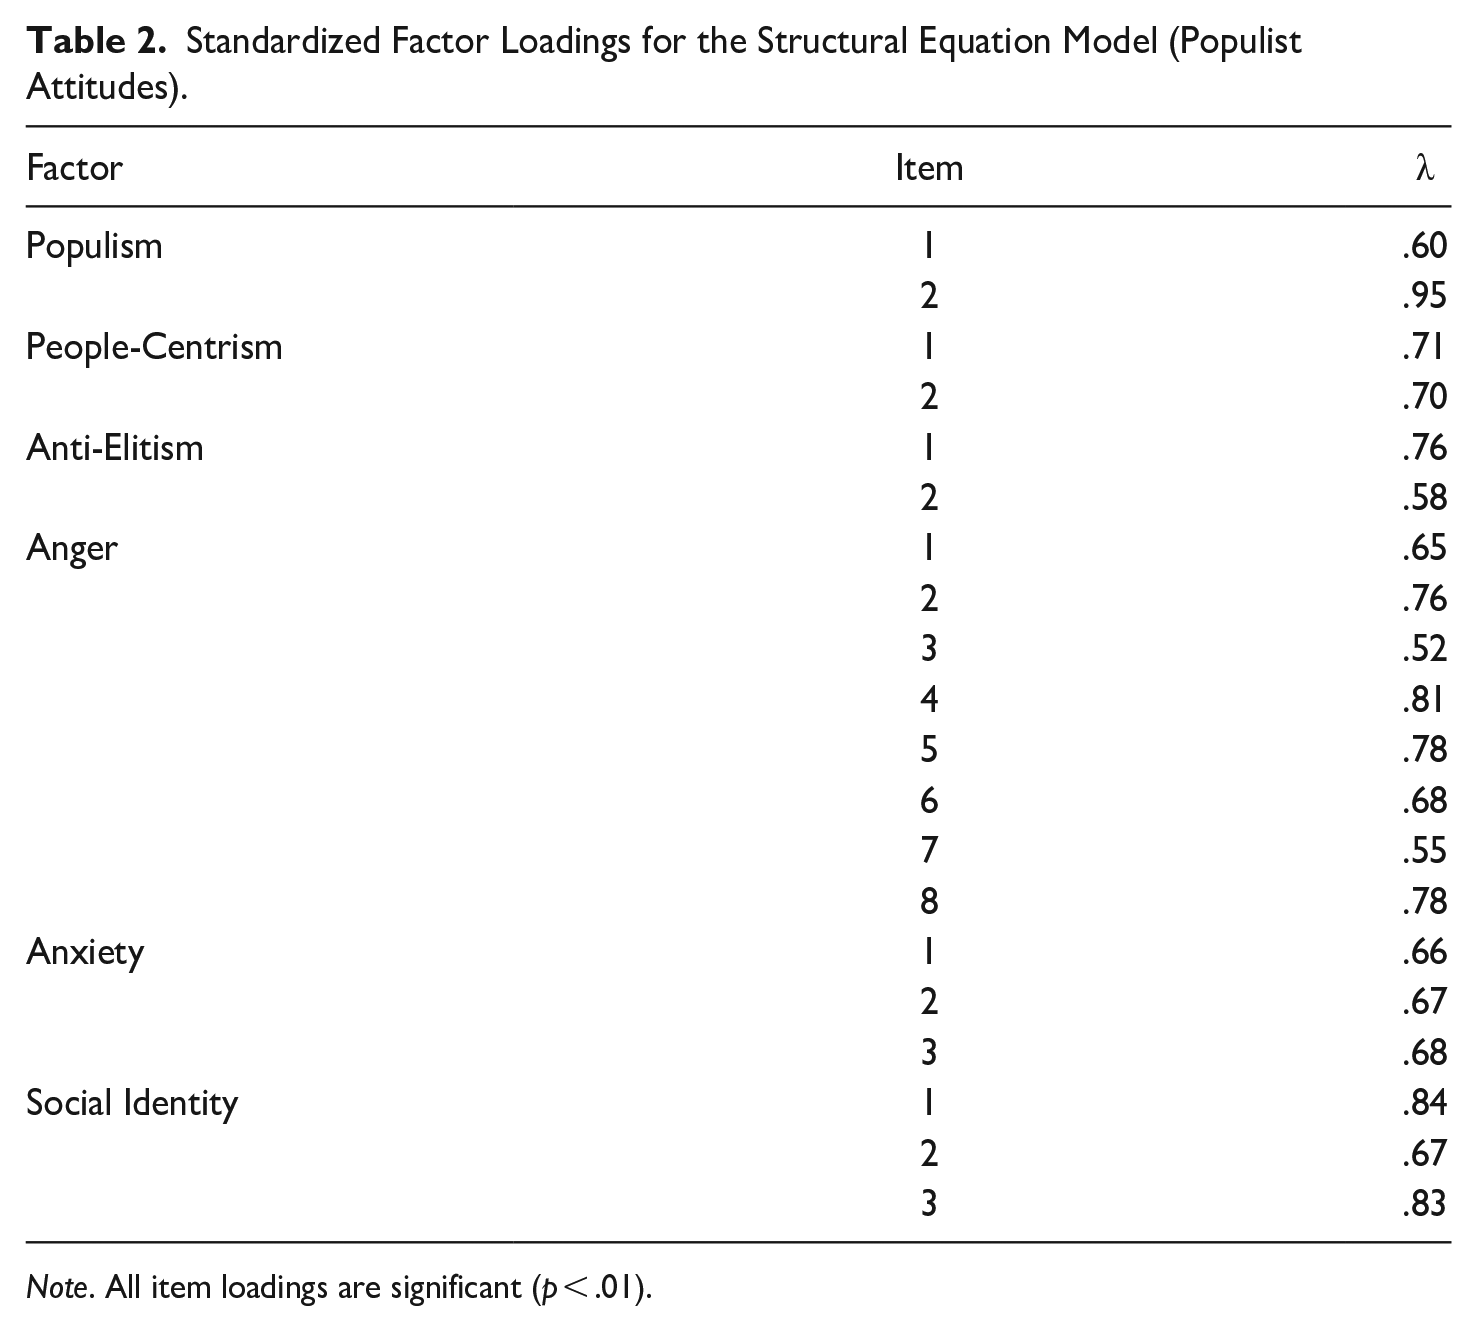
Note. All item loadings are significant (p < .01).
Our second advanced SEM model (Figure 2) shows the same significantly strong predictive effect (standardized) of Anger on Populist Attitudes (β = .86), as well as a small predictive effect of Anxiety on Populist Attitudes (β = .06). Interestingly, Anxiety is significantly negatively predicted by Social Identity, that is, the weaker one’s national identity, the more anxious one is. There is also a significant effect of Anxiety on Anger (β = .38). Many of the paths from socio-economic and socio-cultural factors to Populist Attitudes are non-significant. Overall, the explained (standardized) variance (R2) for this advanced model of Populist Attitudes was .79 for Populism, .91 for Anti-Elitism and .36 for People-Centrism, only slightly larger than our first SEM model (Figure 1), indicating that neither socio-economic nor socio-cultural factors explain much variance beyond the emotional factors. To test this, we estimated an additional model containing socio-economic and socio-cultural factors only. Indeed, this model explained only .03 and .01 of the variances of People-Centrism and Anti-Elitism, respectively (see Appendix B for details).
Populism Versus Nativism
In addition to our SEM models for Populist Attitudes, we also tested two SEM models for Nativism to see if the emotional components also predicted nativist attitudes. The measurement model, including Nativism, Anger, and Anxiety as latent variables, showed a poor model fit (robust chi-square [74] = 1248.37 CFIr = .88, TLIr = .85, RMSEAr = 0.05 with a 90% CI [0.04, 0.05], SRMRr = 0.05). The structural model (see Figure 3) showed a similarly poor fit (robust chi-square [74] = 1248.33, CFIr = .88, TLIr = .85, RMSEAr = 0.05 with a 90% CI [0.04, 0.05], SRMRr = 0.05). Again, these models should be treated with caution. In this basic SEM model, both Anger (β = .43) and Anxiety (β = .11) significantly predict Nativism. In addition, Anger (β = .39) mediates the relationship between Anxiety and Nativism. The explained variance (R2) of this model is .24 for Nativism.
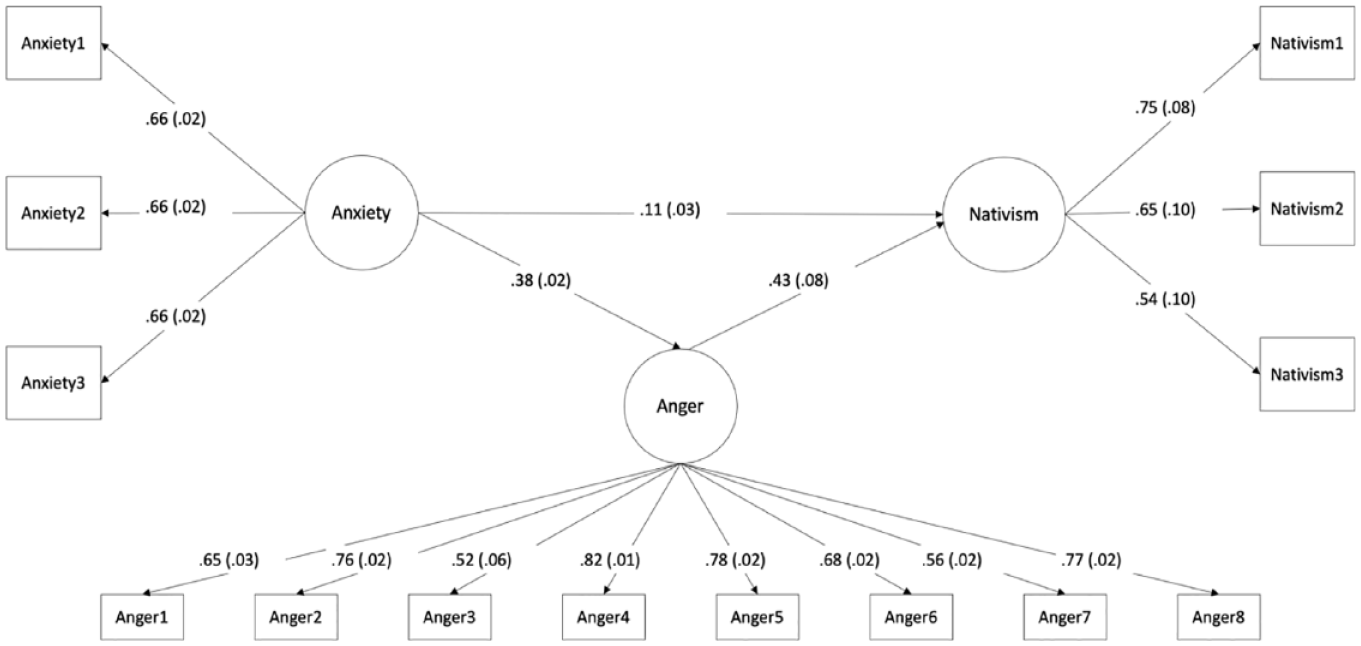
Model estimates (nativism) including emotional factors. All values are standardized.
In a next step, we again tested a second model that included both socio-economic and emotional factors to explain Nativism (see Figure 4). The measurement model including the latent variables Nativism, Anger, Anxiety, and Social Identity showed again a poor model fit as it was beyond the acceptable threshold (robust chi-square [113] = 1311.29, CFIr = 0.91, TLIr = 0.90, RMSEAr = 0.04 with a 90% CI [0.04, 0.04], SRMRr = 0.05). The structural model (see Figure 4) had a slightly worse model fit (robust chi-square [226] = 2007.30, CFIr = 0.90, TLIr = 0.89, RMSEAr = 0.03 with a 90% CI [0.03, 0.03], SRMRr = 0.05). Similar to the first SEM model including Nativism, in this SEM model both Anger (β = .39) and Anxiety (β = .17) significantly predict Nativism, whereas Anger (β = .38) mediates the relationship between Anxiety and Nativism. Moreover, Social Identity (β = .24) has a significantly strong predictive effect on Nativism, and Education (β = .14) has a positive predictive effect on Nativism (see Figure 4).
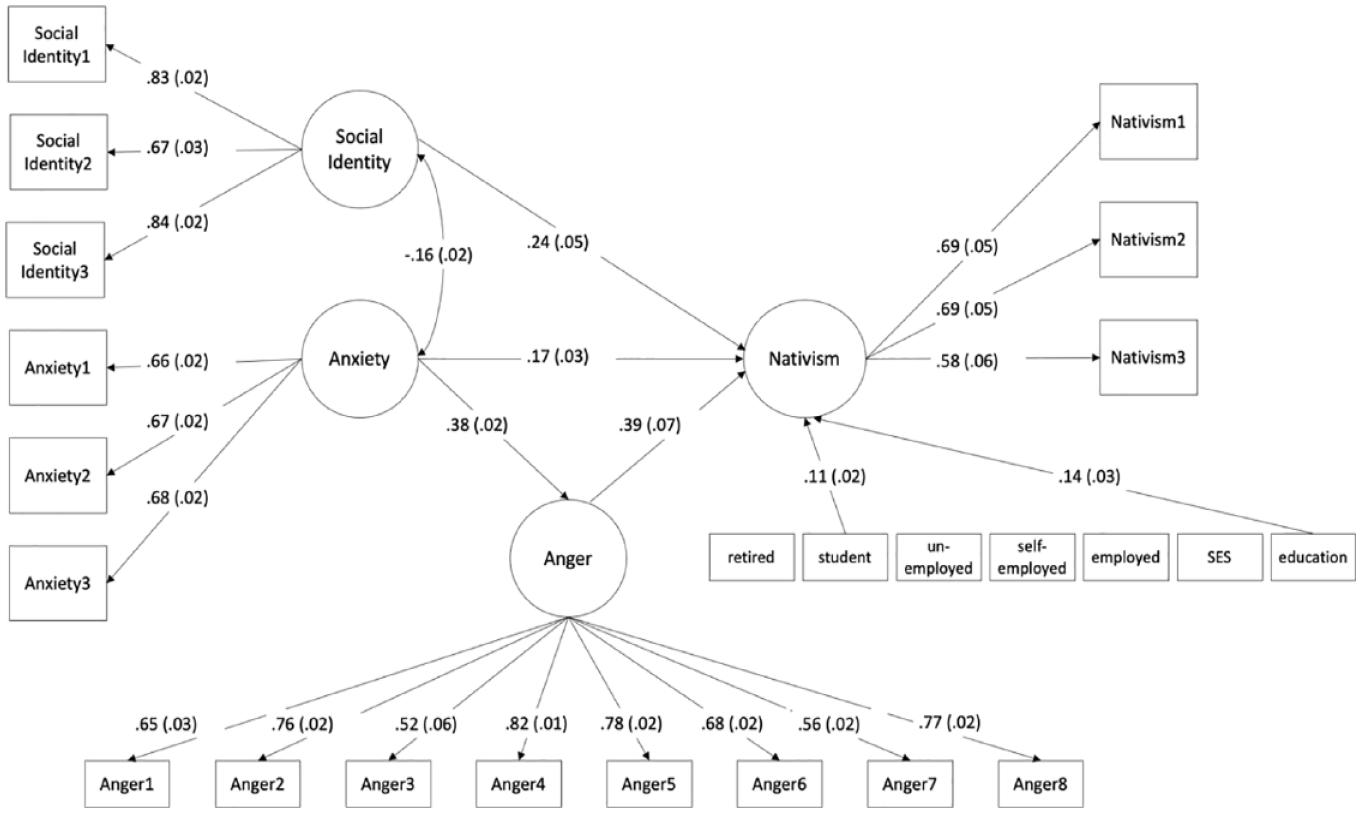
Standardized regression coefficients for the structural equation model (nativism) including socio-economic, socio-cultural, and emotional factors. All values are standardized.
The explained variance (R2) of this model is .30 for Nativism. This means that our advanced model including socio-economic and emotional factors explains only 6% more of the variance of Nativism. The corresponding standardized factor loadings (lambda λ) are shown in Table 3.
Standardized Factor Loadings for the Structural Equation Model (Nativism).
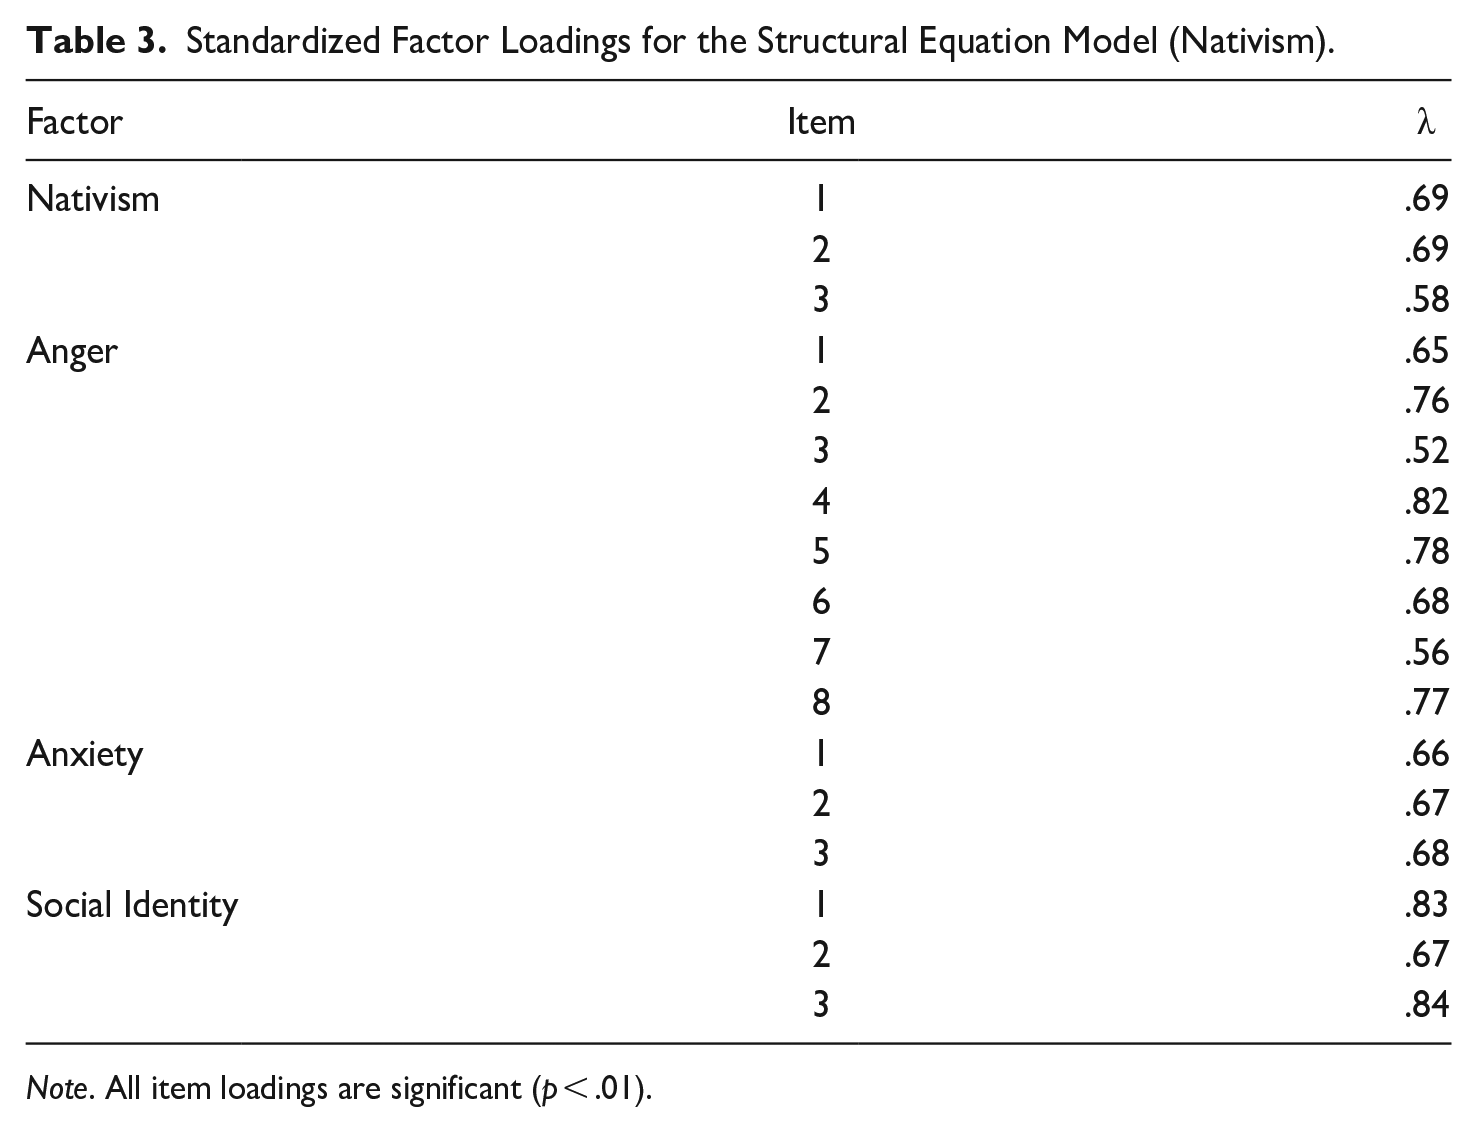
Note. All item loadings are significant (p < .01).
Discussion
The main goal of the present research was to examine variables related to three different types of explanations for populism that have been offered in the literature. Previous research on populism has mainly tested one type of explanation at a time. In this study, we compared the relative importance of different explanations of populist attitudes simultaneously. In addition to populism, we included nativism as a dependent measure because previous literature has argued that populism and nativism are related constructs. As predictors, we included variables capturing socio-economic explanations (education, employment), socio-cultural explanations (perceived social status and social identity), and two negative emotions (anxiety and anger). Using structural equation models (SEMs), we found compelling evidence for the relatively strong association of anxiety and anger with populist attitudes, whereas socio-economic and socio-cultural factors did not contribute much to explaining the variance in populist attitudes.
Our findings are consistent with recent theorizing and research that populist views are better predicted by (negative) emotions (e.g., Aslanidis, 2020; Erisen, 2024 in this Special Issue, Part Three; Nguyen et al., 2022; Salmela & von Scheve, 2017; Wirz et al., 2018) than by socio-economic factors (Rooduijn & Burgoon, 2018) or socio-cultural factors (e.g., Brown, 2000; Hogg, 2001, 2002). Our basic SEM model, which tested only emotions, showed that Anger, but not Anxiety, had a significantly strong predictive effect on People-Centrism and Anti-Elitism. In our advanced SEM model, we tested the indirect (mediation) effects of socio-cultural and socio-economic predictors on Populist Attitudes, comparing their influence with the two emotions. This comparison showed that, in contrast to emotional factors, neither socio-economic nor socio-cultural factors contribute much to explaining populist attitudes. This result thus supports the general claim that emotions, as triggered by societal changes, are the most important factor in explaining populist attitudes.
We also raised the question of the different roles that Anxiety and Anger might play. First, Anger had the strongest effect on Populist Attitudes, both in the basic and in the advanced SEM model. This is consistent with previous studies showing that anger, rather than fear or anxiety, and populist attitudes are more closely related (Rico et al., 2017; Wirz et al., 2018). This can be explained by the central construct of other-blame in anger, which is also a crucial element of populist argumentation, in which elites and the government are blamed for the negative societal position people find themselves in (see also Lerner et al., 2015). Indeed, whereas the People-Centrism scale contains only descriptive statements (e.g., “Politicians should always listen closely to the problems of the people”), the Anti-Elitism scale contains other-blame appraisals (“Quite a few people running the government are crooked” and “Many people around me think that their government has betrayed us”). This also explains why the relation between Anger and Anti-Elitism is stronger than that between Anger and People-Centrism.
More specifically, both models also show a significant mediation effect of Anxiety on Anger, suggesting that highly anxious people are more likely to become angry, which makes them more supportive of populist arguments. This supports the idea of ressentiment (Salmela & von Scheve, 2017): the psychological mechanism by which one’s anxiety is transformed into anger. This transformation process has been described in different ways, some focusing on repressed or acknowledged shame, others on the role of envy, powerlessness, and inferiority (e.g. Salmela & Capelos, 2021). Future research should pay more attention to this transformation process (see also Nguyen et al., 2022), which may also include the role of positive emotions, such as nostalgia and hope (Verbalyte et al., 2022).
In addition, we have also examined how Nativism relates to Populist Attitudes, and whether the same predictors are found. The moderate correlations between Nativism and Populist Attitudes can be explained by the fact that the latter items (Castanho Silva et al., 2018, 2019) lean toward a nationalist-conservative reasoning of populism, measuring a right-wing rather than a left-wing populist ideology (see also Mudde, 2007, p. 26). Furthermore, although the results should be interpreted with caution, our SEM analyses show a strong predictive effect of social identity on nativism (β = .25; see Figure 4), confirming the “us” versus “them” dichotomy of nativism (Mudde, 2004, p. 543; Newth, 2021).
One question is whether emotions can be considered independent of socio-economic and socio-cultural indicators, since unemployment, low education, low perceived social status, or social identity may elicit negative emotions. We found a small but significant path from Social Identity to Anxiety, suggesting that social identification with one’s home country has an impact on anxiety: the less one identifies with one’s home country, the more anxious one is. However, we did not find any support for other mediation effects, presumably because these predictors did not explain much variance in the first place. This means that not everyone has negative feelings about their socio-economic status or social position in society. We can assume that emotional reactions are relatively independent of the socio-economic or socio-cultural factors we have included here.
Strengths and Limitations
A clear strength of this study is that it includes a large, representative and diverse sample from 15 different European countries, and tests three different types of explanations. To our knowledge, this is the first study with such a large sample to test different types of predictors simultaneously. However, we should also acknowledge some limitations. The most important limitation is that this research is cross-sectional and exploratory as it does not test causal hypotheses. Future research should test the present findings in a confirmatory, experimental manner.
Another limitation is the marginal reliability score of our Populist Attitudes scale (Cronbach’s α = .65), which is explained by the differences in Cronbach’s alpha’s (α) across countries. This is noteworthy because the scale is assumed to have high factor loadings and good model fit, and scores high in cross-national validity (Castanho Silva, et al., 2019). This is a more common issue reported in cross-country research (e.g., De Roover, 2021; Marsh et al., 2018) and could point to measurement challenges or meaningful socio-cultural differences in the interpretation of the scale across the countries studied (see, e.g., Byrne & Watkins, 2003). We have not examined these differences here, as our current analysis does not focus on cross-national comparisons. Thus, the large size and diversity of our sample can be seen as a double-edged sword, as it undermines the reliability score of some scales (Wolf et al., 2013). Future studies should examine these cross-country differences more closely and be careful in their choice of populism scale. We should also note that our measures do not clearly distinguish between different types of populism, such as left-wing and right-wing populism, across countries. Therefore, we cannot determine how much of the explained variance for populist attitudes is due to left-wing and right-wing voters.
A final limitation could be the social desirability bias of survey respondents, which has been identified particularly for constructs, such as the need for affiliation, conformity, approval, or (lack of) self-disclosure (Johnson & Van de Vijver, 2003). For our present research, this may apply to both the Anti-Elitism and the Anger scale, as (some of) our respondents may have been reluctant to criticize their government. We attempted to reduce this bias in two ways: we framed questions about anger toward the government as a statement about other people’s beliefs rather than their personal feelings, and we randomized all questions within the same scale. However, we cannot be sure whether this has reduced this potential bias.
In summary, our research shows that anger, rather than anxiety, is the best predictor of populist attitudes, and that socio-economic and socio-cultural factors play a minor role. Our results also provide some evidence that socio-cultural factors, especially low identification with one’s country of origin, may induce anxiety, which may then be transformed into anger. This transformation process can also be conceptualized as an emotion regulation strategy in which one emotion is replaced by another (Mesquita & Frijda, 2011), for example, because the original emotion does not fit one’s self-concept, or one’s goal to have a positive social identity, and is therefore replaced by a more fitting or powerful emotion. Recent research on collective emotion regulation (Goldenberg et al., 2016) may also help to provide a framework for this transformation process from powerless and self-depreciating emotions that involve worries, concerns, and anxieties, to powerful emotions, such as anger, hate (Fischer et al., 2018), or contempt (Fischer & Giner-Sorolla, 2016), that empower people to regain a sense of control. It would be interesting for future research to pay more attention to this dynamic role of different emotions in the development of populist and nativist attitudes over time.
Conclusion
We have shown that anger and anxiety play different roles in people’s support for populist and nativist views. We hope to inspire other researchers to focus more on the dynamic role of different emotions and emotion regulation or transformation strategies when examining populism and nativism. To bridge our current study with future research, we also recommend complementing explanatory models with predictive modeling, such as computational experiments and deep learning algorithms (see e.g., Huguet-Cabot et al., 2021).
Footnotes
Appendix A
Appendix B
Declaration of Conflicting Interests
The authors declared no potential conflicts of interest with respect to the research, authorship, and/or publication of this article.
Funding
The author(s) disclosed receipt of the following financial support for the research, authorship, and/or publication of this article: This research was funded by the European Union’s Horizon 2020 project Democratic Efficacy and the Varieties of Populism in Europe (DEMOS) under H2020-EU.3.6.1.1. and H2020-EU.3.6.1.2. (Grant agreement ID: 822590). Further details are available here: ![]() .
.