
Abstract
Welfare reforms in the 1990s, particularly the Personal Responsibility and Work Opportunity Reconciliation Act of 1996, were motivated by concerns over the long-term poor. We compare the experiences of newly poor women in 1990–1992, 2001–2003, and 2008–2010 and find that the size and sources of the income shocks generating new spells of poverty remained relatively stable. In dual-head families, the newly poor were most often pushed into poverty by a drop in spousal earnings; in single-mother families, the main cause was a drop in personal earnings. For single mothers in the latter two periods, we find that income from cash transfers after becoming poor was less than in the 1990–1992 benchmark. As these transfers include welfare payments, the timing points to the impacts of the 1996 welfare reforms.
Keywords
The Personal Responsibility and Work Opportunity Act of 1996 (PRWORA), known as “welfare reform,” was passed at a time when both researchers and policymakers had come to focus on the long-term poor: families that had been in poverty (and would remain so) for extended periods. 1 This focus reflected changes in social attitudes and the nascent availability of longitudinal data that showed the importance of very long spells of poverty. Casual observation and academic research suggested that the long-term poor were (at best) only weakly connected to the world of work. Less salient to the designers of PRWORA were the newly poor: families that previously had incomes above the poverty level and then began a new spell of poverty after a drop in income. This article compares the experiences of the newly poor before and after PRWORA, asking whether welfare reform impacted the social safety net for these families.
The 1990s were deep into the last chapter of the “grand gender convergence” identified by Goldin (2014). The main welfare program in place at the start of the decade—the Aid to Families with Dependent Children (AFDC) program—was a legacy of the New Deal. By providing cash assistance for mothers who stayed home, it reflected a worldview that was ever more distant from the realities of modern family life. Most women—even those with preschool children—were working. In this setting, aid for nonworking parents was seen by many to be disincentivizing work and creating long-term dependence, thus perpetuating long-term poverty. 2
Two major policy changes in the 1990s responded to the evolution of women’s engagement in the workforce. A series of amendments to the Earned Income Tax Credit (EITC) in the early 1990s reduced the federal income tax burden for low-income families and, for many, brought a payment from the government—effectively, a “negative income tax” of the type advocated by Friedman (1962). Then, in 1996, PRWORA ended the historic AFDC program, an open-ended entitlement, and replaced it with a block grant to states—the Temporary Assistance for Needy Families (TANF) program. The name reflected the expectation that cash assistance would no longer be available indefinitely. The block grant feature meant that states had considerable leeway in the administration of their TANF programs. Within just a few years, the number of cash welfare recipients had fallen precipitously (see, e.g., Fang and Keane 2004). States used their newfound flexibility to channel funds away from cash assistance and into programs like child care and job training. 3 Advocates for ending “welfare as we know it” were seen as having been proved right.
In the late 2000s, when the Great Recession was underway, benefits from the Supplemental Nutrition Assistance Program (SNAP) (earlier known as the Food Stamp program) were expanded, and the maximum duration of unemployment insurance payments available to qualified job losers was lengthened. Table 1 summarizes how much participants could receive from these different programs in 1990, 2001, and 2008—the starting years of the three panels we use in the analysis below.
Summary of Benefits Available in Major Transfer Programs

SOURCE: Authors’ calculations using data from the Urban Institute’s Welfare Rules Databook (AFDC/TANF benefit); Table 7-9, 2011 Green Book (percent poor children); IRS instructions for Form 1040, various years (maximum EITC); IRS Statistics of Income, Table 2.5, various years (average credit); Social Security Administration (SSA) Annual Statistical Supplement, Table 9.A2, various years (unemployment compensation per spell calculated as average weekly benefit multiplied by average duration in weeks).
NOTE: SIPP = Survey of Income and Program Participation.
Critics of PRWORA focused mainly on the time-limit provisions of the new law (e.g., Wright Edelman 2001). 4 Less attention was paid to the fact that, with the lifting of federal control over the design of welfare benefits, states could adopt diversion policies and other reforms that made access to cash benefits much less likely for newly poor families. In fact, such policies had already been adopted in several states in the early 1990s under the waiver provisions of the old law. An analysis of AFDC caseloads in Wisconsin (Pawasarat 1999), for example, that showed that in many counties the number of families receiving cash benefits had fallen to zero by late 1997 suggests that newly poor families were being diverted from welfare. An analysis of month-to-month transitions using micro data from two longitudinal sources by Grogger, Haider, and Klerman (2006) similarly suggested that much of the drop in welfare participation after 1997 could be attributed to a fall in the probability of entering TANF relative to AFDC.
In this article, we provide a direct assessment of the effects of welfare reform and other program changes in the 1990s on the functioning of the safety net for newly poor families. For some time, these families had had enough income to keep them above the poverty level. Then something happened: a family member lost a job, or someone moved in or out. Now the family was poor. Help for families in this situation is exactly what the phrase “safety net” brings to mind. The stated goal of the welfare reform efforts in the 1990s was not to weaken the temporary safety net for the newly poor. Nevertheless, the program changes adopted by many states may have had such an effect.
We use detailed monthly data from the Survey of Income and Program Participation (SIPP) panels covering the periods 1990–1992, 2001–2003, and 2008–2010 to identify and study newly poor families. 5 Specifically, we compare family income and poverty outcomes in the months after first falling below the poverty line for families in these three longitudinal surveys. We measure changes in the families’ behavior following the entry into poverty (e.g., changes in the earnings of partners and coresident children) and the responses of various government programs, including cash welfare (AFDC or TANF), unemployment insurance (UI), and food program benefits.
Despite many labor market and policy changes that occurred over the 20-year time frame of our data set, we find that the drops in individual and family income associated with entry into poverty were remarkably similar over time, as were the sources of these drops. A typical woman experienced a roughly 70 percent decline in family income in the starting month of a new poverty spell: this decline arose from a combination of shocks to her own earnings (40 percent of the typical decline); shocks to the earnings of other family members, including the departure of a partner (50 percent of the typical decline); and a small drop in transfer income. The loss in earnings was associated with a sharp decline in the ratio of family income to the poverty threshold for the family—from an average of around 2.5 (i.e., family income is 2.5 times larger than the poverty threshold) just prior to the spell to around 0.5 in the initiating month (i.e., family income is only one-half of the poverty threshold in that month).
Although the sizes and sources of the income shocks leading to new spells of poverty were similar across the three SIPP panels, we find important changes in the responses of the safety net to the onset of poverty. Specifically, relative to the benchmark of the early 1990s, we find that in the two later panels cash transfers became much less responsive to the loss of family income for the newly poor. Among newly poor single mothers in the early 1990s, cash transfer income was 45 percent higher one year after the start of the spell than just prior to the spell—illustrating the safety net function of these transfers. In contrast, for newly poor single mothers in the two later panels, cash transfers were lower in the two years after the start of their poverty spell than they were just prior to the spell. Consistent with the conclusions of Bitler and Hoynes (2016), we find that SNAP benefits became somewhat more responsive to the onset of poverty, particularly for newly poor families in the 2008–2010 period.
In the next section of this article, a brief discussion of the measurement of poverty over different time frames provides some context for our focus on “high-frequency” (i.e., monthly) income fluctuations. Then, after summarizing the changing policy environment over our sample period, we offer an extended analysis of the dynamics of income and the ratio of income to family need around the start of new spells of poverty.
Measuring Poverty on a Monthly Basis
Poverty measurement requires the definition of basic parameters: who is in the family unit that shares resources, what counts as “income,” and the resource threshold below which a family is classified as “poor.” Also implicit in concept of income is a decision about the period of time over which to measure it. There has been extensive debate over the definition of family units, what counts as “income,” and what level of resources determines poverty (see, e.g., Blank 2008), but the choice of time unit for income measurement has received much less attention. Arguably, this is because the data source used to construct the official poverty rate in the U.S.—the Census Bureau’s Annual Social and Economic Survey (ASEC)—collects income data for the previous calendar year, making it hard to infer poverty rates at shorter intervals.
At a conceptual level, the question of what time horizon to use to define poverty status depends on two main factors: (1) how variable the flow of income is and (2) how easily families can smooth higher-frequency income fluctuations and maintain a stable level of consumption. On the first question, a series of studies reviewed by Parolin et al. (2022) suggests that monthly earnings are highly variable among families with below-average annual incomes in the U.S. On the second question, Parolin et al. (2022) show that monthly fluctuations in measures of food insecurity and housing insecurity captured in the Census Bureau’s Household Pulse Survey are relatively highly correlated with monthly estimates of poverty—a finding that suggests that many families’ well-being varies directly with their monthly income.
Then, there is a third factor: Family status can change within a year. Indeed, as we discuss below, one reason why families become poor is that a primary earner moves out of the household. Of course, the departure—or arrival—of older children or other relatives may likewise change the level of income needed to support the family.
In contrast to the official measure of poverty, most U.S. income support programs implicitly recognize the importance of higher-frequency fluctuations in income and need by calculating eligibility on a monthly or weekly basis. For example, SNAP and the TANF program both use monthly incomes to define eligibility, while the UI program uses a weekly definition. The Consumer Expenditure Survey, which is used by Slesnick (2001) and Meyer and Sullivan (2012) to measure “consumption poverty,” collects consumption data on a quarterly basis—thus, these studies implicitly define the relevant period for measuring poverty as a calendar quarter.
Although the ASEC collects only annual income data and year-end family rosters, the SIPP collects monthly information on incomes and family rosters from surveys administered every four months. For more than two decades, the Census Bureau has shown how SIPP data can be used to construct monthly poverty rates. For example, Iceland (2003) reports monthly poverty rates for 1996–1999, while Anderson (2011) reports monthly poverty rates for 2004–2005. 6 We use the SIPP data and a similar methodology to Iceland’s and Anderson’s to identify families that were nonpoor for at least four months and then experienced a month in which their monthly family income fell below the monthly poverty threshold for their family unit size.
These higher-frequency observations make it possible to say more about what changes when a family begins a spell of poverty. How much did income fall as the spell began? Was the change in income due to a drop in earnings or some other source? Did household composition change—for example, did the male partner of a formerly dual-headed family leave the household? And most relevant for assessing welfare reforms, how quickly did funds from safety net programs become available to the family to offset the initial income loss, and what fraction of the loss do these funds replace?
Empirical Analysis
Sample description
Our analysis is based on monthly data for the first 32 months of interviews from three panels of the SIPP: the 1990 panel (which conducted interviews from late 1989 to 1992), the 2001 panel (which conducted interviews from late 2000 to 2003), and the 2008 panel (which conducted interviews from mid-2008 to 2012). Coincidentally, each of these three panels began interviewing just as the economy was entering a recession. Thus, our analysis compares the experiences of families entering new poverty spells arising at the early stages of the 1990, 2001, and 2008 recessions.
Given the context of the welfare policy changes in the 1990s, we define our sample of interest as the set of families in the SIPP that have an adult nonelderly woman present (age 18 to 62 when entering the panel). The largest share of these families (54–58 percent) are dual-headed (i.e., husband-wife families). Also included are single-mother families (12–13 percent of families), lone-person families, and families comprised of women who live with relatives or roommates but have no children. We ignore single men and the relatively small fraction of single-parent families headed by men.
We use the Official Poverty Measure (OPM) to determine whether a family’s resources fall below the poverty threshold for a family of that size. In the calculation of the OPM, cash transfers count as part of family income. These include AFDC and TANF payments, other cash support (general assistance and other forms of state and local payments) and unemployment insurance payments. Benefits received from the SNAP program are not included as income under the OPM definition; nor are tax credits received through the EITC. Given that the availability of data about the EITC is limited in the panels we use and that SNAP benefit amounts were not collected in the 1990 panel, we follow the OPM definition of income, though we report information about receipt of SNAP benefits below.
The incidence of new poverty spells
We start by looking at the incidence of new poverty spells in our three panels. We define a new poverty spell as beginning in a month when the family income of a woman’s family falls below the poverty threshold for that family. We require that the woman’s family had income above the poverty threshold for at least four months prior to this starting month. Under this definition, women who never had family income above the poverty line for at least a four-month period during all the months they were included in the SIPP cannot be classified as “newly poor.” The upper panel of Table 2 shows the share of women in the three SIPP panels who were nonpoor for at least four months and were therefore at risk to start a new spell of poverty as we define it. As shown in column 1, in the 1990 SIPP, 93.6 percent of all women were nonpoor for at least four months. This rate was 94.7 percent for women in the 2001 panel and 93.6 percent in the 2008 panel. Thus, the overall share of women at risk to start a new poverty spell was remarkably stable across our three panels.
Incidence of New Poverty Spells in the 1990, 2001, and 2008 SIPP Panels

NOTE: Estimated standard errors in parentheses. Samples are based on first 32 months of each SIPP panel and include women who are 18–62 at entry to the panel with at least 24 months of data. Heads with husbands are women who are classified as household head or spouse in husband/wife family for at least 18 months. Heads with no husband are female household heads with no husband/partner for at least 18 months. Single mothers are heads with no husband/partner who have at least one other family member in their economic family in all months they are head with no husband. New poverty spells are events of poverty in months 5–29 of SIPP panel that were preceded by four or more months of nonpoverty. See text for description of lower-bound estimate of change in incidence and regression-adjusted estimate of change in incidence.
The roughly 5 percent of women in the various SIPP panels who did not have at least four months with family incomes above the poverty line are the “long-term poor.” A few have intermittent months above the poverty line, but most were poor in every month they were interviewed. By comparison, about 11 percent of all the women in our sample were classified as poor in a typical month in the 1990 SIPP panel, about 13 percent were poor in a typical month in the 2001 SIPP panel, and about 15 percent were poor in a typical month in the 2008 panel. Thus, in the 1990 panel, approximately 45 percent (=5/11) of the poor in any given month were “long-term poor.” In the 2001 panel, the long-term share was about 40 percent (=5/13); and in the 2008 panel, the long-term share was about 33 percent (=5/15). The falling share of the long-termers is consistent with other evidence that growing labor force participation and reforms in the 1990s reduced the incidence of long-term poverty (e.g., Blank 2002; Grogger and Karoly 2005).
Columns 2–6 show similar data for different subgroups of women, classified by their modal headship status in the first 24 months of the panel: dual heads (column 2), any other type of family head (column 3), and single-mother (columns 4–6). Among women who were dual heads, almost 98 percent spent some time outside of poverty in all three panels. When we look at the “other heads” group in column 3 (a category that includes single mothers and women living alone), however, we see more variation, with a rise in the share who had at least four months out of poverty between the 1990 panel and the 2001 panel and then a slight decline between the 2001 and 2008 panels. A similar pattern is present for single mothers (column 4), whose probability of having at least four months out of poverty rose from 77 percent to 83.6 percent between the 1990 and 2001 panels and then fell back to 81.5 percent. Classifying single mothers by race (columns 5 and 6), we see relative stability in the share of white single mothers who had at least some time out of poverty. Nearly all of the changes for single mothers were concentrated among nonwhite mothers (column 6), whose probability of having time out of poverty rose from 65.5 percent in the 1990 panel to 77.7 percent in the 2001 panel and then fell slightly.
The lower panel of Table 2 presents estimates of the incidence of new spells of poverty among the families that spent at least four months out of poverty. In 1990, 22.2 percent of all women (17.8 percent of dual heads and 28.8 percent of single heads) entered a spell of poverty in the 25-month period between the fifth and 29th interview month of the SIPP. By 2001, the incidence rate among all women had increased to 27 percent, with particularly large increases for single mothers; but by 2008, some of this rise had been reversed. The net increase in the incidence rate of new poverty spells between our first and third panels was about 1 percentage point for dual heads and 3 percentage points for other heads.
Some caution is required in interpreting these trends because the rise in the fraction of single mothers with some time out of poverty (shown in the upper panel) might be expected to lead to a rise in the incidence of new spells, particularly if the women who move from “always poor” to “having at least a few months out of poverty” have low family incomes and can easily fall into poverty with only a modest income shock.
One way to assess the impact of such potential selectivity biases is to form a lower bound estimate of the rise in incidence by assuming that that 100 percent of the additional women who experienced time outside poverty in 2008 also had a poverty spell. This is equivalent to subtracting row 5 from row 10 in Table 2. Using this maximal adjustment for the changing base number of women outside poverty and at risk of becoming poor, we cannot reject that the risk of entering poverty for single mothers was constant.
An alternative is to estimate simple regression models for the likelihood of a new spell of poverty, controlling for the characteristics of women, including the average level of their family income. We implemented this approach by pooling the 1990, 2001, and 2008 SIPP panels and fitting linear probability models for the event of a new spell of poverty, including dummies for the two later panels and controls for the age and education of each woman, as well as a series of 41 dummy variables indicating the range of family income relative to poverty for the woman in the first four months she was observed in the SIPP. These dummies control very flexibly for the initial level of a woman’s family income and should account for changes over time in the distribution of family income around the poverty line. The resulting estimates of the coefficient on the 2008 panel indicator (shown in row 12 of Table 2) are positive for all subgroups and suggest a rise in the risk of poverty, controlling for women’s characteristics and the average ratio of their family income to the poverty threshold for their family.
We conclude that the incidence of long-term poverty for nonelderly women as a whole in the U.S. was relatively constant between the early 1990s and 2010 but that long-term poverty fell for single mothers—and particularly nonwhite single mothers. At the same time, the risk of starting a new spell of poverty appears to have risen by 1 to 5 percentage points across all groups of women, suggesting that there was an increase in the volatility of family income.
What happens after the start of a new poverty spell?
With this background, we turn to an “event study”–style analysis of incomes and income components around the start of a new poverty spell. We organize the monthly data for newly poor families by time since the initial month of poverty. Thus, for every family, “month 0” is the month their poverty spell began, month −1 is the month immediately preceding the transition into poverty, and month +4 is the fourth month after the initial entry to poverty. We assign a family type to each spell based on the type of family at month −1. By freezing family type just prior to the new spell, we address the fact that family types can evolve (most often, from a dual-headed family to a single-mother family). Finally, to facilitate comparisons across the three panels in our sample, we convert all money amounts to real 2001 dollars.
Figure 1 graphs average monthly family incomes for the pooled sample of all new poverty spells in our three SIPP panels, from four months prior to the start of the spell to 24 months after. The graph shows that the newly poor typically enter poverty because of a large negative income shock, though there is some indication that their family earnings were trending downward in the months prior to the new spell (i.e., a small negative “pretrend”). Within four months, average incomes of the newly poor have recovered about 74 percent of their value in the month just before the spell began; within 12 months, they have recovered about 83 percent; and within 24 months, they have recovered 90 percent.
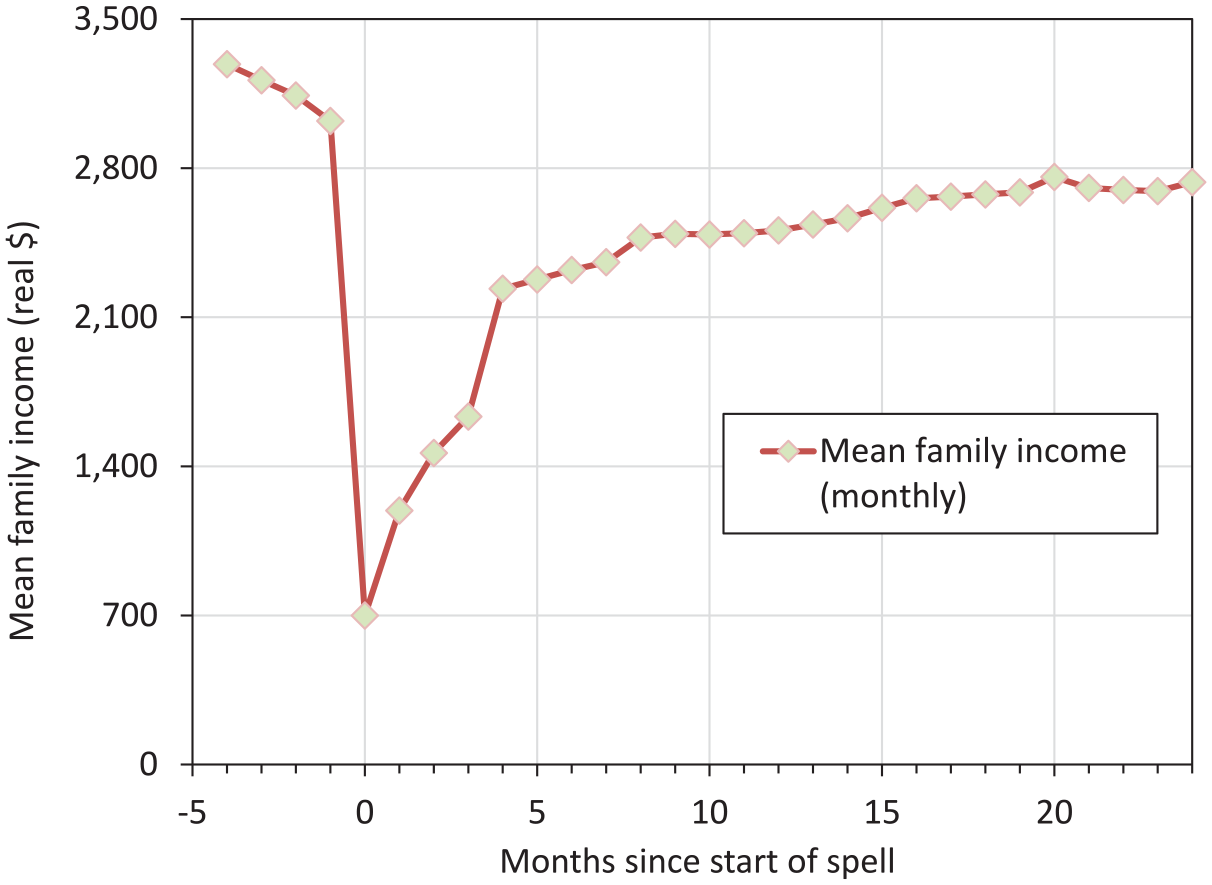
Mean Family Income Around a New Poverty Spell
A close look at Figure 1 reveals that there are relatively large changes in mean incomes of the newly poor at months 4 and 8, and somewhat smaller changes in months 1–3 and 5–7. Previous research (e.g., Moore 2008) has noted two factors that lead to a tendency for larger fluctuations in income and other monthly outcomes every four months in SIPP data: (1) survey members are only interviewed every four months and tend to smooth out fluctuations from month to month in the same interview, and (2) the Census Bureau’s process for imputing missing values tends to generate larger swings in the months between consecutive interviews than in the months that are reported from the same interview. Reflecting this “seam bias” phenomenon, a relatively large share of the new poverty spells we measure start in the first month of an interview wave. Thus, months 0–3 in Figure 1 are typically from one interview, months 4–7 are from the next interview, and months 8–11 are from a third interview. The income jumps at months 4 and 8 demonstrate seam bias at work.
Figure 1 pools the data for newly poor families in all three SIPP panels. How similar were the drops in income at the start of new poverty spells in the different panels, and how stable were the sources of these drops? We address these questions in Table 3. Looking first at the data for all spells in column 1, we see that the initial drop in monthly family income that started the poverty spell was about $2,300 (in 2001 dollars) in the 1990 panel and $2,500 in the two later panels. These represented declines of 67 to 70 percent relative to the mean in the previous four months. On average, about 40 percent of the decline was due to a fall in the woman’s own earnings and 40 to 50 percent to a drop in earnings of other family members. (The remaining share was due to a drop in nonlabor income, including transfers).
Characteristics of the Family Income Change Associated with New Poverty Spells

NOTE: Standard errors in parentheses. Heads with husbands are women who are classified as household head or spouse in husband/wife family in month before start of poverty spell. Heads with no husband are women who are classified as household heads but with no husband/partner present in month before start of poverty spell. Overall sample also includes women who are not heads. Single mothers are heads with no husband who have at least one other family member present in household. New poverty spells are events of poverty in months 5–29 of SIPP that have been preceded by four (or more) months of nonpoverty. Percent change in family income at start of spell (rows 1 and 5) is percentage change from average of four months before spell to initial month of poverty spell. Shares from changes in personal earnings and other family earnings are calculated by dividing change in income source (from four months before spell to month initiating spell) by change in total family income over same interval.
The absolute and proportional declines in income at the start of a spell are larger for women who were in husband-wife families in the month prior to the start of the spell (column 2) than those who were single mothers (columns 3–5). The source of the income losses is also different for dual heads and single heads. For dual heads, only about 20 percent of the family income shock was caused by a decline in their own earnings, while around 70 percent was due to declines in other family members’ earnings. For single mothers, these shares were reversed, with about 55 to 60 percent attributable to a decline in own earnings and 20 to 25 percent attributable to declines in other family members’ earnings. Interestingly, these relative shares were not too different in the three panels.
Some of the decline in other family members’ income for dual heads at the start of a poverty spell is due to family breakups. In about 10 percent of the spells experienced by dual heads, the entry into poverty coincided with the departure of their former partner. This share did not change much over the three panels. In one analysis (not shown), we looked at how dual-headship rates change during a spell of poverty for families that were initially dual-headed and for those that were initially headed by a single mother. Moreover, the continuing decline in dual-headship rates for formerly dual-headed families in the years after entry into poverty suggests that the event of a new poverty spell puts stress on a family that can lead to a breakup. We see almost no rise in dual-headship rates for families that start out with a single female head.
Figures 2 –5 show the evolution of the poverty rate, the mean ratio of family income to the poverty threshold, mean personal earnings, and the mean of other family members’ earnings following the onset of a new spell of poverty for dual heads and single mothers in the 1990, 2001, and 2008 panels. The data in Figure 2 show that after spiking in month 0, poverty rates decline relatively quickly: By month 4, fewer than one-half of women are still poor, and thereafter the poverty rates for both groups of women in all three panels tend to drift downward. Poverty rates of single mothers, however, remain about 10 percentage points higher than the rates for women who were dual heads at onset of their poverty spell for at least two years.
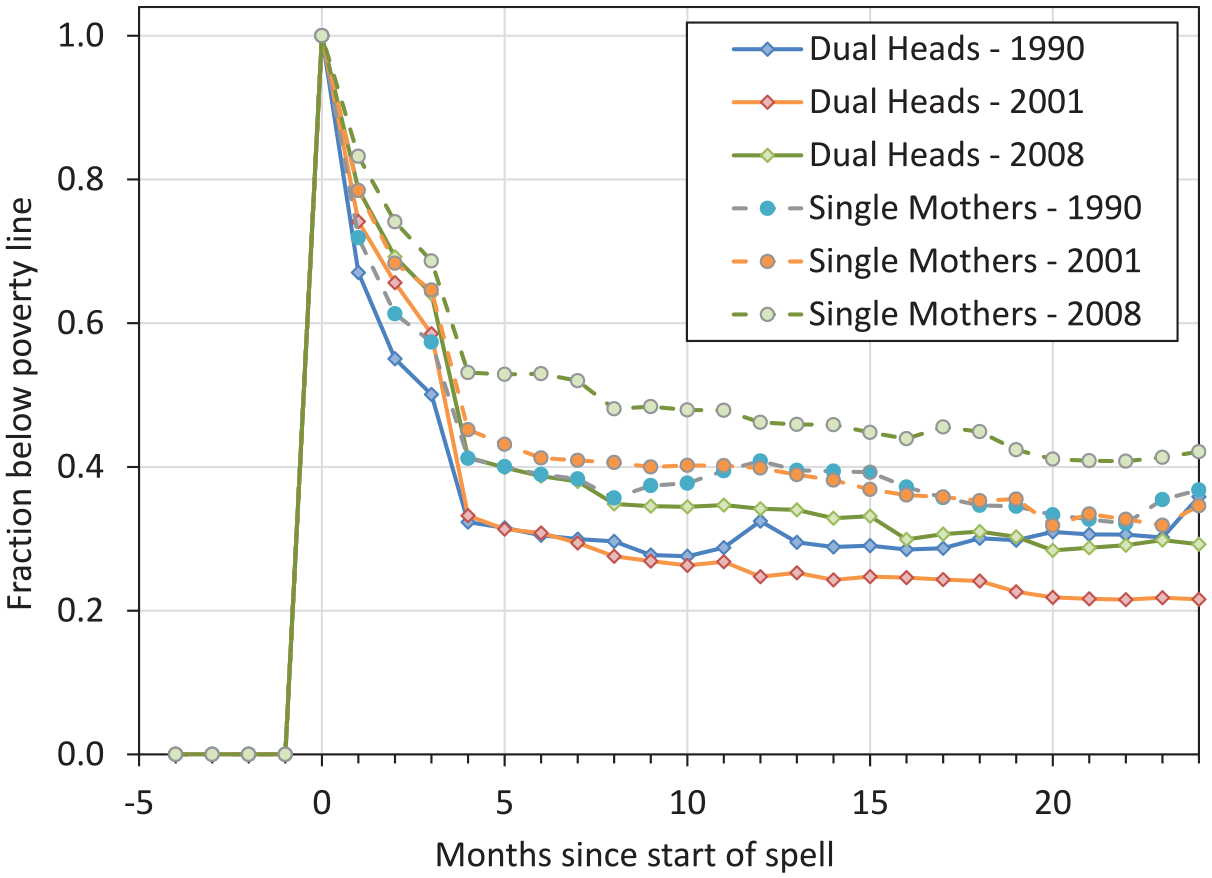
Poverty Rates After a New Poverty Spell
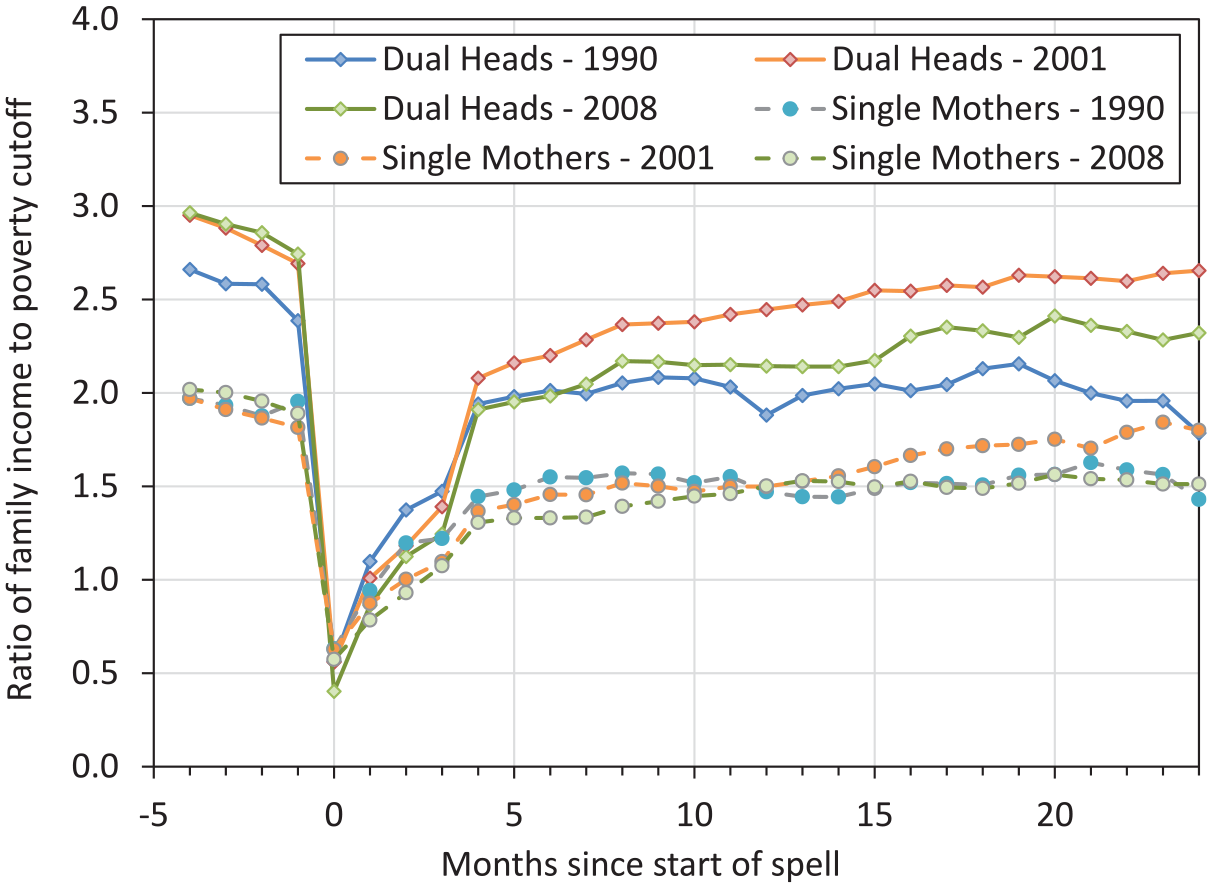
Income/Poverty Cutoff After a New Poverty Spell
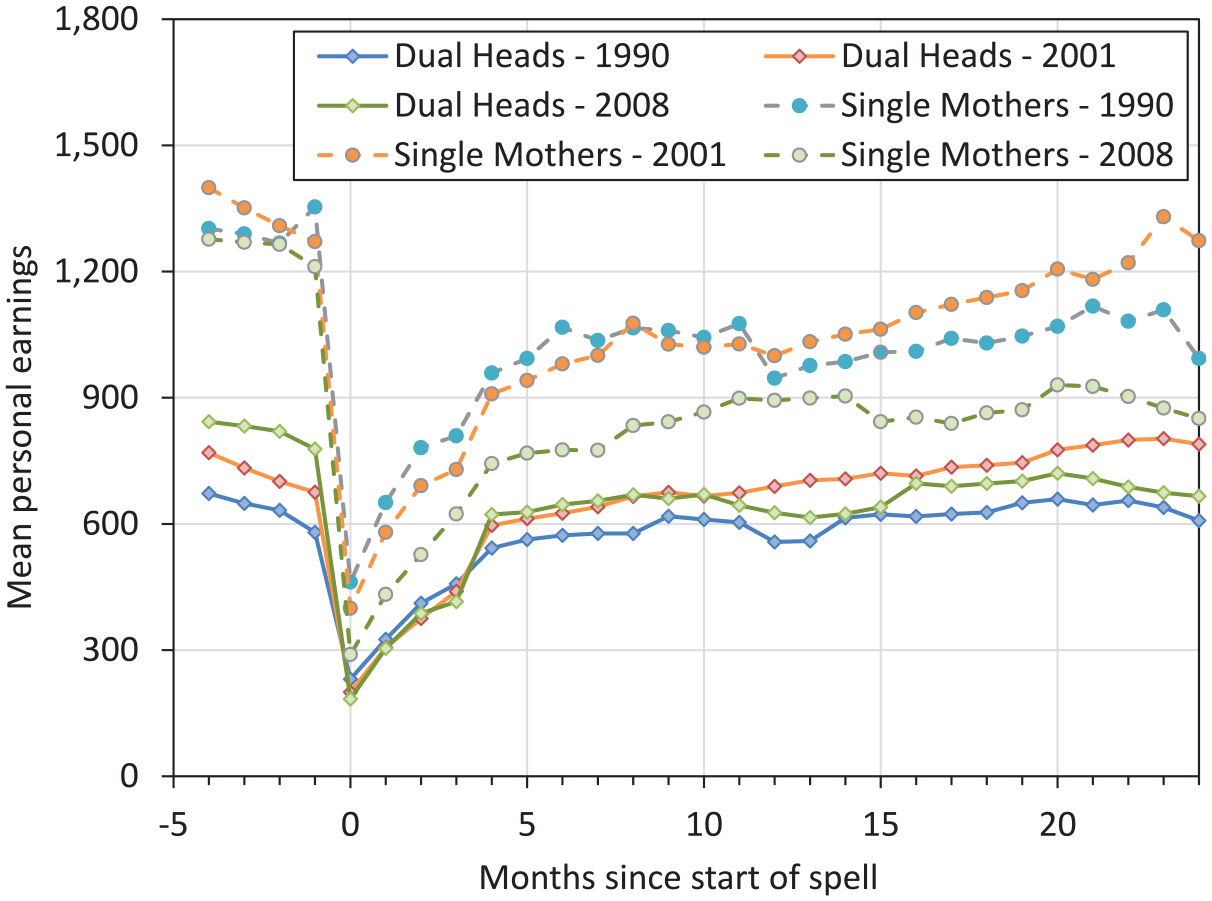
Personal Earnings After a New Poverty Spell
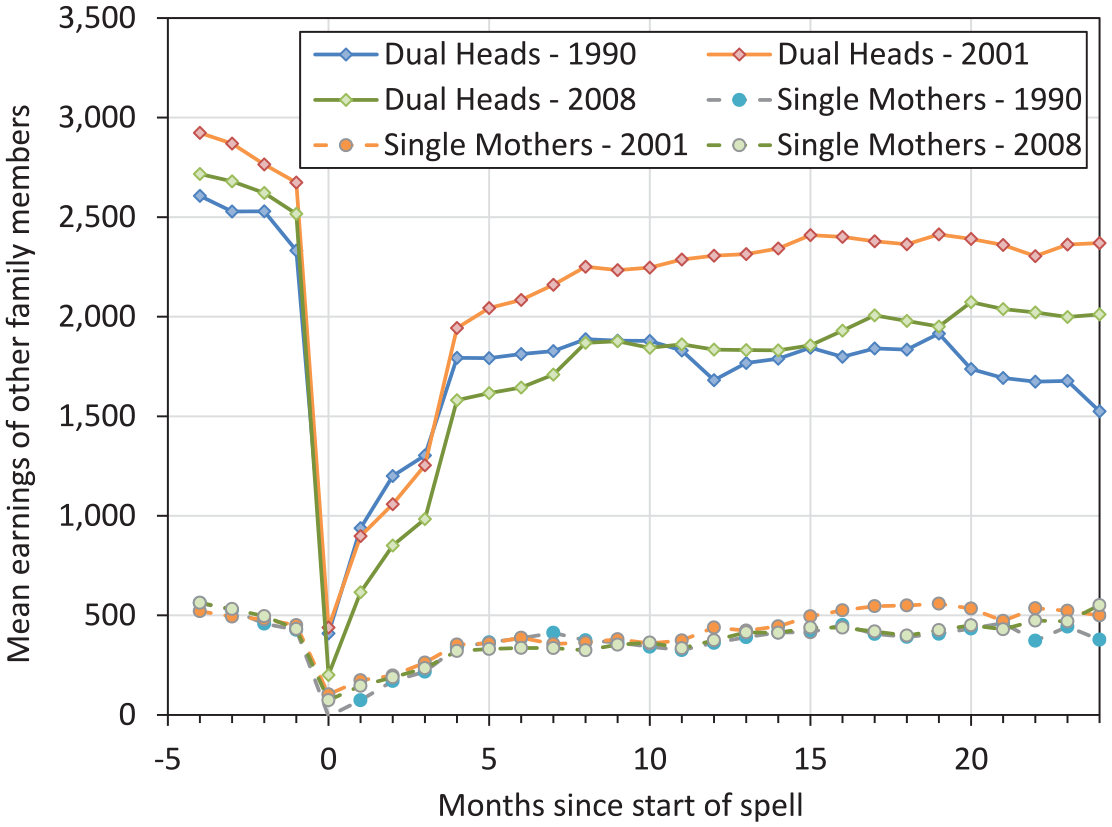
Other Family Earnings After a New Poverty Spell
Figure 3 shows average income-to-poverty-threshold ratios for dual heads and single mothers in the three SIPP panels. (We refer to these as “income-to-need” ratios from now on.) Prior to the spell, single mothers start off with income-to-need ratios in the range of 2 to 2.5—in other words, the average family has income that is 2 to 2.5 times higher than the poverty threshold for their family unit. Two years later, they end up with ratios closer to 1.5. Dual heads start with somewhat higher income-to-need ratios, in the range of 2.6 to 2.9, and end up by month 12 with ratios in the range of 2 to 2.5. The recovery for both groups of women in the 2001 panel was stronger and more sustained than in the earlier or later panels, perhaps reflecting the relatively buoyant economic conditions that prevailed from 2003 to 2005.
Figures 4 and 5 give some insights into the earnings changes underlying the changes in family income-to-need ratios documented in Figure 3. Looking first at the personal earnings of newly poor women, Figure 4 shows that losses in own earnings of single mothers are much larger than the losses of own earnings of dual heads (consistent with the results in Table 3). A year after the start of the poverty spell, personal earnings of newly poor single mothers only recover about two-thirds of their initial levels prior to the spell, with a particularly weak recovery for those who entered poverty during the Great Recession (i.e., those in the 2008 panel). For dual heads, on the other hand, the dips in personal earnings are smaller, and earnings recover 90 percent or more of their initial levels.
To complement this analysis, we looked at changes in the probability of being employed in all weeks of a survey month. Among single mothers, the rate of continuous employment was 70 to 75 percent before the start of the poverty spell, fell by about 20 to 25 percentage points in month 0, and then recovered 7 to 10 percentage points over the next year. From just before the start of the poverty spell to 12 months after, the net loss in the rate of “full employment” was about 14 percentage points for single mothers in the 1990 and 2001 panels and 19 percentage points for single mothers in the 2008 panel. The same comparison for dual heads shows a net loss in full employment of about 4 percentage points for dual heads in the 1990 and 2001 panels and 10 percentage points for women in the 2008 panel.
Looking next at other family members’ earnings, Figure 5 shows a pattern that is the mirror image of Figure 4, with relatively large losses in other family members’ earnings for dual heads and relatively small losses for single mothers (again, consistent with the findings in Table 3). By 15 months after the start of the spell, the earnings of other family members have largely recovered for newly poor single mothers; but for dual heads, the other family earnings have only recovered 70 to 80 percent of their initial values 15 months later.
Some of the persistent losses of other family earnings for dual heads reflect situations where the partners split up and the female is left with relatively low family resources. We suspect that another major share reflects the fact that the entry into poverty by a married woman is often due to a job loss by their husband. A large body of existing work shows that involuntary job losses have large and persistent impacts on male earnings (e.g., Davis and von Wachter 2011).
The Changing Role of Cash Transfers
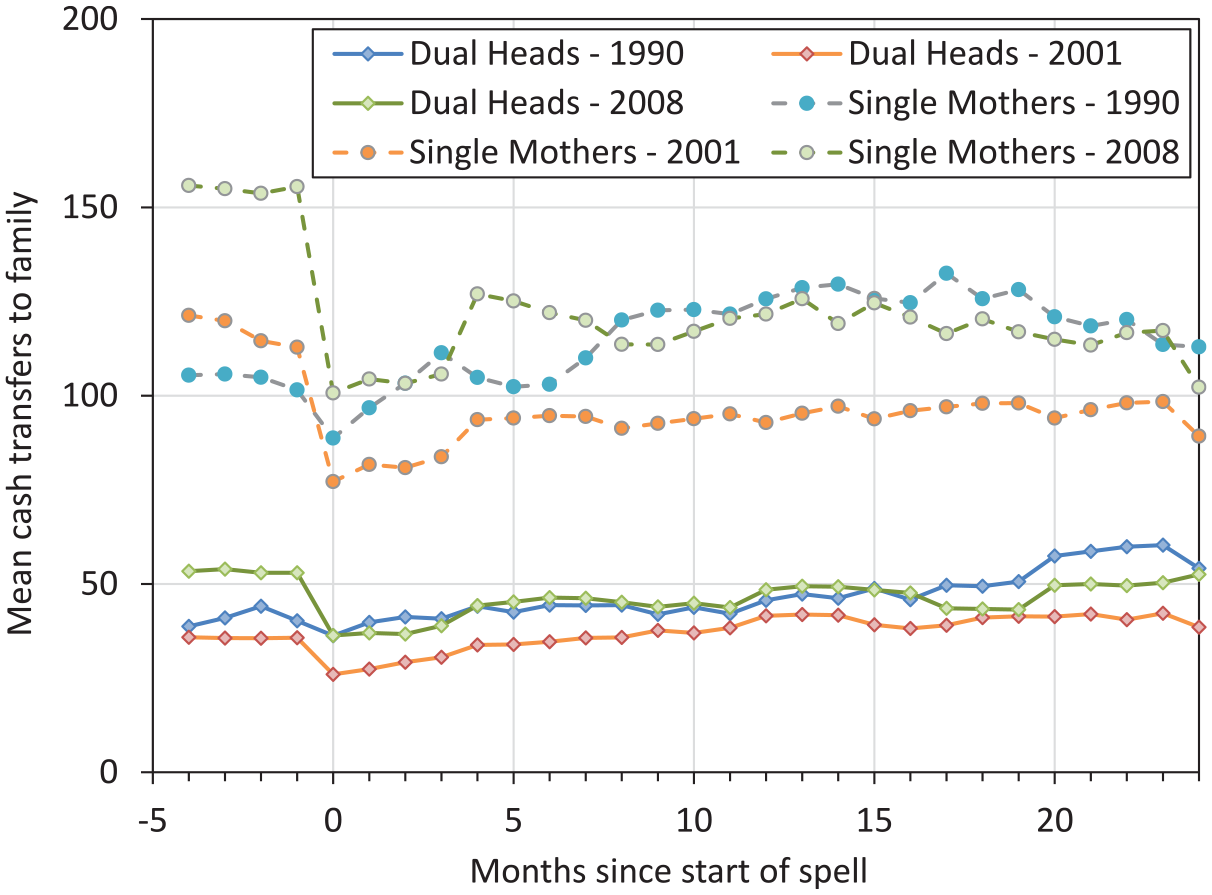
One way to assess the changing role of the social safety net is to look at the responses of transfer income (mainly AFDC/TANF) to the earnings losses that typically led to the start of a new poverty spell. Figure 6 reports average monthly cash transfers received by the families of dual heads and single mothers who enter a new spell of poverty in our three SIPP panels. We note that the fact that cash transfers are underreported in the SIPP (see Meyer, Mok, and Sullivan 2015) by a factor of something like 30 percent suggests the variation in the measured means is attenuated by a factor of about 30 percent.
Cash Transfers to Family After a New Poverty Spell
The figure reveals three interesting findings. First, average cash transfers typically fall when families first enter a poverty spell. The loss of transfer income between month −1 and month 0 adds to the initial income shock that precipitated the new spell, rather than serving as a countervailing factor. Second, cash transfers are relatively small for the families of dual heads and, by 12 months after the start of a spell, have largely recovered to their prespell levels. Third, for single mothers, we see very different patterns of the responses of cash transfers to the onset of poverty in the 1990 SIPP panel than in the two later panels.
In the 1990 panel, there was only a small dip in transfer income for single mothers at the start of the spell (around 10 percent), followed by a relatively rapid rise. Within four months, cash transfers were back to their prespell levels, and they continued to rise, ending up at month 12 around 25 percent higher than they were prior to the spell. Given the losses in single mothers’ incomes (Figure 4), this higher rate of transfers suggests that the cash transfer system available to single mothers in the early 1990s helped to offset losses such as earnings, albeit only partially. Relative to the month just prior to the poverty spell, personal earnings of newly poor single mothers in 1990 were down by about $250 per month at month 12, while their transfer income was up by about $25 per month—a replacement rate of about 10 percent.
In contrast, in the 2001 and 2008 panels, single mothers who entered a spell of poverty experienced relatively large initial drops in transfer income (35 to 40 percent) and experienced only modest recoveries in these totals. A year after the start of the spell, they were still receiving 20 percent (2001 panel) or 30 percent (2008 panel) less in transfer income than before the spell, thus adding to the losses in personal earnings and contributing to the persistence of poverty. It appears that the cash transfer system available to newly poor single mothers in the two later SIPP panels contributed to both the initiation and the persistence of poverty.
SNAP benefits
An important component of the U.S. safety net that is not counted as income for the official poverty measure—or in the family incomes used in Figure 2—is SNAP (known as Food Stamps before 2008). Tiehen, Jolliffe, and Gundersen (2012) show that if SNAP benefits were included in family incomes, the poverty rate (measured in ASEC) would have been 0.4 percentage points lower in 2001 and 2002, 0.7 percentage points lower in 2008, and 0.9 percentage points lower in 2009. The larger impact in later years reflects a trend toward an increasing use of the program in the 2000s, plus a substantial increase in SNAP benefits in 2009.
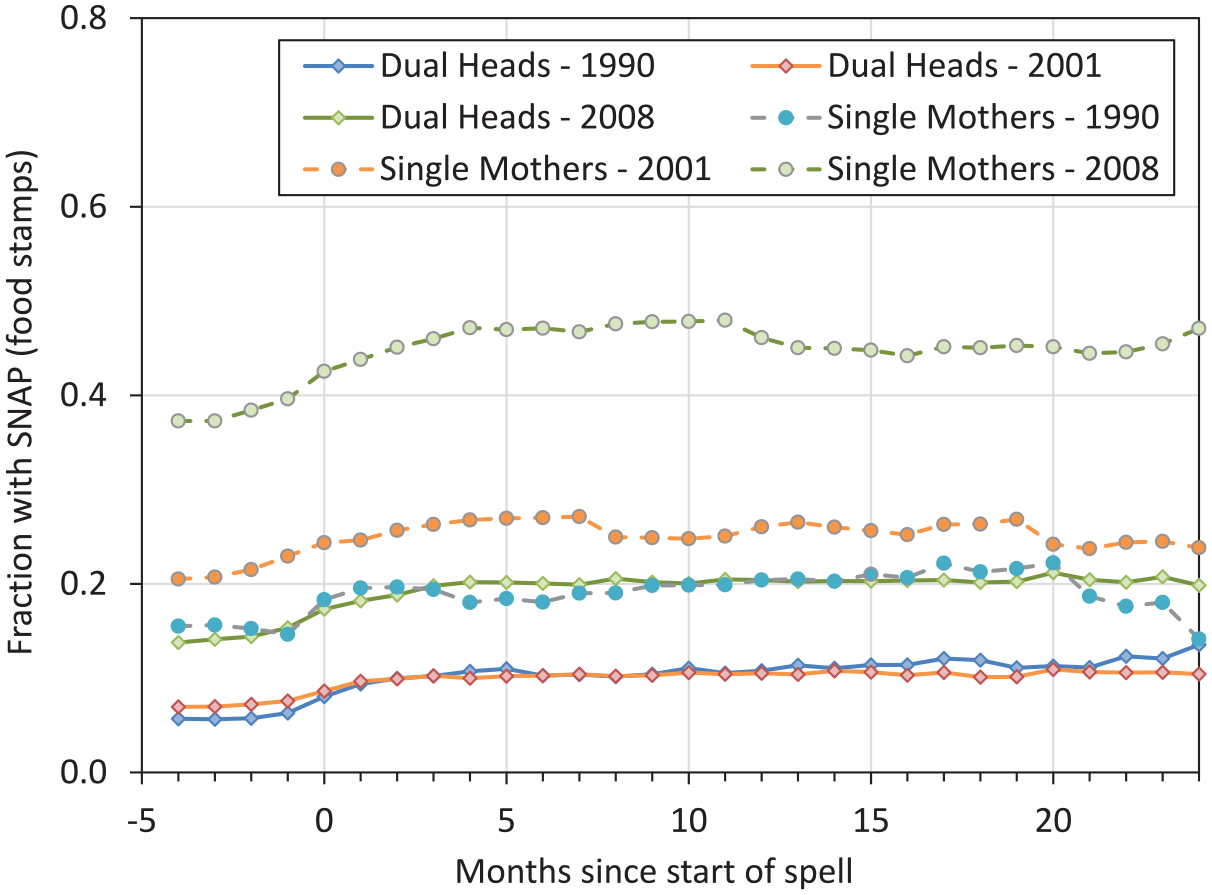
Figure 7 shows the responses of SNAP participation to the entry into poverty for dual heads and single mothers in our three SIPP panels. In contrast to the pattern for cash benefits, there is virtually no dip in month 0. The fact that participation rates are (mostly) rising in the months prior to the new poverty spell, and then rise even faster from months 0 to 4, suggests that families can enroll in SNAP relatively quickly after a drop in earnings. Even with these rises, overall participation rates for newly poor dual-headed families are modest: around 10 percent in month 12 for the 1990 and 2001 panels, and 20 percent in the 2008 panel. Participation is much higher for single mothers who experience a poverty spell, rising from 15 percent just before the spell to 20 percent by month 12 in the 1990 panel, from 22 percent just prior to the spell to 26 percent in the 2001 panel, and from 38 percent just before the spell to 46 percent after in the 2008 panel. The profiles of SNAP participation for single mothers in all three SIPP panels look a lot like the profile of transfer income in the 1990 panel, suggesting that SNAP continued to offset income losses of newly poor families even after TANF.
Fraction with SNAP After a New Poverty Spell
Unfortunately, the 1990 SIPP panel does not report the value of food stamp benefits received in a month, so we cannot compare the profiles of benefit amounts in the three panels. An analysis of the dollar values of SNAP benefits received by women in the two later panels, however, reveals that the time profiles of average benefit amounts closely parallel the profiles of SNAP participation, with clear rises in benefits between months 0 and 5 for both dual heads and single mothers. We can also see the increase in SNAP generosity between the 2001 and 2008 panels, with a roughly 40 percent rise in average monthly benefits at month 12 for single mothers (from around $57 per month to $80 per month) and a 180 percent rise in average benefits at month 12 for dual heads (from $25 per month to $70 per month).
Unemployment insurance
The UI system, which was designed to help offset the earnings losses of recent job losers, can play a potential safety net role for newly poor families that enter poverty because of a job loss. Of course, only a fraction of job losers are eligible for UI (Blank and Card 1991). If single mothers’ increased labor force participation in the 2000s led to a higher share being potentially eligible for UI, however, then UI might have become a more important income source for newly poor single mothers than it was historically. Extended benefits and emergency benefit extensions in place at the peaks of the 1990, 2001, and 2008 recessions also meant that UI payments might be particularly important in our samples (Bitler and Hoynes 2010).
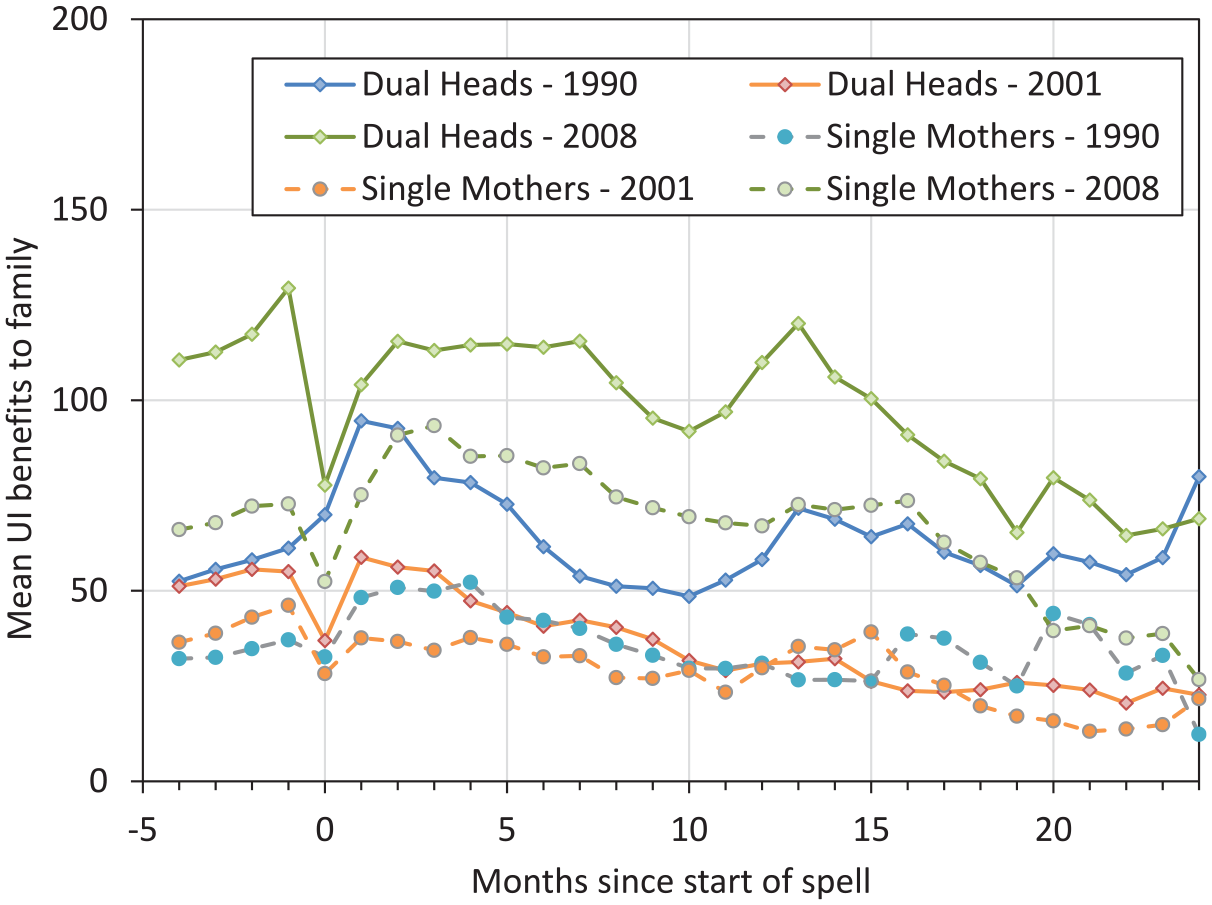
As shown in Figure 8, we find an interesting pattern of UI benefit amounts around the start of new poverty spells in our SIPP samples. 7 Contrary to our expectations, but consistent with the patterns of cash transfer income, we see that the initial entry into poverty was associated with falling UI benefits for single heads in all three panels and for dual heads in the 2001 and 2008 panels. These dips were reversed within the first few months after entering the new spell, and in most cases newly poor families received higher UI benefits at months 5–10 than in the four months prior to the spell.
UI Benefits to Family After a New Poverty Spell
Focusing on months 3 to 10 after the start of the poverty spell, we also note that UI amounts per family fell somewhat between the 1990 and 2001 panels for both single heads and dual heads, then rose substantially between the 2001 and 2008 panels. Presumably the big increases for families entering poverty in the 2008 panel reflect the extensions of UI benefit duration in the later years of the Great Recession. If we compare the UI amounts shown in Figure 8 to the average amounts of SNAP benefits available to families in new poverty spells in the 2001 and 2008 panels, we find that UI meant about as much on average as SNAP for newly poor single women in both panels, but far more than SNAP for newly poor dual heads, reflecting in most cases the response of the UI program to job losses of their spouses.
Conclusions
We have used an event-study approach to compare the implications of entering a new spell of poverty for working-age women in the 1990, 2001, and 2008 SIPP panels. Our method parallels the approach researchers have used to look at implications of being displaced during a mass layoff event, pioneered by Jacobson, Lalonde, and Sullivan (1993). We show that monthly family incomes drop by around 70 percent at the start of a poverty spell, with only a small negative pretrend. For single mothers, most of the decline is attributable to a disruption in their own earnings. For women who were in traditional husband-wife families prior to the spell, most of the decline is due to a drop in other family members’ earnings, including disruptions in their partners’ jobs and (in about 10 percent of cases) the departure of the spouse.
Following the initial income drop, earnings of women and their family members rebound; and within four months, about half of women are out of poverty. Even after two years, however, 20 to 30 percent of dual heads and 30 to 40 percent of single mothers remain in poverty.
As a perspective on American social policy, our focus on the newly poor shows that the U.S. safety net is not particularly responsive to the income losses of people who have begun a new spell of poverty. This is not a new feature of the system and predates the policy changes of the 1990s. Nevertheless, our results suggest that the switch from AFDC to TANF lowered the amounts of money that newly poor single mothers could receive. For newly poor single mothers in the early 1990s, cash transfer payments replaced about 10 percent of their earnings losses at one year after their initial entry into poverty. For newly poor mothers in 2001 or 2008, however, cash transfers were actually lower after entering poverty than they were just before. Thus, for newly poor single mothers, the cash welfare system appears to have transitioned from a small net positive to a net negative.
An important question that remains is how real living standards of families evolve in the period after a dramatic income loss. As we have shown, periods of poverty that involve short-term substantial loss of income are more common than periods of poverty that last for a long time. We can measure family member earnings and some parts of the transfer system (albeit with problems of underreporting), and we can, in principle, measure the value of SNAP and other in-kind benefits. We have less information on the degree to which people can self-insure through savings or loans extended through formal mechanisms, such as credit cards, or informal mechanisms, such as not paying bills or relying on extended family for other forms of assistance. To what extent the newly poor are truly needy remains an open question.
Footnotes
NOTE: This article expands on ideas developed in a paper by Rebecca Blank and David Card in 2008 that was nearly complete by the time of Blank’s passing. We are grateful to Becky for the insights that led to the initial paper and for her notes on an earlier version.
Notes
Rebecca M. Blank was chancellor of the University of Wisconsin–Madison and president-elect of Northwestern University. She studied poverty and its measurement, the social safety net, and the labor market. She served as acting U.S. Secretary of Commerce during the Obama Administration.
David Card is the Class of 1950 Professor of Economics Emeritus at the University of California, Berkeley. He is a labor economist who works on inequality, education, and health topics. He was awarded the American Economic Association Clark Medal and was corecipient of the Nobel Memorial Prize in 2021.
Hanns Kuttner is a research associate at the University of Wisconsin–Madison and was Rebecca Blank’s husband until her death in February 2023.