
Abstract
We extend the work of Haveman et al., a comprehensive analysis of the U.S. social welfare system’s evolution from the start of the War on Poverty through 2012. Their work chronicled changes in the welfare system and in poverty measurement and analyzed poverty levels and trends. We extend the analysis through 2022, finding that the poverty rate declined from 2012 to 2019 mostly because of improvements in the economy and not from changes in the transfer system; in the 2019 to 2022 pandemic period, though, the opposite occurred, as changes in poverty rates were mostly driven by changes in government relief programs. The decline in poverty from 2012 to 2022 followed a run-up in poverty from 2000 to 2012, leaving the nation with no improvement in poverty rates from the economy since 2000. We conclude that significant future reductions in poverty will likely require further improvements in the safety net.
The War on Poverty announced by President Lyndon Johnson in 1964 was an epochal event in the history of antipoverty policy in the United States. It created new antipoverty programs, expanded existing ones, and set the groundwork for other major programs introduced in the early 1970s. Many volumes have been published on the importance of the War on Poverty, chronicling the political events that led to its creation and the political forces that shaped the evolution of the social welfare system in the succeeding years (for example, Bailey and Danziger 2013; Katz 1989; Zarefsky 1986).
Haveman et al. (2015) conducted one of the most comprehensive accounts of how the U.S. welfare system evolved over the 50 years after the beginning of the War on Poverty and how the programs in that system have affected poverty in different eras. The authors first discussed the programs created after the War on Poverty (including job training programs, legal services, Head Start, Medicaid, and Medicare) and how, in the decades that followed, in-kind transfer programs, such as Food Stamps and subsidized housing, grew more than cash programs. They also documented the trend in support away from those with no income and toward those who are employed. Their work, which discussed the development of the Supplemental Poverty Measure (SPM) for more accurately measuring poverty than the Official Poverty Measure (OPM), found that the SPM showed a net downward trend in the poverty rate from 1967 to 2012, although punctuated by periods of increases in poverty. They showed that transfer programs and tax credits reduced the poverty rate by 14 percentage points in 2012 (their final year of analysis) and that the antipoverty effectiveness of those programs grew over time. Importantly, they found that without the effects of tax and transfer programs, the poverty rate showed no long-term trend: in other words, the secular downward trend in poverty was entirely the result of growth in the effectiveness of antipoverty programs. But, at the same time, they found that, although antipoverty programs generated particularly large reductions in the poverty rates of older adults, individuals with disabilities, and Black families, poverty rates among children increased (although these subgroup trends used the OPM, not the SPM). They further found that progress in reducing deep poverty (families living with income less than half the poverty line) had been minimal.
Our article extends their analysis through 2022 and chronicles the same developments from their ending year, 2012, over the subsequent 10 years. We analyze how the social welfare system has evolved over that period and how the antipoverty impact of the programs in the system has changed, and we study the relative contributions of the economy and the tax and transfer system to levels and trends in poverty over the period. We analyze poverty trends for different subgroups, including groups defined by age and family structure, education, race and ethnicity, family size, and also examine trends in near poverty and deep poverty. We find that overall poverty rates declined from 2012 to 2019 but that the downward trend was almost entirely driven by improvements in the economy and in earnings of low-income workers, and not from changes in the generosity or structure of the tax and transfer system. However, we show that the decline in poverty over this period reverses an increase in poverty from 2000 to 2012 reported by Haveman et al., implying that the decline over our period is likely not a long-term trend but instead represents a return to the 2000 level. We also find sharp downward trends in near poverty but essentially no change in deep poverty from 2012 to 2019, again consistent with similar trends over earlier decades reported by Haveman et al.
For the 2019 to 2021 period, on the other hand, we find a sharp reduction in poverty rates resulting from an increase in benefits from the transfer system that offset and counteracted a rise in poverty from the decline in earnings from the pandemic recession. The ending of the temporary pandemic programs and the recovery of the economy left poverty rates in 2022, and the antipoverty effectiveness of the transfer system in that year, about the same as they had been in 2019.
We conclude that further substantial reductions in the poverty rate are unlikely to result from improvements in the economy and are likely to require further improvements in the tax and transfer system. At the end of our period, in 2022, the poverty rate in the absence of the tax and transfer system, though measured somewhat differently, was identical to what it was in 1967. Haveman et al., reporting results from Fox et al. (2015), reached the same conclusion—that the economy had no long-term impact in reducing poverty—for the period 1967 to 2012; and we now reach the same conclusion for the period 2000 to 2019 and also for the period 2019 to 2022. It is on this basis that we conclude that, unless the long-term trend changes, increases in the antipoverty effectiveness of the safety net will be required for further poverty rate reductions.
Other work has reported similar findings to some of ours. Most important, the Census Bureau reports SPM poverty rates and trends annually, and the latest report (Shrider and Creamer 2023) shows similar trends to ours for the 2012 to 2022 period, reports poverty rates for a number of subgroups, and provides some information on the antipoverty effectiveness of different programs. Our article goes into more detail on the contributions of individual programs, more explicitly studies the role of the economy versus transfer programs in affecting poverty, and uses somewhat different subgroup classifications. Also, Wimer et al. (2023) present an entire historical SPM poverty measure from 1967 to 2020. Using mainly an anchored poverty line for 2022 but also the SPM itself, the Center on Budget and Policy Priorities (Trisi 2024) has also studied poverty rates over the 1967 to 2022 period, with findings similar to ours. A Columbia University study that concentrated on the ending of the American Rescue Plan (ARP) Child Tax Credit (CTC) and its effect on child poverty found that, if the ARP CTC alone had stayed in effect in 2022, the SPM child poverty rate would have been 8.1 percent, up from the historic 2021 low of 5.2 percent, but much below the actual 2022 rate of 12.4 percent (Koutavas et al. 2023). Finally, noting the effects of COVID-era policies on child poverty in a cross-national context, Parolin and Filauro (2023) used the SPM—along with an absolute poverty measure and a fully relative measure—to find that, while U.S. child poverty rates were the lowest ever recorded in 2021 (thus moving the U.S. far down in country rankings), the expiration of the ARP provisions moved the U.S. back to a high cross-national poverty rating. 1
In the first section of this article, we discuss the policy evolution of the welfare system, the economy, and demographic composition over the 2012 to 2022 period, followed by a section on our data and approach and then our results. A short summary and conclusion with policy implications end the article.
The Evolution of the U.S. Social Safety Net, the Economy, and Demographic Factors over the Period 2012 to 2022
To chronicle the evolution of the U.S. safety net since the War on Poverty, Haveman et al. divided the period into four eras that differed in terms of overall expansion or contraction of government programs, the extent to which programs emphasized work, whether programs provided cash or in-kind benefits, and other features. They characterized the final period, from 2000 to 2012 (just preceding when our own examination begins), as a period with relatively low creation of new programs and little major change in the structure of those in existence, with the exception of an increase in the CTC’s amount and refundability. (The “refundability” of a tax credit refers to the extent to which the credit is given back to taxpayers when the credit exceeds their tax liability, but with refundability tied to a certain level of earned income.)
The expansions of enrollments and payments during the Great Recession in the 2007 to 2010 period provide another example of expansion without reform in programs’ structures. The major exception to their general rule was the Affordable Care Act (ACA) passed by Congress and signed by President Obama in 2010, which greatly expanded the Medicaid program. On the economy, Haveman et al. noted that the primary economic event in the 2000 to 2012 period was the Great Recession, which increased unemployment and raised poverty rates based on private, market income, but that a recovery had clearly begun by 2012. They noted as well that out-of-wedlock births were continuing to exhibit a very strong upward trend in the 2000 to 2012 period, which would also contribute to increased poverty rates.
Our period of 2012 to 2022 likewise encompasses different eras, with the first being the period from 2012 to 2019 and the second being the pandemic recession years of 2020 and 2021. The first era was characterized by little change in the structure of the major transfer and tax credit programs, with the exception of the Tax Cuts and Jobs Act (TCJA) of 2017, which made significant changes in tax rates for low-income families and in the CTC. 2 Although the dependent and personal exemptions were eliminated, the standard deduction was doubled, with the net effect of greatly reducing federal taxes for families with very low incomes. The maximum credit amount for the CTC was doubled from $1,000 per child to $2,000, the refundable portion was increased (but the credit was not made fully refundable), and the credit was extended to higher-income families, thereby significantly increasing the generosity of the credit and its overall budgetary cost. But the TCJA also changed the inflation index used to update parameters of the Earned Income Tax Credit (EITC), a provision that will cause it to grow more slowly over time.
As for the economy, the 2012 to 2019 period, as part of the long recovery from the Great Recession, was a period of declining unemployment rates, which reached 3.6 percent in December 2019. The labor market began to tighten in the mid-2010s as retirements increased, growth in the prime-age population slowed, and net new immigration was largely halted by the end of Trump’s presidency.
Real wage growth, after declining slightly from 2012 to 2014 (continuing a decline begun in 2009), exhibited a strong upward trend from 2014 to 2019. From 2017 to 2019, minimum wages rose in many states and localities, without short-term negative effects on work—rather, leading to solid real wage and earnings gains from 2012 to 2019 for the first and second quintiles of earners (Romich, Smeeding, and Strain 2021).
The pandemic recession saw a major expansion of transfer programs to counter the negative impacts of the downturn on family incomes, as part of a $5 trillion expenditure over all COVID-19 relief programs. The largest transfer program expansions came via the Unemployment Insurance (UI) program, which was expanded in duration, benefit levels, and eligibility in March 2020, renewed periodically, and not ended until September 2021. A series of three Economic Impact Payments (EIPs) occurred from March 2020 to March 2021, with payments ranging from $600 to $1,400 per tax filing unit and from $500 to $1,400 per person. Supplemental Nutrition Assistance Program (SNAP) benefits were initially raised for recipient households not receiving the maximum benefit, then were raised for all households. 3 Maximum SNAP benefits permanently increased after a congressionally mandated study demonstrated that they were inadequate. The Medicaid program was temporarily required not to terminate recipients, and the federal matching rate for state expenditure was increased to support that requirement. Major federal expansions to the Child and Dependent Care Tax Credit (CDCTC) and the CTC were enacted in 2021. The CTC—previously an annual payment delivered only after filing taxes—was expanded to allow monthly advance disbursements from July to December 2021, with the remainder of the benefit refunded at tax time in 2022 based on income received in 2021. For the first time, both the CTC and the CDCTC adopted “full refundability,” meaning that all low-income families received the full amount of both credits, even if they had no earned income in 2021. The EITC was also temporarily expanded for childless filers and families were given a “lookback” option to use with 2020 or 2019 earnings when filing their 2020 taxes. Small supplements to the Temporary Assistance to Needy Families (TANF) program were provided, and job search and work requirements were suspended. All these program expansions had expired by 2022, when the economy had largely returned to full employment. With the exception of the permanent increase in SNAP benefits, the safety net structure had essentially returned to its 2019 form by 2022.
Since 2012, nonmarital birth rates have been declining after their peak in the late 2000s, especially among unmarried Black and Hispanic women and younger mothers (Kearney, Levine, and Pardue 2022). The age composition of the population continued to show growth in the percentage of the population 65 and over and, in fact, from 2010 to 2020 experienced the largest 10-year increase in the past 100 years (from 13.8 percent of the population to 16.0 percent), reflecting the continued aging of the baby boom generation. The pandemic recession led to a substantial increase in housing costs, leading many younger adults to “double up” and move back in with parents in 2021 and beyond (Cohn et al. 2022; Harvey 2022; Harvey, Dunifon, and Pilkauskas 2021).
Data and Approach
We use the Current Population Survey Annual Social and Economic Supplement (henceforth, the CPS) for our work, using the survey years 2013 to 2023, which report annual income for the years 2012 to 2022. We construct variables for resources and the poverty threshold to be consistent with those developed for the SPM by the U.S. Census Bureau. The threshold is constructed as a point in the distribution of the aggregate spending on food, clothing, housing, utilities, and in-kind transfers, plus a small additional amount for other items, with separate thresholds for renters, homeowners with a mortgage, and homeowners without a mortgage, all constructed from the Consumer Expenditure Survey and with an adjustment for cost-of-living differences across states (see Johnson et al., this volume). Resources include market income (earnings and nontransfer unearned income), cash transfers, in-kind transfers (SNAP; subsidized housing; the Special Supplemental Nutrition Program for Women, Infants and Children [WIC]; the National School Lunch Program; and the Low-Income Home Energy Assistance Program) minus net taxes paid (positive taxes paid minus tax credits, all estimated with the Census Bureau tax calculator). Estimates of medical out-of-pocket expenses, work-related expenses, child care expenses, and actual child support paid are subtracted from resources. 4
We present estimates of poverty rate levels and trends from 2012 to 2022, both overall and for four subgroups defined by age and family type: children, prime-age parents, prime-age childless adults, and older adults. We also show poverty rates by education and other socioeconomic characteristics, including family size. We show estimates for deep poverty (resources less than half the threshold) and near poverty (resources less than 125 percent of the threshold). We examine how much poverty rates are lowered by transfers and tax credits by comparing poverty rates including those transfers to poverty rates calculated from market income alone (i.e., ignoring taxes and transfers).
Results
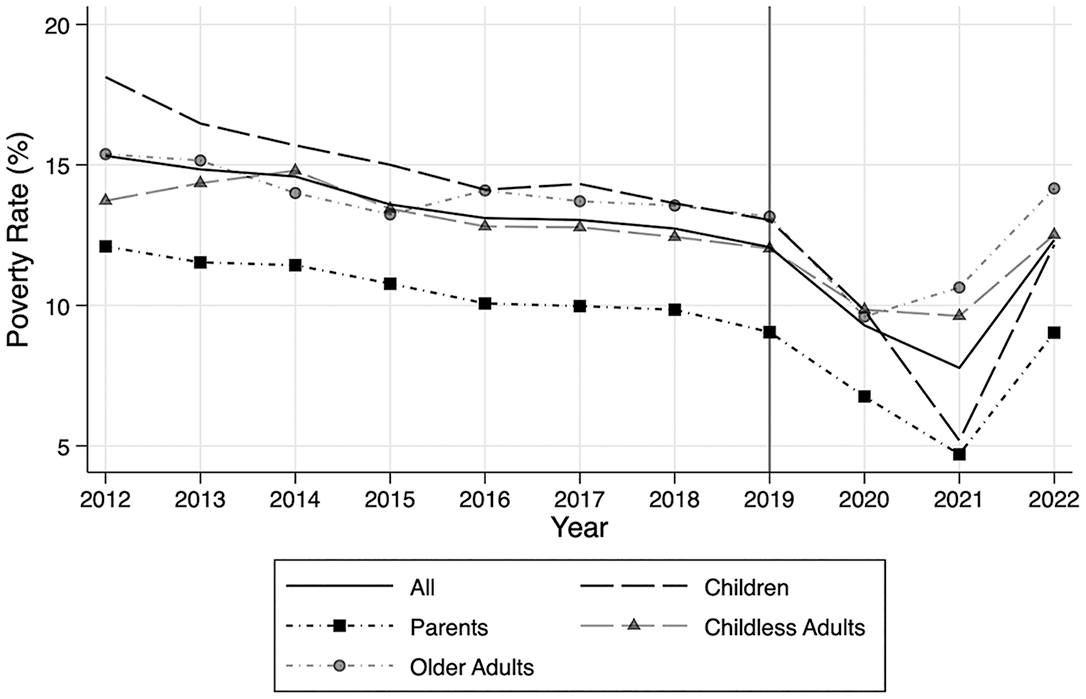
Figure 1 shows the share of individuals in poverty from 2012 to 2022 for the total population and separately for children, prime-age parents, prime-age childless adults, and older adults. Overall poverty rates showed a steady decline over the 2012 to 2019 period, falling from 15.3 percent to 12.1 percent. Poverty rates sharply declined during the 2019 to 2021 COVID-19 period, driven by the unprecedented relief payments described earlier, as we will demonstrate directly below. Poverty rates rebounded in 2022, rising back to 12.3 percent, about the same value as in 2019, therefore resulting in an overall drop in poverty in 2012 to 2022 that was similar to the drop in 2012 to 2019.5,6
SPM Poverty Rates
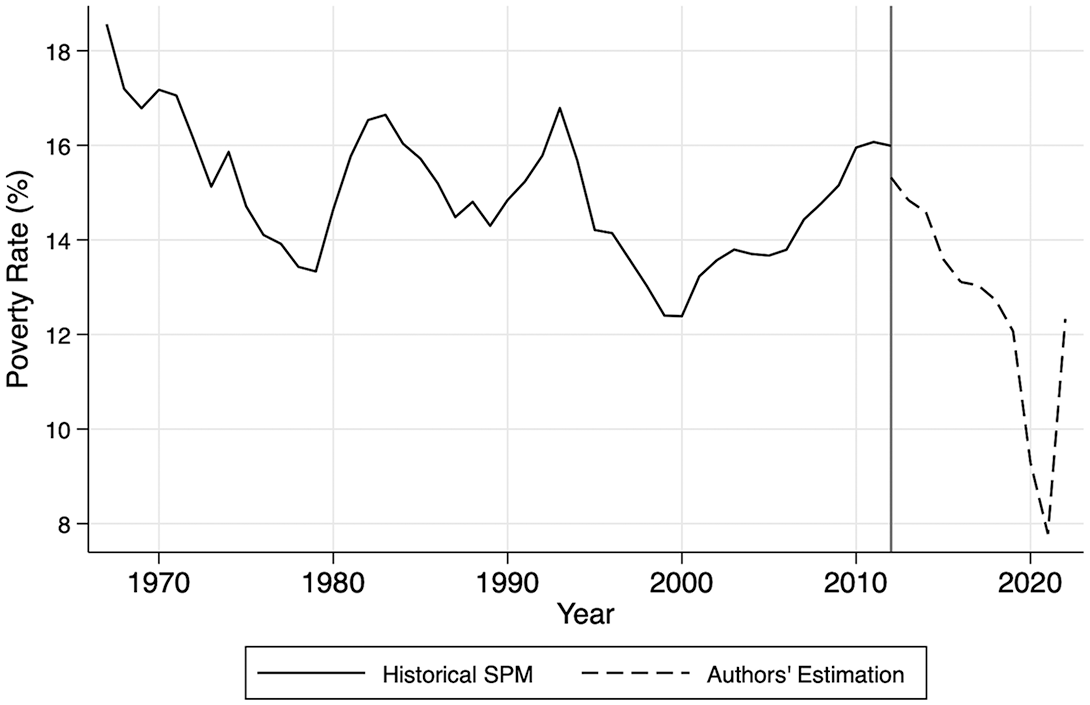
The decline in poverty we have found for the period 2012 to 2019 should be put in the context of trends prior to 2012. Figure 2 shows the trend in SPM poverty from 1967 to 2012 using the historical SPM from Wimer et al. (2023), who updated Fox et al. (2015). (Haveman et al. took their long-term trends from Fox et al. [2015]). 7 The decline we have found represents a reversal of an upward trend from 2000 to 2012, which included the Great Recession and its well-known slow recovery. The poverty rate in 2000 was 12.4 percent, about the same as the 12.1 percent value we calculate it returned to in 2019. However, poverty rates generally had been trending downward from 1967 to 2000, so the downward trend in poverty from 2012 to 2019 represents a return to the general downward trend over the 50 years after the beginning of the War on Poverty.
Historical SPM Poverty Rates
Figure 1 and panel B of Table 1 show how poverty rates changed for the four age-family-type groups across three time periods: 2012 to 2019 (prior to the COVID-19 pandemic), 2019 to 2021 (during the pandemic), and 2012 to 2022 (the longer-term trend). 8 Over the 2012 to 2019 period, the decline in poverty was greatest for children and parents, dropping 5 percentage points and 3 percentage points, respectively. There were slower declines for childless adults and older adults. By 2019, older adult and child poverty rates were about the same for the first time since the start of the War on Poverty. Childless adult poverty rates were very close to the overall poverty rates by 2019.
Level and Trends in Poverty for Different Groups

NOTE: The Other race category includes American Indian, Alaska Native, Pacific Islander, and Multiracial groups.
For other demographic groups, panel C of Table 1 indicates that, although non-Hispanic Black and Hispanic individuals had higher-than-average poverty rates in 2019, they also demonstrated a major decline in poverty rates over the 2012 to 2019 time period—a reduction of 5.2 and 8.3 percentage points, respectively. As shown in panels D, E, and F, primary persons with less than a high school education and single-parent female-headed families also exhibited larger than average declines in poverty over this same period, as did large families of six or more whose composition was changing from parents with lots of children to related multigenerational households—for example, those young adults who are doubling up with their parents and so-called grand-families where older adults are taking care of their grandchildren (Harvey, Dunifon, and Pilkauskas 2021; Cohn et al. 2022; L’Esperance, Grooms, and Smeeding 2024). We note that this group also had the largest drop in poverty from 2012 to 2022 (last column of Table 1). 9
The pandemic recession period (2019–2021) shows quite different trends than that from 2012 to 2019. As has been noted by many others, the recession was the first in modern history to exhibit a decline in poverty rather an increase, with the overall share of people in poverty declining from 12.1 percent in 2019 to 7.8 percent in 2021 (Figure 1 and Table 1). The pandemic poverty decline was much sharper for children (7.9 percentage points) and their parents (4.4 percentage points) than for childless adults or older adults (2.4 and 2.5 percentage points, respectively). There was a large bounce-back of child poverty rates from 2021 to 2022, with child poverty rates returning to those of childless adults but again higher than those for parents. 10 As seen in panels B through F, the decline in poverty from 2019 to 2021 was also larger for families where the primary person was non-Hispanic Black or Hispanic or had less than a high school education, for single-mother families, and for larger families.
Poverty rates increased from 2021 to 2022, returning to a level (12.3 percent) very close to what it had been in 2019. Several particularly vulnerable groups—including children, those with a primary person who is Black or had less than a high school education, and larger families—experienced increases in poverty from 2021 to 2022 but still had rates slightly below what they were in 2019. Most other subgroups had similar, or higher, poverty rates in 2022 than they had had in 2019.
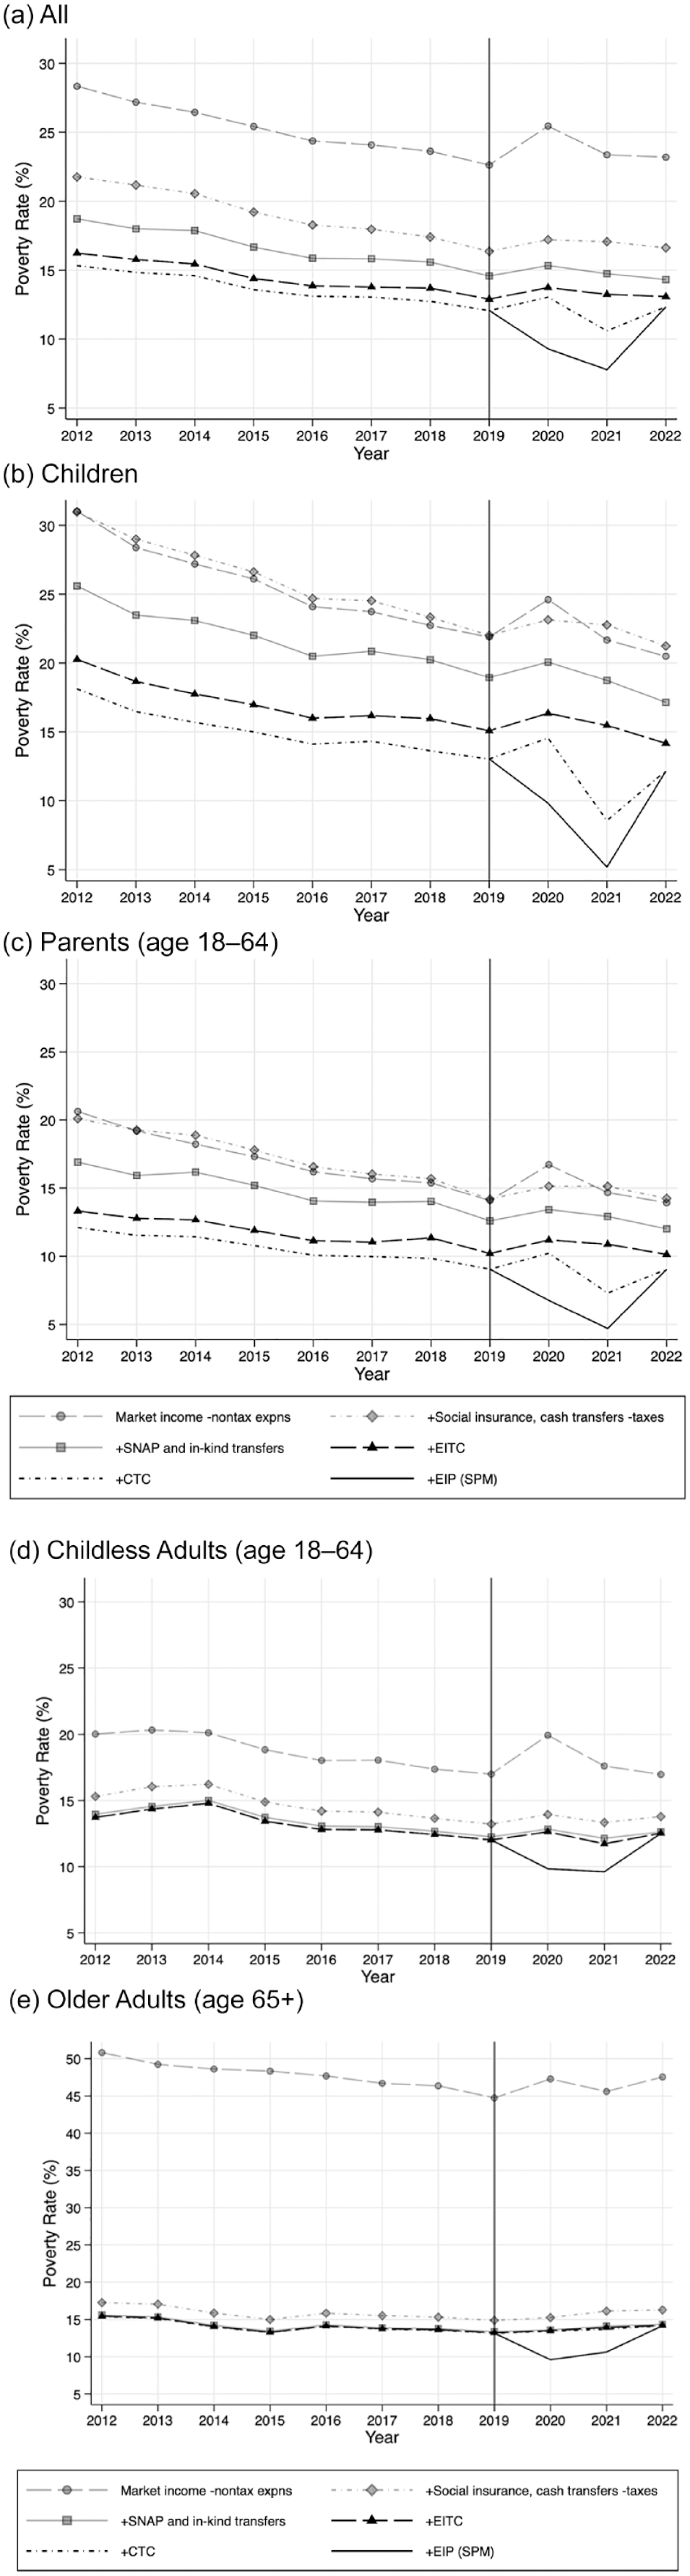
What were the reasons for the declines in poverty from 2012 to 2019 and the decline and rise of poverty in the period 2019 to 2022? What were the relative contributions of the economy and the tax and transfer system and, for the latter, which components were most important in affecting the trends? Figure 3a to 3e show the relative role of changes in market income poverty and taxes and transfers to the poverty rate trends, both for overall poverty and for our four age-family-type groups. Each figure’s top (dashed grey) line is poverty based on market income minus SPM adjustments (the adjustments did not change over time, so this line has the same trend as market income alone) and the bottom line in each figure is the SPM poverty rate, identical to the corresponding lines in Figure 1. The lines in between the top and bottom lines show how poverty is affected by each of the components of the tax and transfer system: social insurance plus cash transfers minus taxes (dotted grey line), SNAP and other in-kind transfers (solid grey line), the EITC (dashed black line), the CTC (dashed black line), and the pandemic EIPs (solid black line).
Poverty Rates by Individual Transfer Components
Taking the 2012 to 2019 period first, and starting with overall poverty in Figure 3a, the top line shows that adjusted market income poverty shows a steady overall decline, implying that the improving economy and increase in earnings in lower-income families contributed to the decline. But the important message from Figure 3a is that, in the pre-pandemic period, the lower SPM line is almost parallel to the upper adjusted market income line, showing that the antipoverty effectiveness of the tax and transfer system changed very little over the period. This is not too surprising for, as we discussed above, there were very few changes in the generosity or structure of the major tax and transfer programs over this period. 11 These results imply that essentially all of the reduction in the overall poverty rate was from increases in market income, which is largely driven by the improvement in the economy and tightening of the labor market during that time. 12
The relative contributions of the economy and the tax and transfer system in the 2019 to 2022 pandemic period to overall poverty were quite different, as Figure 3a indicates. In Figure 3a, as expected, overall poverty based on adjusted market income alone rose from 2019 to 2020 as a result of the sudden and deep recession, then fell from 2020 to 2021 as the economy recovered, and then stabilized from 2021 to 2022. The largest impact on poverty was made by increases in the generosity of two programs: that composed of social insurance, cash transfers, and taxes, which reduced the poverty rate by 2 percentage points more in 2020 than in 2019; and the EIPs, which reduced the poverty rate by 3.7 percentage points in 2020 (they did not exist in 2019). Of the additional 2 percentage point reduction in the poverty rate arising from the first source, our data show that three-quarters of that was the result of the dramatic expansion of the UI program, which we previously noted. In 2021, the effect of social insurance fell as the UI expansions began to be phased out, the EIPs continued to have an impact, and the CTC played a more important role as a result of the 2021 federal expansions of that credit noted above. By 2022, by which time the pandemic programs had been phased out, the overall poverty rate shown in Figure 3a and the effectiveness of the different tax and transfer programs had returned roughly to their levels in 2019.
Figure 3b to 3e show the corresponding lines for our four age-family-type groups. Taking the 2012 to 2019 period first, we note that the top lines for adjusted market income poverty and the bottom lines for SPM poverty are again roughly parallel, signaling that the declines in the poverty rate for all groups were mostly from the economy and not from changes in the tax and transfer system. However, there are different impacts of the tax and transfer system on poverty for the different groups. In Figure 3b, we see the largest impacts for children coming from in-kind transfers and the EITC, more than for any other group. Poverty rates are actually increased by social insurance and cash transfers minus taxes because of taxes paid. The total impact of the tax and transfer system in 2019 was large (8.8 percentage points), the largest for all groups except that for older adults. Figure 3c shows results for parents, for whom, as for children, major reductions in poverty arose from in-kind transfer programs and the EITC. The total impact of the system on parental poverty was 5 percentage points in 2019, somewhat smaller than that for children. Figure 3d shows the results for childless adults, who generally receive fewer transfers compared to other groups. The programs making the largest impacts on their poverty rates are for social transfers, cash transfers, and taxes. The total impact of the system on their poverty rates is 5 percentage points in 2019. A recent series of papers from the Brookings Institution has chronicled how the U.S. safety net does not very well support nonaged childless adults (see Greenstein [2024] for a summary). Figure 3e concentrates on adults aged 65 and over. While market income is not a major measure for retirees, old-age benefits from Social Security make a very large impact on their poverty rate (note the scale of the vertical axis). 13 The total impact of the system on older adults’ poverty rate in 2019 was 31.6 percentage points (29.6 of which was from Social Security), the largest of all four groups. 14
Turning to the 2019 to 2021 pandemic recession period, the same programs with large impacts on poverty for the four groups before the recession continued to have large impacts. However, the 2021 CTC had larger impacts on poverty rates of children and parents than for other groups, as expected, and social insurance had particularly large impacts during the recession on poverty rates of childless adults (as did Social Security for older adults). Interestingly, the EIPs had major impacts on poverty regardless of age or family type and for all four groups.
An important issue in any analysis of poverty is the impact of the tax and transfer system on families when the poverty line is drawn higher or lower than the main (SPM) poverty line. We examine this issue in Figure 4, which shows trends in the overall rates of deep poverty (income less than 50 percent of the poverty threshold) and near poverty (income less than 125 percent of the poverty threshold) over the 2012 to 2022 period, along with the trend in the poverty rate. In each of the three cases, we show the trend in market income poverty as well as SPM poverty; in that way, we are able to assess the antipoverty effectiveness of the tax and transfer system and the ways it has been changing over time in the different regions of the distribution of resources. The solid lines show that, prior to the pandemic, the decline in near poverty was the steepest, falling by 5.3 percentage points from 2012 to 2019, compared to the reduction in overall poverty of 3.3 percentage points. Deep poverty changed very little, consistent with its flat long-term trend noted by Haveman et al. (reporting the findings of Fox et al. 2015), which they attribute to the fact that increases in the generosity of the welfare system over the past several decades have mostly gone to those who are employed and have significant levels of earnings (see also Moffitt and Pauley 2018). Comparing the SPM trends to those for market income, we see that during the pre-pandemic period, the trends are mostly driven by market income, not by any major change in the antipoverty effectiveness of the tax and transfer system, although there was a slight reduction in that effectiveness for overall poverty and deep poverty but not for near poverty through 2019. 15

Deep and Near Poverty Rates
The pattern in the 2019 to 2022 period is quite different, with the declines in poverty very slightly greater for near poverty than for overall poverty and smallest for deep poverty. The reasons for the reductions in the near poverty rate are nearly identical to those for overall poverty in Figure 3a: The EIPs had the largest impact from 2019 to 2020, with UI second, and the CTC had an additional large impact in 2021 (results not shown in the figure). The near poverty and deep poverty rates, like those for overall poverty, returned to their approximate 2019 levels by 2022.
Finally, it is well known that the underreporting of income sources, especially income transfers, compared to administrative records may be a problem of increasing importance in the CPS data that underlie this article (Meyer and Wu 2024; Meyer, Mok, and Sullivan 2015). We make a rough adjustment for benefit underreporting, adjusting benefit receipt to control totals for several programs, described in the online appendix. The net result is that this adjustment reduces the level of poverty but does not impact poverty trends.
Summary and Conclusions
This article analyzes how poverty rates and the impacts of the welfare system evolved from 2012 to 2022. We analyze poverty trends for different subgroups, by age, race-ethnicity, education level, and family type and size, as well as trends in near poverty and deep poverty. We find overall poverty rates declined from 2012 to 2019, reversing the upward trend from 2000 to 2012 reported by Haveman et al. (2015) and indicating a resumption of the long-term downward trend since 1967 that they found. We also find that the downward trend from 2012 to 2019 was almost entirely driven by improvements in the economy and in earnings of lower-skilled workers and not from any change in the generosity or structure of the tax and transfer system. We find slightly sharper downward trends in near poverty rates than in poverty rates and essentially no downward trend in deep poverty rates from 2012 to 2019. The groups whose poverty rates dropped the most from 2012 to 2022 were those in larger families, in families headed by less-educated adults, in male- and female-headed families with children, and in families headed by Black persons—all indicating progress for groups that have been traditionally the most disadvantaged. It is clear, though, that most of the decline from 2012 to 2019 was driven by market incomes and not by expansions of the safety net.
While these market-driven reductions in poverty are welcome, we view it unlikely that significant poverty reductions will continue from improvements in market income alone. We have found the improvement in the economy from 2012 to 2022 only brought SPM poverty based on market income alone back down to its 1967 level, thus resuming the lack of long-term reductions in market income poverty from 1967 to 2012. Unless this long-term trend changes, better income support will be needed for further reductions in poverty to be achieved. Some macroeconomists are forecasting a new recession in the next several years, which will further prevent any poverty reductions from market income alone.
Public policy is effective today because of work-oriented programs that reach those close to the poverty line and those in near poverty (e.g., the CTC and EITC for children, health insurance programs that reduce medical out-of-pocket spending, subsidized child care, and SNAP). While the amount by which transfer programs reduced poverty in 2022 was slightly less than it was in 2012, there was little overall change in the antipoverty impact of the system over the period we examine. Further, the public policy improvements we are mentioning have done little to reduce deep poverty.
The return of a larger monthly CTC is one policy that would help reduce child poverty, but its impact on deep poverty will be strongest if it is fully refundable and delivers benefits to all of the lowest-income families with children. Added child care support and greater low-income subsidies for health insurance, as well as limiting out-of-pocket costs, would allow low-income working families to keep more of their market earnings and keep more older adults out of poverty due to medical expenses. 16 An expanded EITC for childless adults and more generous and more uniform state UI system would help childless adults as well. The bottom line is not far different than it was in our 2015 article. We need a better safety net if we are to further reduce the poverty rate below 10 percentage points.
Supplemental Material
sj-docx-1-ann-10.1177_00027162241289754 – Supplemental material for Legacies of the War on Poverty
Supplemental material, sj-docx-1-ann-10.1177_00027162241289754 for Legacies of the War on Poverty by Leslie McGranahan, Diane W. Schanzenbach, Sung Ah Bahk, Robert Moffitt and Timothy M. Smeeding in The ANNALS of the American Academy of Political and Social Science
Footnotes
NOTE: The authors would like to thank the participants of the Authors’ Conference in Memory and Honor of Rebecca M. Blank at the Federal Reserve Bank of Chicago, February 22–23, 2024, as well as John Creamer, David Johnson, Diane Whitmore Schanzenbach, Christopher Wimer, and James Ziliak for their helpful comments. The authors would also like to thank John Creamer, Liana Fox, and David Johnson for assistance with the treatment of breaks in the CPS poverty series. This article is dedicated to the memory of Rebecca M. Blank and to the memory of the other two coauthors of the paper that this work extends, Robert Haveman and Geoffrey Wallace.
Supplemental Material
Supplemental material for this article is available online.
Notes
Sung Ah (Sue) Bahk is an assistant professor of economics at American University. Her research focuses on labor market transitions, labor supply decisions, inequalities in the labor market, and poverty measurement.
Robert Moffitt is Krieger-Eisenhower Professor of Economics at Johns Hopkins University, with a joint appointment in the Johns Hopkins Bloomberg School of Public Health. His research focuses on the economics of the labor market, the family, welfare systems for the poor, and public policy in these areas.
Timothy M. (Tim) Smeeding is Lee Rainwater Distinguished Professor of Public Affairs and Economics, and Hilldale Professor Emeritus, in the La Follette School of Public Affairs at the University of Wisconsin–Madison. His research is on poverty, inequality, and socioeconomic mobility in national and cross-national contexts.
References
Supplementary Material
Please find the following supplemental material available below.
For Open Access articles published under a Creative Commons License, all supplemental material carries the same license as the article it is associated with.
For non-Open Access articles published, all supplemental material carries a non-exclusive license, and permission requests for re-use of supplemental material or any part of supplemental material shall be sent directly to the copyright owner as specified in the copyright notice associated with the article.