
Abstract
Wealth is a buffer against economic shocks and the intergenerational transmission of disadvantage. We investigate the wealth of single-parent households in six high-income countries that span a variety of institutional contexts and welfare regimes. Using household survey data, we show that single-parent households in all these countries are disadvantaged in the wealth they hold, compared to dual-parent households—more so in Great Britain, France, Germany, and the United States; and less so in Italy and, especially, Spain. We tease out major differences in types of wealth holdings in single- and dual-parent households. We find that the single-parent wealth deficit is not explained by differences in age or number of children but that it is influenced by education, income, homeownership, and receipt of intergenerational transfers. We discuss the policy implications of our findings, both in terms of how single parents are treated in social protection and taxation systems and, more broadly, in the supports they require if they are to overcome barriers to accumulating wealth.
Household wealth plays a key role in coping with economic shocks and with the intergenerational transmission of advantage and disadvantage. The vulnerability associated with having little or no property wealth or financial buffer to fall back on is particularly salient in a major economic shock such as the ongoing COVID-19 pandemic crisis (Kuypers et al. forthcoming). The long-term implications of parental wealth or its absence for progress through the education system and the labor market are also now better understood (Pfeffer 2018). Among the many challenges faced by single parents, the presence of a wealth deficit among them (compared with dual-parent households) would represent a major additional disadvantage, one that would carry serious implications for current living standards and economic security and for the well-being of their children and opportunities that are available to them.
Some single-country studies have suggested that single parents do indeed face a wealth deficit compared to dual-parent households (e.g., Lersch et al. 2021), as do the few studies that have adopted a comparative perspective (Sierminska, Smeeding, and Allegrezza 2013; Sierminska 2018). Here we probe the household wealth situation of single-parent households in six rich countries and highlight insights into the processes that might contribute to household wealth differentials. We employ data from high-quality household wealth surveys to compare the wealth of single- versus dual-parent households in France, Germany, Great Britain, Italy, Spain, and the United States, countries spanning a variety of economic trajectories, institutional contexts, and welfare regimes. We then disaggregate wealth into its main components and explore the prevalence of key forms of household wealth, including principal residence (for homeowners), other property, physical wealth, and financial or business assets: these analyses show where the major divergences between single- and dual-parent households arise. We then probe the relationship between the wealth penalty of single-parent households and a set of relevant sociodemographic characteristics including age, number of children, and education. Finally, we assess the role played by direct transfers of wealth from the previous generation as potentially explanatory of wealth gaps among single- versus dual-parent families: we do this for both higher-income and lower-income households, exploiting data on receipt of inheritances and gifts also obtained in these surveys. The policy implications of the findings are then addressed, both with respect to how single parents are treated in social protection and taxation systems and more broadly in terms of the supports they require to overcome the barriers to accumulating some wealth.
In brief, our key findings are that single-parent households are, on average, disadvantaged in terms of current wealth levels and that this disadvantage is sufficiently substantial to have major implications for the children growing up in those households. This is due to both the reduced likelihood of single parents being homeowners or home occupiers and their lower-average levels of wealth in other forms, like property and financial assets. Also, in many cases, single-parent households have higher levels of debt. The wealth deficit is not explained by differences in the parents’ age or number of children, but it does seem to be conditional upon their education and the receipt of transfers from older family members. While their lower income clearly plays a considerable role in the lower wealth levels held by single-parent households, we also find that receipt of significant intergenerational transfers is—in most of the countries analyzed—a factor associated with a substantial difference in wealth between single- and dual-parent households.
The context for this examination of single-parent household wealth deficits is set out in more detail in the section below. We then go on to describe the data and variables that we employed in our analysis, and then present an overview of the education, income, and the wealth of single- versus dual-parent households, and then the results from estimation of a statistical model that helps to elucidate what lies behind the differences observed in their wealth levels. Section 5 discusses the implications of our findings in terms of strategies and policies that might be employed to address single-parent household wealth deficits.
What We Know from Prior Research
Single-parent households face a complex set of challenges and barriers to economic advancement and social mobility. Parental wealth is one of the key influences on the well-being of children and their prospects for the future. Wealth can serve as a buffer against changes to household living standards that might be brought on by parental unemployment or health crises. Wealth can also fund investments in children’s education; act as a safety net for their educational and occupational choices; and be directly transferred from parents to children to assist them “get on the housing ladder,” start a business, or build their own wealth in other ways (Lersch et al. 2021; Rodems and Pfeffer 2021). Parental wealth is positively related to various well-being outcomes, including health, and is also a key determinant of offspring’s cognitive skills and educational attainment (Pfeffer 2011). Research using survey microdata has shown that the correlation between the income and wealth of households is substantial but far from perfect (Jäntti, Sierminska, and Smeeding 2008). While mean and median wealth levels are particularly low for low-income households, some such households do have significant wealth, while some higher-income households have little or none (OECD 2021). This means, for example, that measuring poverty on the basis of both income and wealth rather than simply income will produce a different picture of who is poor (Kuypers and Marx 2021). The fact that we cannot simply “read off” a household’s wealth from its income, alongside the key role that wealth plays in underpinning current living standards, economic security, and future prospects for children, serve to motivate our interest in the wealth of single parents.
Previous studies have found that parenthood per se can be connected to the gender income and wealth gap, with a greater motherhood than fatherhood penalty (Lersch, Jacob, and Parenthood 2017). Also, for single individuals, controlling for parenthood, women seem to accumulate less wealth at the time of retirement (Gornick and Sierminska 2021). However, although single mothers still have a further disadvantage over single fathers, the single-parenthood wealth penalty has been found to be of greater magnitude than the gender wealth gap (Yamokoski and Keister 2006).
Single parents might have less wealth on average than dual-parent households for a variety of reasons. The most obvious is that if they have lower household incomes, it will be reflected in lower capacity to save, invest, and accumulate wealth. That lower household income in turn may arise due to lower individual earnings (itself reflecting a complex range of factors) combined with the fact that there is only one (potential) earner rather than two. Single-parent households may also face higher costs than dual-parent ones, including for childcare. Furthermore, direct wealth transfers from the previous generation play a significant role in wealth accumulation, and single-parent households may also be relatively disadvantaged in that respect: only their parents, not a partner’s parents, are a potential source of transfers; and if they are on lower income when receiving a transfer, they may be more likely to consume than save it. As Sierminska (2018) emphasizes, the path by which one becomes a single parent clearly matters for how all these processes operate: those who have never married may well have had less opportunity to accumulate wealth than those who are divorced, separated, or widowed.
The only previous comparative studies on the topic we know of are Sierminska, Smeeding, and Allegrezza (2013) and Sierminska (2018). Both use microdata brought together in the Luxembourg Wealth Study and find wealth levels of single-parent households in various rich countries are only about half those of dual-parent households. (Sierminska [2018], for example studies Australia, Canada, Finland, Greece, Italy, the UK, and the United States.) Here we build on that work by making use of microdata described in the next section to analyze wealth levels and composition together with intergenerational wealth transfers for single parents in six large rich countries.
In doing so, we emphasize that the characteristics associated with single parenthood, rather than the status of being a single parent itself, may contribute to an observed disadvantage with respect to wealth, as is also the case for other critical outcomes such as earnings and unemployment. This makes it extremely difficult to identify the impact of single parenthood per se as a causal variable.
Our Data and Analytic Approach
We exploit the availability of microdata from household surveys of large, representative samples of the population in a range of rich countries. These surveys contain questions about wealth and related topics. Here we focus on Great Britain, France, Germany, Italy, Spain, and the United States; a set of large rich countries that represent a variety welfare state arrangements; and differences among them in composition of wealth and income and wealth inequality. The data for the United States is from the Survey of Consumer Finances (SCF); for France, Germany, Italy, and Spain, it comes from the Household Finance and Consumption Survey (HFCS); and for Great Britain, it is from the Wealth and Assets Survey (WAS). More details on these surveys are provided in Appendix 1 with only key points noted here.
We employ data from wave 1 of the HFCS, from the SCF for 2010, and from wave 3 of the WAS, all relating to a period around 2010. This is the earliest date covered by the HFCS, which was introduced at that point to provide harmonized survey data on wealth and relating topics for countries in the Eurozone. The WAS began earlier, in 2006–08, and unlike the other surveys is longitudinal rather than cross-sectional in design; we use wave 3 to align with the timing of HFCS (which is particularly important as the global financial crisis impacted from 2007–2008). 1
The household is the unit of analysis we employ throughout. 2 The measure of wealth is the standard one covering real assets—in the form of principal private residence, second homes, properties rented out, cars, jewelry, and art, own businesses, and financial assets (including stocks and shares, bank accounts and other deposits, etc.) net of outstanding debt (including mortgages, bank borrowings, credit card debt, and student loans). The value of occupational pensions or entitlements to public pensions is not included, as estimating their value in a consistent fashion is problematic. All values in all countries are presented in U.S. dollars (USD) terms for comparability. The income variable available in these surveys is total gross household income. Income after direct taxes and social insurance contributions are deducted—that is, disposable income—would be preferable for current purposes but is not available.
We do not equivalize either wealth or income to adjust for differences in household size and composition in the main analyses we present. The literature is divided on whether or in what contexts equivalizing wealth is appropriate: if wealth is seen primarily as adding to the ability to consume, then economies of scale in consumption arise and would argue for equivalization; but if a key role is providing economic security and economic and social power/status, then total unequivalized wealth is more relevant. Here we have chosen to focus for the most part on total household wealth on the basis that this is critical from the children’s perspective of the children—for example, having a large valuable house with a garden is very different from renting a small apartment, even if there are more adults and/or children in the former, where adjusting for household size would narrow the gap. For comparison, equivalized measures for the main variables are also provide in the supplementary online material in Appendix 2. The household reference person (HRP) is defined in the WAS and HFCS as the highest earner of the household (in case of equal earnings, the older) and in the SCF as the person responsible for the household finances and answering the survey.
Single-parent households we define and measure as those containing a child—aged under 18 years—and one parent of that child (or children) who is the HRP. Dual-parent households are those containing someone aged under 18 years and at least one parent who is the HRP and has a partner living in the household. Our measure of single-parent households will thus not cover single parents living in a household with other adults, one of whom is the HRP—most often, in practice, a single mother living with her parents. It is quite unclear what access such a single parent has to the wealth of that broader households, so they require separate study: they account for only a small minority of single parents in the countries we are studying.
Findings: The wealth of single-parent and dual-parent households
We first look at some key features of the households we are studying. Table 1 shows that single-parent households account for about 10 to 12 percent of all the (parental) households in our sample from Germany, Italy, and Spain; for about one-fifth in France and the United States; and for as many as one-quarter in Great Britain. There is little age difference on average between single parents and the HRP in dual-parent households. Most single parents are female; the HRP in dual-parent households is male in about half those households in Germany, Spain, and the United States; and a majority of HRPs in dual-parent households are male in the other countries. Single-parent households have marginally fewer children on average except in Spain, but this is by no means as important a difference as might have been anticipated. Single-parent households have fewer tertiary-educated HRPs in Great Britain, France and the United States in particular. Single-parent households have lower incomes on average than dual-parent households everywhere, but the extent of that difference varies considerably, with single-parent households having half the average income of dual-parent ones in France and Spain; about 40 percent in Germany, Italy, and Great Britain; and as little as one-third in the United States. (These income gaps narrow somewhat when income is equivalized but remain very substantial—see online Appendix 2, Table 1). One might expect these varying income differences to be highly consequential for other aspects of the circumstances of single- versus dual-parent households, including for their wealth levels.
Features of Single-Parent versus Dual-Parent Households
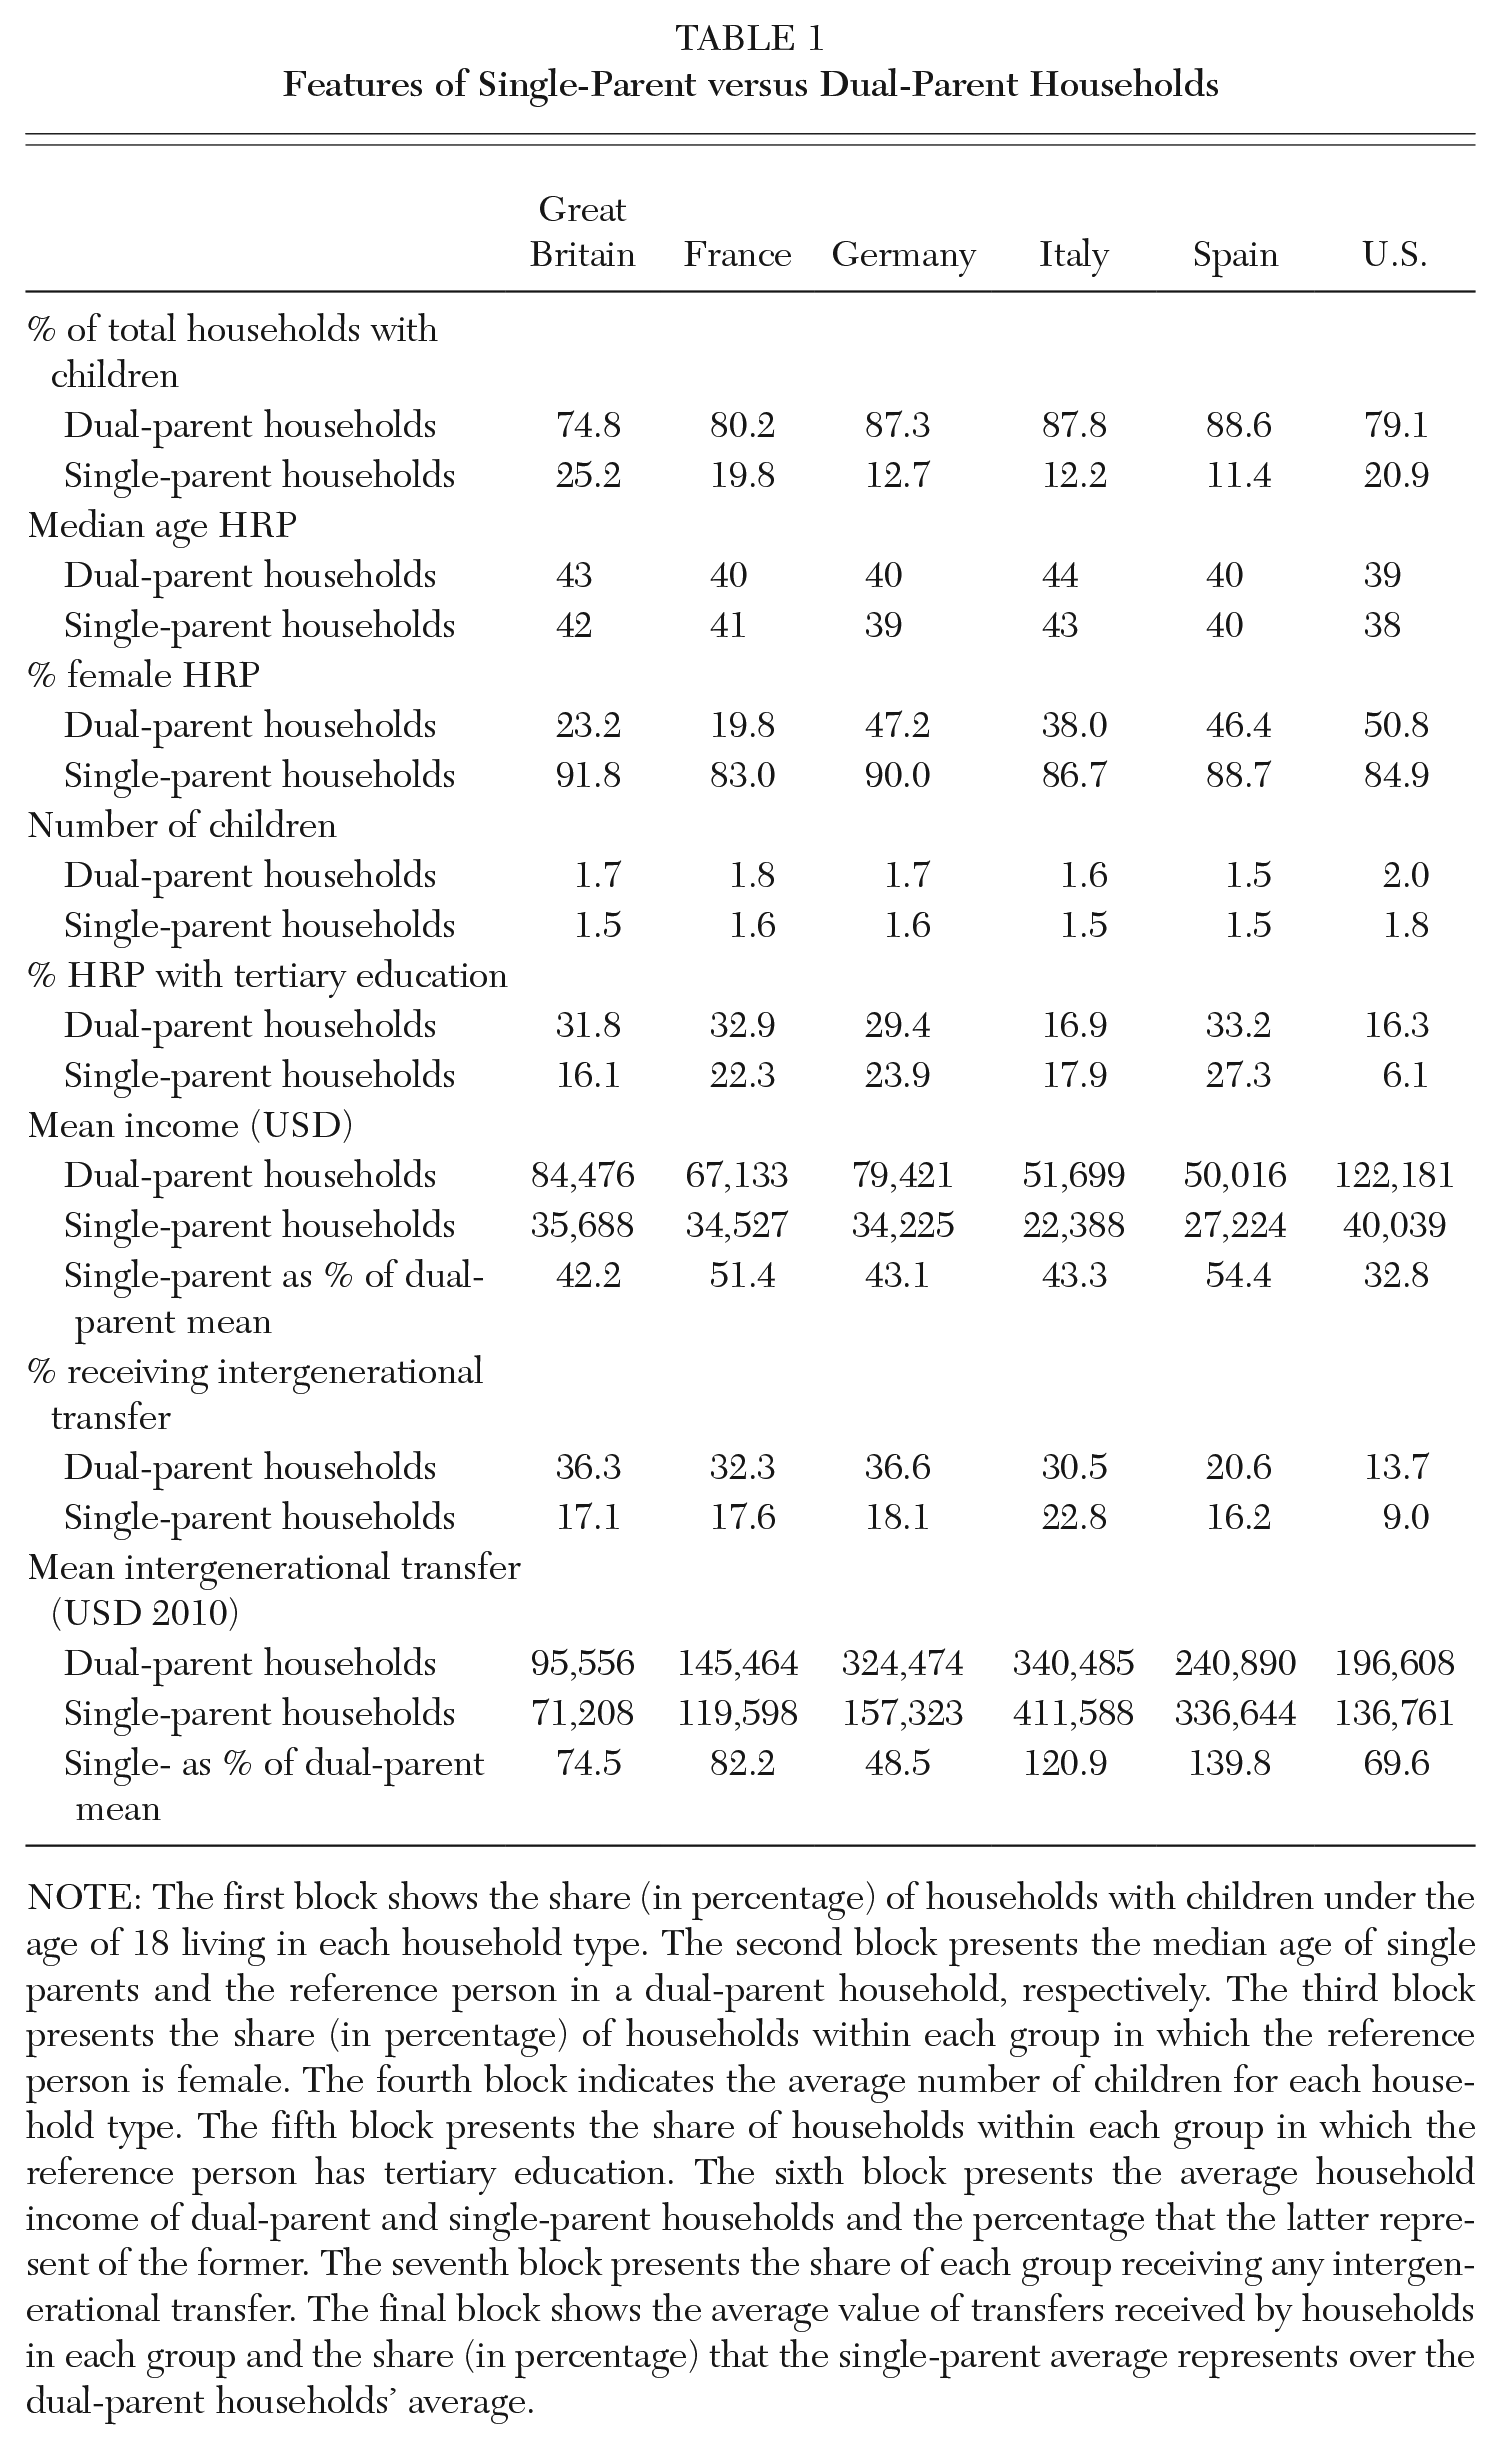
NOTE: The first block shows the share (in percentage) of households with children under the age of 18 living in each household type. The second block presents the median age of single parents and the reference person in a dual-parent household, respectively. The third block presents the share (in percentage) of households within each group in which the reference person is female. The fourth block indicates the average number of children for each household type. The fifth block presents the share of households within each group in which the reference person has tertiary education. The sixth block presents the average household income of dual-parent and single-parent households and the percentage that the latter represent of the former. The seventh block presents the share of each group receiving any intergenerational transfer. The final block shows the average value of transfers received by households in each group and the share (in percentage) that the single-parent average represents over the dual-parent households’ average.
Another difference between single-parent and dual-parent households with potential implications for their wealth levels relates to the receipt of wealth transfers from the previous generation. 3 Table 1 shows that single-parent households are less likely to have received any such transfers than dual-parent households in all the countries we are studying. This gap is quite narrow in the case of Germany and Italy, but much wider elsewhere. The percentage of households reporting receipt of such transfers is much lower in the United States than elsewhere; 4 only 9 percent of U.S. single-parent households compared with 14 percent of dual-parent ones do so. The mean transfer amount (aggregated across different receipts at varying dates reported by a household and averaged over recipient households only) was also generally lower for single-parent households, although that was not the case for Italy or Spain.
Focusing now on wealth and comparing the average wealth of single-parent and dual-parent households in Table 2, we see that single-parent households have much lower wealth on average in all countries. However, the gap between them and dual-parent households is much wider in some countries than others. In France, Italy, and Spain the single-parent mean is over half the dual-parent average; but in Great Britain that figure is 37 percent, in Germany 28 percent, and in the United States only 17 percent. Looking at median rather than mean levels, we see that the single-parent household at the midpoint of the wealth distribution has very little wealth except in Italy and Spain. Single-parent households are also more likely to report zero or negative wealth, particularly in Great Britain, Germany, and the United States. (Adjusting household wealth for household size by equivalization or focusing on wealth per adult narrows the single-parent wealth gap somewhat, but it remains substantial; see online Appendix 2, Table 1.)
The Wealth of Single-Parent versus Dual-Parent Households
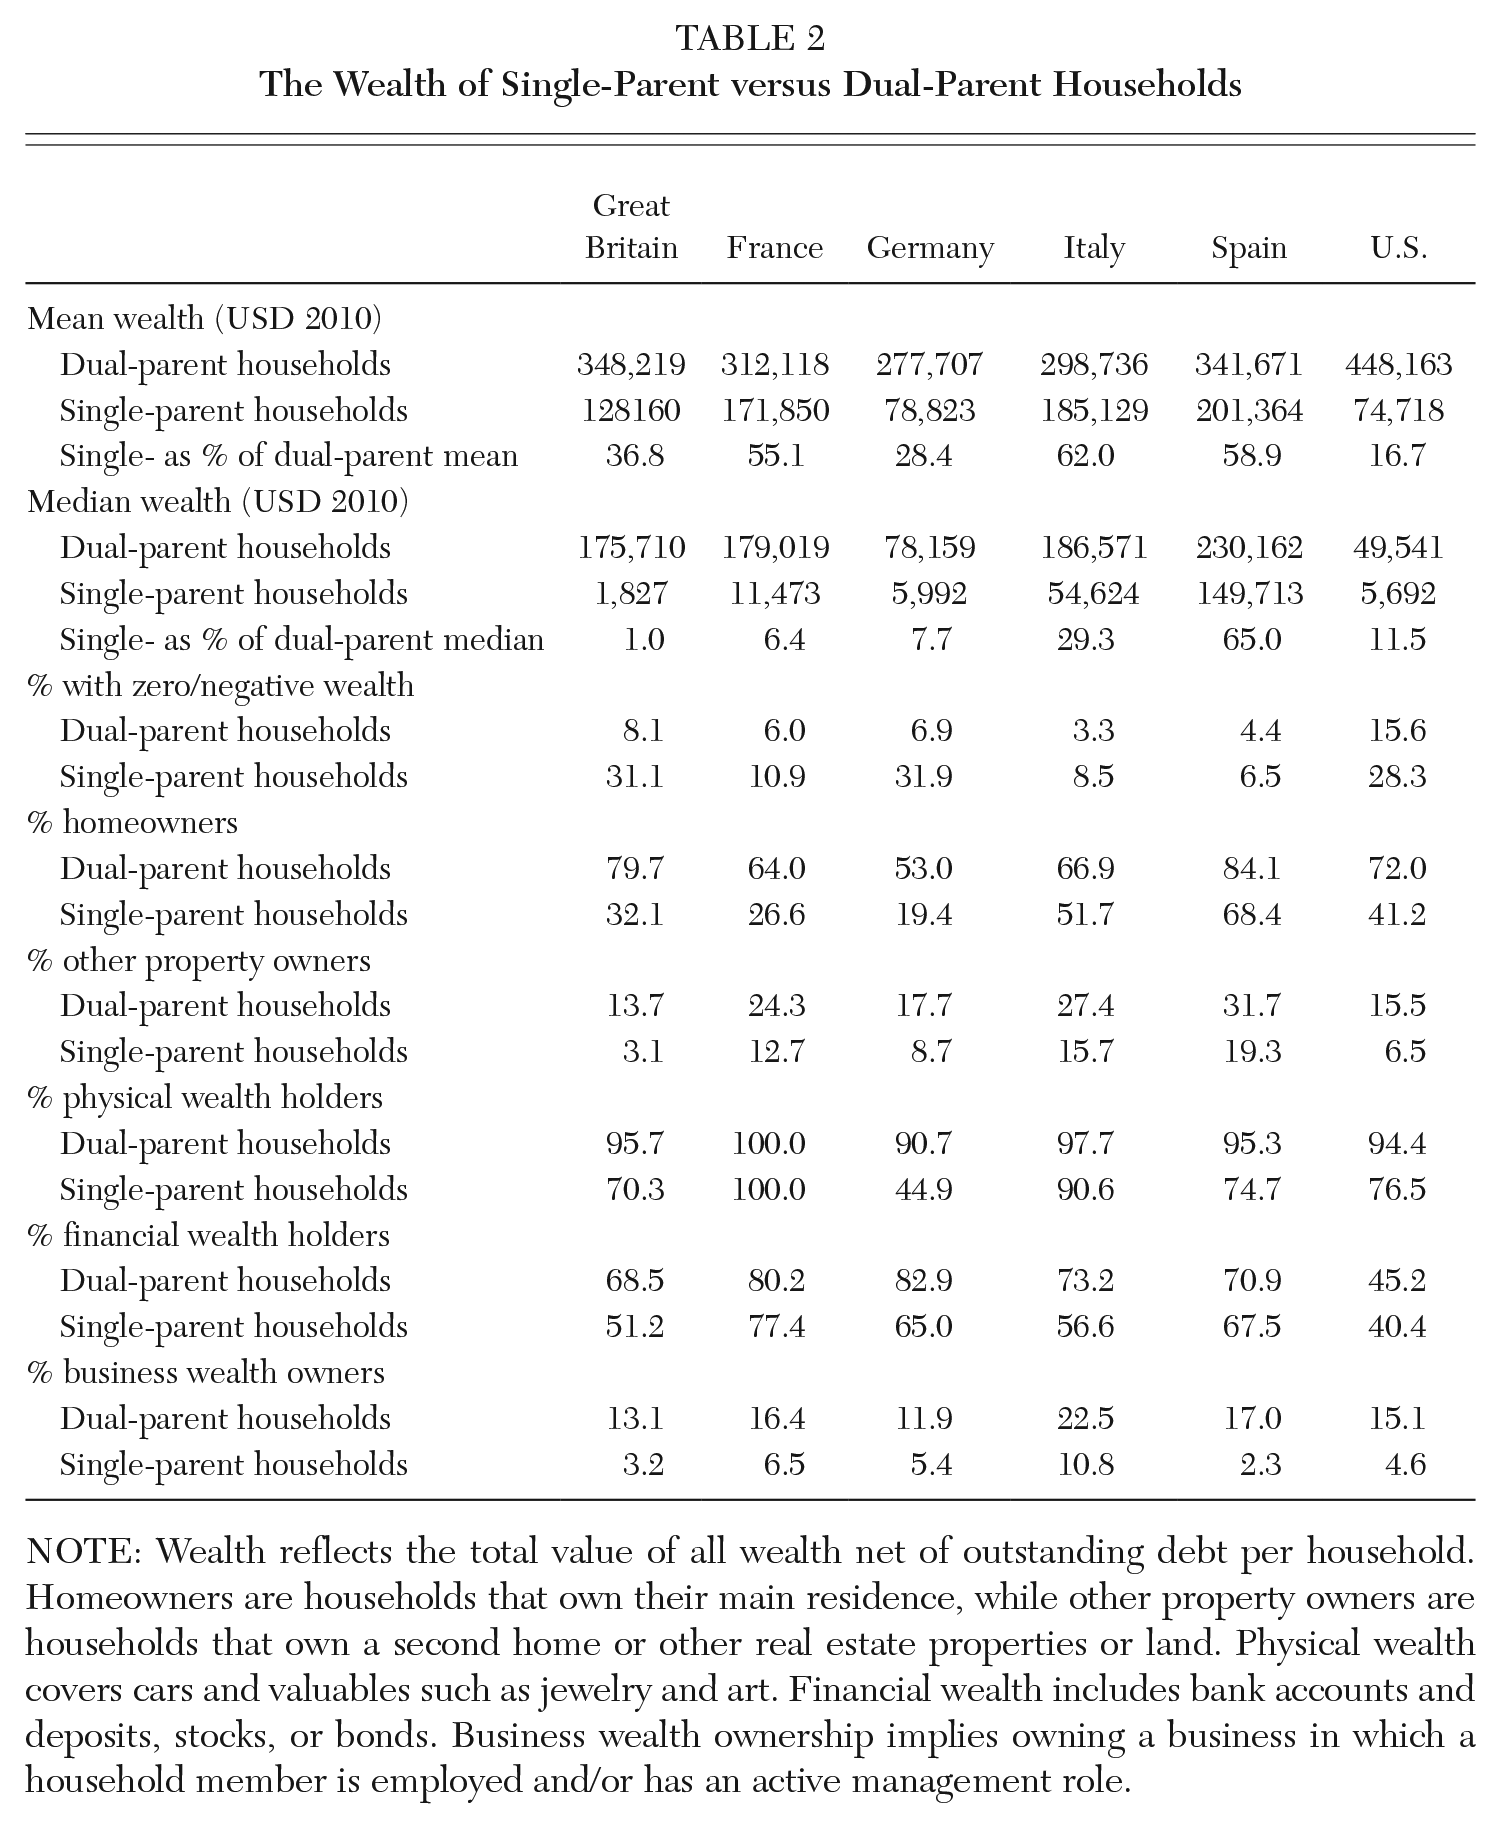
NOTE: Wealth reflects the total value of all wealth net of outstanding debt per household. Homeowners are households that own their main residence, while other property owners are households that own a second home or other real estate properties or land. Physical wealth covers cars and valuables such as jewelry and art. Financial wealth includes bank accounts and deposits, stocks, or bonds. Business wealth ownership implies owning a business in which a household member is employed and/or has an active management role.
When we look at homeownership, dual-parent households are quite likely to own the main residence in most countries, with around 70 percent of them doing so in France, Italy and the United States, reaching 80 percent in Great Britain and Spain; but with Germany having only slightly more than 50 percent. The gap between them and single-parent households is, however, really wide in many countries, with ownership rates for the latter around 30 percentage points lower in France, Germany, and the United States and 40 percentage points lower in Great Britain. Italy and, especially, Spain have the narrowest difference in ownership rates between dual-parent and single-parent households, with more than 50 percent of single-parent households in Italy and more than 70 percent in Spain owning their main residence. Italy and Spain also have the narrowest wealth gap, pointing to a strong connection between higher homeownership rates for single-parent households and a lower wealth gap, both on average and at the median of the distribution. Ownership of other properties besides the main residence is always more common among dual-parent households. A significant gap in the rates is also observed in physical wealth (except in France) and in financial wealth (except in Spain, France, and the United States). Finally, although business wealth is not common in the portfolio of households in general, it is far more common among dual-parent households in all countries.
To shed light on the nature and sources of the wealth disadvantage of single-parent households, we now probe the differences in household wealth between single- and dual-parent households by statistical analysis. We show, in Table 3, how much of the wealth disadvantage of single-parent households persists once we adjust for differences in a range of characteristics described in Table 1.
Single-Parent Wealth Penalty with and without Adjustment for HRP Age, Number of Children, HRP Education, Annual Income, Wealth Transfer Received, and Homeownership
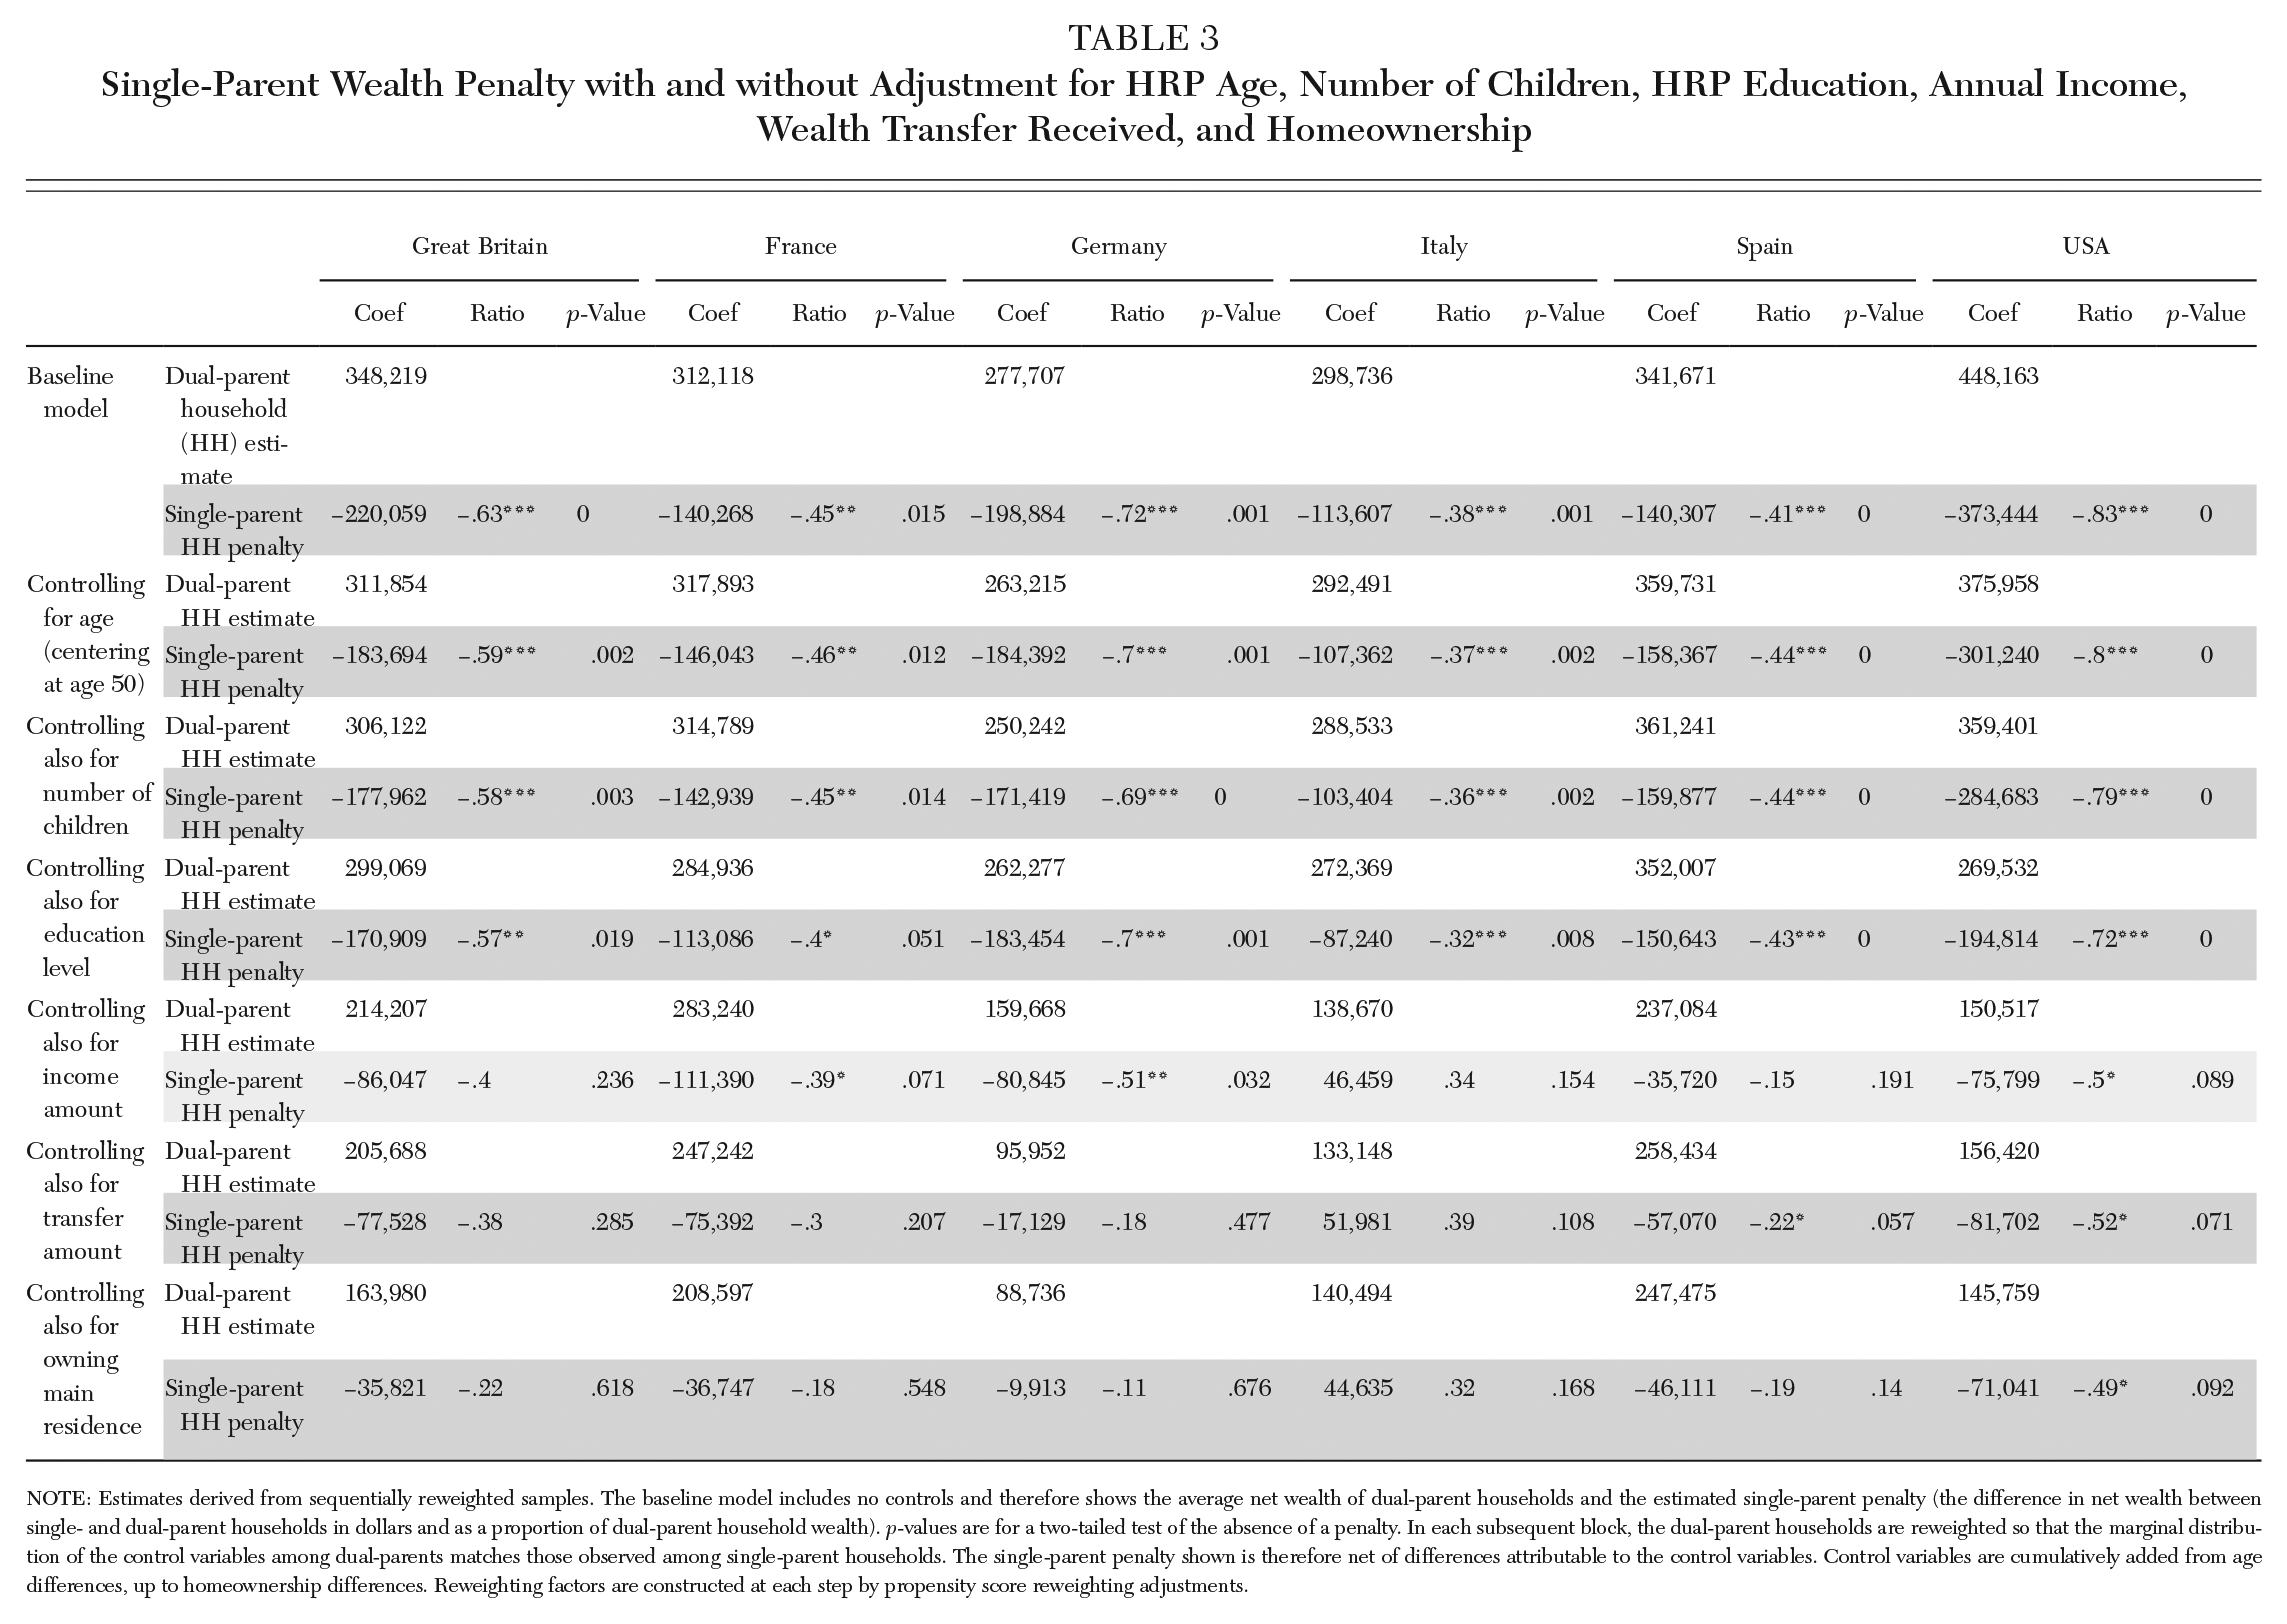
NOTE: Estimates derived from sequentially reweighted samples. The baseline model includes no controls and therefore shows the average net wealth of dual-parent households and the estimated single-parent penalty (the difference in net wealth between single- and dual-parent households in dollars and as a proportion of dual-parent household wealth). p-values are for a two-tailed test of the absence of a penalty. In each subsequent block, the dual-parent households are reweighted so that the marginal distribution of the control variables among dual-parents matches those observed among single-parent households. The single-parent penalty shown is therefore net of differences attributable to the control variables. Control variables are cumulatively added from age differences, up to homeownership differences. Reweighting factors are constructed at each step by propensity score reweighting adjustments.
To achieve this, we adopt a sequential reweighting approach. This consists in generating a set of weights for each household in the sample of dual-parent households such that, after reweighting, the sample of dual-parent households has the same characteristics X (that we want to “control for”) as the sample of single-parent households. 5 Accordingly, comparison of wealth across the groups after reweighting is net of differences in X between single- and dual-parent households. The rows of Table 3 show such estimates for alternative content of X. In the “baseline model” block, X is empty, and this therefore presents the “raw” differences in mean wealth between dual- and single-parent households, unadjusted for any differences in characteristics. Subsequent blocks sequentially add variables to X: age of the household head, number of children in the household, education level of the household head, total household income, wealth transfer received, and homeownership. The last row therefore shows estimates of the single-parenthood gap which are net of differences between single- and dual-parent households in these six variables considered. Estimates of net wealth for dual-parent households shown are constructed values that would be seen if dual-parent households had the same characteristics as single-parent households in those six dimensions. The key advantage of this reweighting approach over traditional regression analysis is that no parametric model needs to be imposed on the distribution of net wealth, an exercise that is notoriously difficult given the very skewed nature of the wealth distribution.
Table 3 shows estimates of differences in mean wealth between single- and (reweighted) dual-parent households (both in dollars and in relative terms). The baseline model shows that the single-parent wealth penalty is sizeable and statistically significant in all countries, being in absolute terms the largest in the United States and the smallest in Italy and Spain, as we saw in Table 2. In relative terms, single-parent households have an average wealth 83 percent lower than dual-parent households in the United States, 72 percent lower in Germany, 63 percent lower in Britain, 45 percent lower in France, 41 percent lower in Spain, and 38 percent lower in Italy. Adjusting for differences in age and then for the number of children does not change the broad picture, and the penalty is still sizeable and statistically significant. When further adjusted for differences in HRP education (in the form of dummy variables for secondary and tertiary educational attainment), the single-parent penalty is reduced in all countries but most substantially in the United States and Italy, reflecting the high correlation between lower wealth and low education for single-parent households in these two countries.
The adjustment for income differences has a major impact on the size of the single-parent penalty in all countries: it goes down from 72 to 50 percent in the United States and from 70 to 51 percent in Germany, while the point estimates of the penalty are no longer statistically different from zero in Britain, Spain, and Italy. These impacts reflect the large differences in household income between single- and dual-parent households and the implications that these have for wealth. Controlling for receipt of intergenerational wealth transfers also mostly produces a reduction in the single-parent penalty; this is sizeable in Germany but smaller in the other countries, and only in Spain does the penalty increase once we account for transfers. Introducing a control variable for main residence ownership substantially affects the magnitude of the (remaining) single-parent wealth disadvantage, which is greatly reduced in all countries and mostly becomes statistically nonsignificant. (Corresponding estimates investigating differences in median rather than mean wealth in online Appendix 2, Table 2 show some differences but a similar overall pattern as the various control variables are added.)
It is also informative to distinguish among the different forms in which wealth is held. Supplementary tables in online Appendix 2 examine separately the single-parent wealth penalty for owning one’s principal residence, having sizable non–main residence wealth, and holding business wealth. When one controls (in a logistic regression framework) for a range of relevant characteristics, the single-parent penalty for primary residence ownership remains significant in all countries, although it is more modest in Italy and Spain than elsewhere (online Appendix 2, Tables 3 and 6). This is also the case for the most part for other property and for business wealth (online Appendix 2, Tables 4 and 7/5 and 5/8, respectively).
Finally, in a majority of countries, the single-parent wealth deficit among lower-income households is much lower for the small minority who received sizeable intergenerational transfers (online Appendix 2, Table 9), highlighting the role such transfers can play in enabling home ownership even where income is relatively low.
Supporting Wealth Accumulation for Single-Parent Households
We have extended research on single-parent families by mapping their wealth in a comparative perspective to enhance understanding of the underlying forces at work. We have done so by analyzing microdata from household wealth surveys for six rich countries: Great Britain, France, Germany, Italy, Spain, and the United States. Single-parent households were found to be seriously disadvantaged on average in terms of wealth held, to an extent that varies across these countries.
Policy responses to the wealth deficit of single-parent households merit the most serious attention in a context where economic precarity, wealth inequality, and intergenerational immobility are giving rise to such concern. Such wealth deficits have major implications for the current living standards and future prospects of the children growing up in those households and require a strategic response covering a wide span of policy domains.
In the first instance, the presence of these wealth deficits reinforces the need for policy interventions aimed at supporting and boosting the incomes of single-parent households. These focus on the income support provided by social protection systems to single parents, which their enhanced material deprivation levels suggest are often seriously inadequate (see, for example, Cantillon et al. 2017; Bradshaw, Keung, and Chzhen 2019). The structural nature of the inadequate social floor for single parents must be fully taken on board and addressed, whereas piecemeal reforms or improvements will not suffice (as brought out effectively by Cantillon, Collado, and Van Mechelen 2019). At the same time, the thrust of policy must clearly also be to enhance the earnings capacity of single parents via improved education and training, accompanied by targeted measures to improve their chances of moving from nonemployment into secure work (Niewenhuis and Maldonado 2019). The centrality of adequate supports in terms of parental leave and childcare for the earnings trajectories of women with children has been widely recognized, and this is of course particularly the case for single parents.
A complementary policy response that could also form part of an overall strategy is a direct wealth “endowment” to individuals, on a universal or means-tested basis, to support accumulation of some baseline level of wealth. The fact that receipt of intergenerational transfers reduces the gap in homeownership rates between dual- and single-parent households (see online Appendix 2, Table 9) points at the impact that these endowments might have in sustaining single-parent households’ wealth accumulation. Atkinson (2015) for example proposes a universal inheritance payable on reaching adulthood, an idea with a long historical pedigree. Milanovic (2019) also sees universal capital transfers as key to “deconcentrating capital ownership,” while Piketty (2019) proposes a very substantial capital endowment of approximately 60 percent of average adult wealth at the age of 25. The case for a universal endowment that is received in early adulthood places particular emphasis on the importance of decisions made around that time and their long-term consequences for income and for wealth accumulation over the life course. The substantial security that such an endowment would represent and the financial resources it would make available could have deep behavioral effects, potentially serving to increase human capital and the return to it and thus wealth accumulation over time through a variety of channels. Despite growing interest, little empirical research has been done to understand how the wealth distribution might be affected by such a wealth endowment. Feiveson and Sabelhaus’s (2018) work is an important exception, looking at a static exercise distributing the total value of inheritances and gifts reported in the U.S. Survey of Consumer Finance as equal amounts across the population. They find that this could reduce the top 10 percent share of total wealth in the United States from 73 to 57 percent, or even to 40 percent, depending on how transfers are capitalized over time. Morelli et al. (2021) simulate a universal inheritance for young adults in Italy and the United States and show that the mechanical effect of this “inheritance for all” policy would be to sharply reduce the share with zero or negative wealth, especially in the United States. Given the wealth deficits faced by single-parent households, such broadly based policies to support wealth accumulation would be particularly helpful for them even if not targeted specifically towards them; efforts to provide larger endowments to particularly family types could well create behavioral disincentives that one would wish to avoid.
Considering such direct approaches to building some wealth for households should also serve to focus attention on the currently neglected topic of asset testing in social protection systems and how these discourage wealth accumulation. Among the many barriers to wealth accumulation facing single-parent households, these are perhaps the most directly amenable to policy action. The particular circumstances of single parents could serve as a spur to a broader reconsideration of the role that these asset-testing provisions do and should play in delivering social protection. Furthermore, with housing playing a central role in single-parent-household wealth, policies that make affordable housing more widely available in general, and ones designed to address the specific obstacles faced by single-parent households in trying to become homeowners, need to be part of the strategy.
Finally, an important priority for research to better inform policy is the further elucidation of the factors that give rise to the wealth deficits faced by many single-parent households. A particularly promising route will be to exploit longitudinal surveys that track the evolution of their income and wealth over time (building on, for example, Lersch et al. [2021] for Germany and Bernardi, Boertien, and Geven [2019] for the United States). Doing so in a comparative perspective will be particularly revealing about the role of differing national contexts, in particular the importance of differences in institutions and policies.
Supplemental Material
sj-docx-1-ann-10.1177_00027162221123448 – Supplemental material for The Wealth (Disadvantage) of Single-Parent Households
Supplemental material, sj-docx-1-ann-10.1177_00027162221123448 for The Wealth (Disadvantage) of Single-Parent Households by Janet C. Gornick, Laurie C. Maldonado, Amanda Sheely, Salvatore Morelli, Brian Nolan, Juan C. Palomino and Philippe Van Kerm in The ANNALS of the American Academy of Political and Social Science
Footnotes
Appendix 1: Data Employed
This article employs microdata from surveys of wealth and related topics for large representative samples of households from the SCF for the United States; from the Eurosystem HFCS for France, Germany, Italy, and Spain; and from the WAS for Great Britain. This appendix provides more details on these surveys and the key measures from them.
For the United States, the SFC has been carried out by the Federal Reserve every third year since 1983. The SCF is also generally a cross-section survey with a new sample each wave (although there have been occasional longitudinal elements). The SCF oversamples towards the top of the distribution to improve its capacity to capture high-wealth cases and measure top-wealth shares (see for example Bricker et al. 2016) and seems able to do so particularly effectively compared with other countries. It does so via a dual-frame sample design, whereby a nationally representative set of families selected from an address-based sampling frame is supplemented with an oversample of wealthy families drawn from a list provided by the Internal Revenue Service from individual income tax returns. The information on those returns on income from different types of assets is used to predict wealth and allows the survey to disproportionately select the relatively wealthy (see Bricker et al. 2017). The complex set of weights take this sampling design into account, inter alia, to produce a representative sample of the population as a whole.
The HFCS is carried out across member countries of the Eurozone by national central banks or statistical offices, coordinated by the European Central Bank in conjunction with the Household Finance and Consumption Network it established in 2006 to ensure the application of a common methodology, pool and quality control the country datasets, and disseminate the survey results and microdata. The fieldwork for the first wave was carried out in most countries in 2010 or 2010–2011 (2008–2009 in Spain, 2009–2010 in France, 2009 in Greece), with the second wave generally around 2014 and a third wave around 2017. Fifteen of the seventeen Eurozone countries took part in the first wave (see Eurosystem Household Finance and Consumption Network 2013). The HFCS is primarily a cross-sectional survey, with longitudinal elements in some countries. Nine of the fifteen countries participating in wave 1 had some oversampling of the wealthy, most often based on geographical location but in some cases employing information on wealth or income. The effective oversampling rates in the first wave of the survey can be seen to vary widely across countries, with France, Germany, and Spain having particularly high rates but Italy not oversampling. There are also differences in the sample selection and consequently in weighting procedures; and while a common Eurosystem blueprint questionnaire is the starting point, there are some differences across the national questionnaires for a variety of reasons.
The WAS is a longitudinal survey carried out by the Office for National Statistics specifically to capture household wealth and its evolution over time in Great Britain (that is England, Scotland, and Wales rather than the UK, which also includes Northern Ireland). The first wave of interviews was carried out from mid-2006 to mid-2008. In light of the substantial attrition seen in the first two waves, the third and subsequent waves included both “continuing” households and a new supplemented or “refreshed” sample. To increase the likelihood of including households towards the top of the wealth distribution, the WAS applies an oversampling strategy based on geographical areas. The longitudinal structure of WAS distinguishes it from the cross-sectional SCF and HFCS.
The HFCS, SCF, and WAS each seek in-depth information from responding households about their assets and debts, which is central to their purpose. This covers real assets such as the main residence; other real estate property; vehicles; valuables such as jewelry, antiques, or art; business wealth; as well as financial assets such as bank and other deposits, stocks and shares, and voluntary private pension assets. Net wealth comprises the aggregate value of all these assets held minus debt outstanding in the form of mortgages, overdrafts, credit card debt, car loans, consumer loans, instalment and other loans, and student loans. 6 The wealth concept employed in this article does not include the value of private occupational pensions or of entitlements to public pensions, as these are very difficult to assess in a robust and comparable way across countries.
Information on the transfers of wealth received from other households in the form of inheritances and gifts is also sought in all these surveys. Both the SCF and HFCS seek details on inheritances and gifts received by household members at any point over their lifetime, including when it was received, how much was it worth at the time, and from whom it was received. The WAS only sought information about lifetime inheritances in the first wave, with each subsequent wave asking only about transfers received in the two years since the previous wave. A substantial number of missing values for inheritance amounts in that waves had to be imputed (for details, see Nolan et al. 2020).
The income variable available in these wealth surveys is total gross household income rather than disposable income (after deducting taxes and employee social insurance contributions).
Notes
Supplemental Material
Supplemental material for this article is available online.
Salvatore Morelli is an Assistant Professor in public economics at the Law Department at the University of Roma Tre (Rome), a senior scholar and director of the GC Wealth Project at the Stone Center on Socio-Economic Inequality at the Graduate Center of the City University of New York, and a research associate at the Centre for Studies of Economics and Finance at the University of Naples, Federico II.
Brian Nolan is a Professor of social policy and director of the Employment, Equity, and Growth Programme at the Department of Social Policy and Intervention and the Institute for New Economic Thinking and Senior Research Fellow at Nuffield College, University of Oxford.
Juan C. Palomino is a postdoctoral research officer at the Department of Social Policy and Intervention and the Institute for New Economic Thinking (INET) at the University of Oxford, and Research Scholar in the Department of Economics at the Complutense University Madrid.
Philippe Van Kerm is a Professor of social inequality and social policy at the University of Luxembourg on a joint appointment with the Luxembourg Institute of Socio-Economic Research (LISER), and is a fellow at the Institute for Social and Economic Research (University of Essex), the Institute for New Economic Thinking (University of Oxford), the Stone Center on Socio-Economic Inequality (City University of New York), and ZEW Mannheim.
References
Supplementary Material
Please find the following supplemental material available below.
For Open Access articles published under a Creative Commons License, all supplemental material carries the same license as the article it is associated with.
For non-Open Access articles published, all supplemental material carries a non-exclusive license, and permission requests for re-use of supplemental material or any part of supplemental material shall be sent directly to the copyright owner as specified in the copyright notice associated with the article.