
Abstract
How do organizations reconcile the cross-pressures of conformity and differentiation? Existing research predominantly conceptualizes identity as something an organization has by virtue of the products or services it offers. Drawing on constructivist theories, we argue that organizational members’ interactions with external audiences also dynamically produce identity. We call the extent to which such interactions diverge from audience expectations performative atypicality. Applying a novel deep-learning method to conversational text in over 90,000 earnings calls, we find that performative atypicality leads to an evaluation premium by securities analysts, paradoxically resulting in a negative earnings surprise. Moreover, performances that correspond to those of celebrated innovators are received with higher enthusiasm. Our findings suggest that firms that conform to categorical expectations while being performatively atypical can navigate the conflicting demands of similarity and uniqueness, especially if they hew to popular notions of being different.
Target and Trader Joe’s are among the most successful retailers in the U.S. Established in 1962, Target is a big-box department store chain that sells a wide array of products, ranging from clothes to electronics. Defying the conventional distinction between department and grocery stores, Target began selling fresh produce in 2009, aggressively competing with traditional supermarkets. 1 Trader Joe’s, in contrast, focuses almost exclusively on selling groceries. Known for its groovy surfer-inspired store decor, it is also famous for having a cult-like following. Challenging industry norms, moreover, Trader Joe’s staff wear Hawaiian shirts and are encouraged to engage in playful conversation with customers.
Existing organizational theory would consider both Target and Trader Joe’s to be somewhat atypical organizations. Different theoretical perspectives would make different predictions about whether this atypicality would appeal to these organizations’ intended audiences. Whereas research on the role of categories in markets would likely emphasize the penalties associated with these retailers’ categorical noncompliance, optimal distinctiveness theory might predict that these firms’ moderate levels of atypicality would result in successful differentiation (Zuckerman, 2016; Zhao et al., 2017; Haans, 2019).
But Target and Trader Joe’s are atypical in different ways. Target, especially when it first launched its strategy, differed from its competitors in the kinds of products it offers. Selling merchandise that one would find either in a typical department store or supermarket, it provides an unconventional mix of offerings. We refer to this form of noncompliance as categorical atypicality. Trader Joe’s, in contrast, differs from its competitors not in what it sells but in how it interacts with outside stakeholders. We call this type of divergence from expectations performative atypicality.
The analytical distinction between categorical and performative atypicality is consequential if outside observers react to them differently. To investigate this possibility, we examine securities analysts’ reactions to executives’ performative atypicality in quarterly earnings calls. Using word-embedding models (Mikolov et al., 2013), we develop a method for measuring performative atypicality in these calls’ transcripts. We find that performative atypicality breeds disagreement, which is consistent with prior research. Yet, in contrast to the predictions of existing theories, we find that performatively atypical organizations receive a valuation boost from differentiation: analysts overestimate these firms’ future earnings. We refer to this advantage as the performative atypicality premium. Ironically, this premium leads to an adverse outcome: a negative earnings surprise.
Drawing on abductive reasoning (Brandt and Timmermans, 2021), we exploit the possibilities afforded by automated textual analysis to investigate this apparently surprising finding. Taking a forensic computational approach (Goldberg, 2015; McFarland, Lewis, and Goldberg, 2016), we find that not all forms of performative atypicality generate equal levels of optimism. Rather, firms whose atypicality emulates perceived innovators’ performances are evaluated more positively than those that are idiosyncratically atypical. Difference, in other words, is especially rewarded when it conforms to popular expectations about what constitutes novelty.
In this article, we provide a theoretical motivation for the distinction between categorical and performative atypicality. We then demonstrate that performative atypicality is analytically distinct from categorical atypicality and show that, all other things being equal, analysts are overly optimistic about the future earnings of performatively atypical firms. This effect holds whether we use between- or within-firm models. Taking inspiration from Nelson’s (2020) computational grounded theory approach, we then inductively chart the semantic dimensions that structure atypical performances.
Our results imply a bilateral process whereby the categorical and performative aspects of an organization’s identity catalyze different processes of audience valuation. While audiences penalize categorically atypical organizations, they interpret performative atypicality as a source of competitive advantage. This finding, we contend, relates to two primary dimensions along which an organization is evaluated: how unusual it is in what it produces and in how it produces those items. We discuss the scope conditions of this model and its implications for our understanding of the conditions under which being different is penalized or rewarded in markets.
Theory
Unidimensional Conceptions of Atypicality
How can firms balance the pressures of conformity and differentiation? Existing research provides two dominant explanations. The first, drawing on Brewer’s (1991) optimal distinctiveness imagery, argues that organizations gain positive attention when they are moderately different from their competitors. To gain legitimacy, organizations need to conform to fundamental audience expectations. Those that manage to do so while remaining distinct from their competitors are judged favorably by outside audiences (Navis and Glynn, 2011). Research relying on the optimal distinctiveness framework normally assumes that external evaluators’ judgments about legitimacy and distinctiveness occur simultaneously. It therefore predicts an inverted U-shaped relationship between atypicality and success such that organizations poised between full conformity and radical deviance gain positive evaluations from outside audiences (Uzzi et al., 2013; Askin and Mauskapf, 2017).
A second approach, focusing on categories in structuring market activity, highlights the disciplining roles of categorical expectations. This work commonly assumes a sequential two-stage process of valuation (Zuckerman, 2016). In the first stage, audience members associate an organization with a recognized category. This association determines which criteria audiences will use to evaluate the organization and, importantly, which reference group they will compare it to. Only in the second stage, once an organization’s categorical identity has been established, do audience members evaluate the extent to which it is distinct from its competitors.
Scholars have used this two-stage process to explain why categorically atypical organizations, especially those that straddle multiple categories, suffer negative consequences. While audiences generally seek and favor distinct organizations, they evaluate such distinction positively only if they can make sense of these organizations. When external evaluators are confused about an organization’s categorical identity, they find it difficult to interpret its performance and to compare it to others. Consequently, categorically atypical organizations, despite their potential appeal, are systematically penalized (Zuckerman, 2017). Although the two-stage model explains how an organization can—in theory—be simultaneously compliant and differentiated, it gives theoretical precedence to categorical conformity in the first stage.
Whereas optimal distinctiveness theory assumes simultaneous evaluation, the two-stage model assumes that evaluators first determine an organization’s categorical identity. Consequently, these two theories make different predictions. While optimal distinctiveness predicts a curvilinear relationship between atypicality and audience appeal, the two-stage model predicts that this relationship monotonically decreases.
Empirical investigations offer a frustratingly diverse set of mixed and often contradictory results. Consistent with the two-stage model’s linear prediction, a large body of work demonstrates that products and organizations that do not adhere to typical categorical expectations have, on average, lower appeal and exhibit weaker performance across various contexts (Zuckerman, 1999; Leung and Sharkey, 2013). Other studies find support for the optimal distinctiveness model’s prediction, demonstrating that products (e.g., Askin and Mauskapf, 2017; Zhao et al., 2017) and organizations (e.g., Deephouse, 1999) that are moderately differentiated are rewarded for their optimal distinctiveness. Neither theory can explain why, as various studies have shown, atypicality is often rewarded (e.g., Taeuscher, Bouncken, and Pesch, 2021).
In attempting to address this gap, scholars have proposed several mechanisms explaining when identity expectations are stringently enforced and when they are relaxed. The first argues that different audiences have varying levels of tolerance for atypicality because they subscribe to different theories of value (Cattani, Ferriani, and Allison, 2014; Paolella and Durand, 2015). Venture capital firms, for example, see greater value in atypicality than institutional investors do (Pontikes, 2012). Second, expectations of typicality vary by market and domain (Carnabuci, Operti, and Kovács, 2015; Keuschnigg and Wimmer, 2017; Zhao et al., 2018; Chatterji, Luo, and Seamans, 2021). The penalties for atypicality are especially muted in emergent (Ruef and Patterson, 2009) and homogeneous markets (Haans, 2019) or for early-stage firms (Taeuscher, Bouncken, and Pesch, 2021). Finally, different firms operating within the same market and being evaluated by the same audience might still be rewarded differently for atypicality, depending on their reputation and status. High-status firms enjoy greater latitude to defy categorical conventions (Rao, Monin, and Durand, 2005; Smith, 2011; Sgourev and Althuizen, 2014; Durand and Kremp, 2015).
These mechanisms delineate how atypicality is rewarded in some contexts and penalized in others. But they do not explain why some organizations are more successful than their competitors in managing the conflicting demands of similarity and differentiation when they operate in the same market, cater to the same audience, and have access to similar reputational resources. This limitation, we contend, relates to the unidimensional way in which scholars, regardless of theoretical orientation, have tended to conceptualize organizational atypicality.
A unidimensional conceptualization of atypicality effectively assumes that audiences perceive organizations by using a singular taxonomical system. This assumption necessarily implies that at any given moment in time, an organization occupies a fixed location on the atypicality continuum. This means that organizations cannot simultaneously enjoy the benefits of intelligibility that come with typicality and the benefits of differentiation that come with atypicality. Optimal distinctiveness and the two-stage model reach different conclusions about how this tension is resolved.
But human cognition is messier and more complex than what this assumption implies. People do not perceive objects through unitary taxonomical lenses. Rather, they cognitively represent the world along a multitude of intersecting semantic dimensions (Murphy, 2004; Hannan et al., 2019). Animals, for example, are not understood only as belonging to different species. As Grand et al. (2022) showed, people also conceptually sort them along other dimensions such as size, wetness, or how dangerous they are.
Organizations are also interpreted along multiple semantic dimensions. Indeed, researchers studying atypicality in markets often concede that successful organizations differentiate themselves along only a small subset of dimensions (Zuckerman, 2016; Zhao et al., 2017). Nevertheless, such accounts seldom specify what makes some dimensions more conducive than others to differentiation. In practice, moreover, empirical investigations operationalize atypicality almost exclusively as a unidimensional construct. These studies often define atypicality as the overall difference between a firm’s product or service features, relative to those of its competitors (e.g., Askin and Mauskapf, 2017), or the extent to which audiences classify it as spanning multiple categories (e.g., Carnabuci, Operti, and Kovács, 2015; Goldberg, Hannan, and Kovács, 2016). When these studies distinguish favorable and unfavorable dimensions of differentiation, such distinctions are mostly non-generalizable beyond the specific context being studied (e.g., Phillips, Turco, and Zuckerman, 2013; Wry, Lounsbury, and Jennings, 2014). These studies therefore fall short of proposing general principles that delineate which organizational features are important for conformity and which are amenable to differentiation.
Categorical and Performative Atypicality
We argue, in contrast, that audiences determine an organization’s identity, and concomitantly infer its atypicality, in two different ways. 2 These relate to two different and mostly tangential sociological approaches to the study of atypicality and its consequences. The first, which has been widely influential in research on organizations, conceptualizes organizational identity through a categorical lens (Zuckerman, 1999; Hannan et al., 2019). This approach understands sensemaking as a classification process wherein external observers, drawing on a shared set of taxonomical criteria, divide organizations into distinct groups of similar entities. Prototypical membership in these groups is mutually exclusive: a typical restaurant, for example, is distinctively different from a typical hospital. Organizations exhibiting feature combinations that crosscut categorical boundaries are difficult to classify. We refer to this kind of multi-category membership as categorical atypicality.
A categorical approach to atypicality has two implications. First, it orients researchers toward an organization’s primary attributes, most commonly those relating to the products it makes or the services it provides. A restaurant, for example, is defined first and foremost by the fact that it serves food, whereas a hospital’s definition is rooted in the services it provides to people in need of medical treatment. Second, because this approach anchors on these primary attributes, it tends to see organizational identity as static. Although firms can change their products and business scope, this evolution is mostly incremental and slow. Categorical identity is consequently stable or changes slowly throughout an organization’s lifetime.
An alternative approach hails from constructivist social identity theories (Berger and Luckmann, 1967), specifically those that emphasize the performative nature of social interaction. Originally applied to gender (West and Zimmerman, 1987) and later extended to social identity more broadly (West and Fenstermaker, 1995), this approach maintains that identity is not a fixed designation but, rather, an attribution that is established repeatedly through interaction. Unlike the categorical approach, which focuses on fixed attributes, this perspective emphasizes the dynamic and emergent aspects of identity. To be understood by others as having a specific identity—for example, a woman, an economist, or an evangelical—one’s interactional performances need to conform to audiences’ expectations about how such an identity is behaviorally enacted. An identity, in other words, is not something one innately has but something one continuously does. Performances that diverge from expectations, such as a woman exhibiting stereotypically masculine behaviors or an economist behaving like a sociologist, are identity-inconsistent. We refer to this type of incongruence as performative atypicality.
We argue that like individual actors, organizations are subject to evaluations of performative atypicality. Indeed, research on organizational identity often analogizes it to how persons construct their self-identity, wherein members of the organization formulate an answer to the question “who are we?” (Albert and Whetten, 1985; Whetten, 2006). Early research in this vein emphasized the enduring aspects of organizational identity. A more recent stream has questioned the assumption of stability, examining instead how organizational identities shift and evolve over time. This work builds on the premise, grounded in symbolic interactionism (Mead, 1934; Goffman, 1959), that individual identity is constructed through interpersonal interaction (e.g., Ibarra and Barbulescu, 2010), and scholars have extended this idea to organizational identity formation (Schultz and Hernes, 2012; Gioia et al., 2013).
We shift focus from organizational members’ perceptions to those of outsiders, contending that a similar dynamism extends to how external evaluators form impressions of an organization. Such impressions result not only from the attributes of the products or services these organizations offer. Rather, external evaluations also arise through routine interactions between external audiences and organizational members. 3 Whether introducing a new product at a trade show, responding to questions from customers, or participating in a quarterly earnings call with financial analysts, organizational members are engaged in a meaning-laden social performance with external audiences.
Such performances mostly communicate literal information about current or anticipated future performance such as sales forecasts, new products in development, leadership transitions, and impending mergers or divestitures. Performers’ subtle and often unconscious word or behavioral choices also convey a wide range of connotative meanings that are not explicitly communicated. These connotative meanings shape audiences’ high-level interpretations of speakers’ discursive performances. Through this process, implicit and culturally shared schemas are invoked (Zilber, 2006).
For example, when Tesla’s iconoclastic CEO Elon Musk repudiated “moats” in a controversial earnings call in May 2018, audiences interpreted his comments as a rejection of a strategy focused on sustaining competitive advantage. Musk was communicating to investors that his company is, instead, pursuing a strategy of dynamic innovation. 4 Recent research has demonstrated that connotative meanings communicated in language implicitly affect audiences’ evaluations. The use of generic language in academic abstracts, for example, increases readers’ perceptions of the research’s importance, when its substantive content is held constant (DeJesus et al., 2019). Similarly, reaffirmations of monetary assumptions in the Federal Reserve Chair’s speeches counterintuitively lead investors to question these assumptions, resulting in increased market uncertainty (Harmon, 2019).
Although in this article we empirically focus on quarterly earnings calls, note that an organization’s performative atypicality is communicated not only by its top executives. It also manifests in a variety of media, such as everyday interactions between employees and outside stakeholders and the organization’s aesthetic and architectural choices (Wasserman and Frenkel, 2011). The personal and unscripted conversations that call center representatives at Zappos are trained to conduct with customers, for example, are a far cry from the structured and formal experiences characteristic of conventional customer service exchanges. These unscripted exchanges connote the online shoe retailer’s nontraditional, customer-focused approach to retail.
The “What” and “How” of Organizational Identity
Categorical and performative atypicality, we contend, correspond to different aspects of sensemaking. The former relates predominantly to inferences that outside observers make about what kind of an organization a firm is and, consequently, who its competitors are. Categorical atypicality, in other words, relates to the constitutive elements of a firm’s identity. Performative atypicality, in contrast, relates to inferences about how an organization goes about doing what it does. These inferences might concern fundamental elements of how it operates but not what it is in essence. Tesla, for example, would still be seen as an electric vehicle company even if its CEO were to step down and more-conventional behaviors replaced his performatively atypical antics. But if the company were to shift from manufacturing cars to manufacturing office furniture, its categorical identity would shift irrespective of these antics.
Similarly, organizations can be performatively atypical if they interact with stakeholders in ways inconsistent with how their competitors interact with stakeholders, even if the organizations are categorically typical, that is, their products are similar to those of their competitors. The British airline Virgin Atlantic, for example, founded in 1984, competes in a clearly defined market with relatively limited heterogeneity. There is no confusion about the type of services the airline provides or who its competitors are. Nevertheless, Virgin Atlantic’s interactions with outside audiences, especially in its early years, have been quite atypical. This atypicality is personified in the public performance of its CEO, Richard Branson, whose adventurous personality stands in stark contrast to the formality of traditional airlines. This informality manifests prominently in Virgin Atlantic’s casual customer service philosophy and playful aircraft design, connoting the airline’s unique strategic position (Navis and Glynn, 2011).
Of course, the distinction between the “what” and “how” of organizational identity is much crisper as an analytical abstraction than how it is experienced in people’s messy cognition. 5 What sets these two inferential processes apart are the different mediums on which they depend. An organization’s categorical identity is directly inferred from the products and services it offers. Its performative atypicality, in turn, is evaluated on the basis of its communicative interactions with outside stakeholders. These stakeholders do not directly observe how the organization operates; rather, they infer the “how” from the meanings connoted performatively.
The distinct ways by which categorical and performative atypicality arise lead to two important differences between them. First, whereas the “what” is directly gleaned from the organization’s products and services, the “how” is indirectly inferred from interactional performances. An organization’s performative atypicality therefore corresponds to its perceived but not necessarily objective operational uniqueness. Second, unlike categorical atypicality, performative atypicality is dynamically produced and is therefore more likely to fluctuate over an organization’s lifespan. This does not mean that an organization’s performative atypicality is necessarily unstable. Nevertheless, this dynamism suggests that an organization’s performative atypicality can change significantly and dramatically over time.
Responses to Performative Atypicality
When evaluating an organization, outside audiences are concerned with its quality. Customers seek to ascertain the quality of its products or services, whereas investors aspire to evaluate its potential financial performance. Ultimately, quality judgments depend on an organization’s value proposition. Outside stakeholders draw on the various pieces of information available to them in making inferences about that value proposition. How does performative atypicality factor into this process?
A straightforward application of constructivist identity theory to organizational identity would predict that external audiences significantly devalue performatively atypical organizations. Indeed, people normally strongly frown upon individual atypical performances, such as gender noncompliant behaviors. There are, of course, fundamental differences between how people understand gender and how they interpret organizational identity. Nevertheless, two assumptions motivating the “doing identity” framework appear to largely apply to an organizational context.
First, as West and Zimmerman (1987) argued, because identity is fluid, it needs to be continuously displayed. Identity-incongruent performances therefore undermine the audience’s perception of an actor’s claimed identity. When the actor is an organization, this can lead to skepticism about its ability to perform economically. An eccentric airline like Virgin Atlantic, for example, whose executives at times speak as if they are running an entertainment company, might be perceived as lacking the capabilities necessary for managing a complex aviation fleet (Hsu, 2006; Hsu, Hannan, and Koçak, 2009). Second, performances that defy behavioral expectations also undercut perceived boundaries between different types of organizations and the markets they operate in. These boundaries are essential cognitive tools that people use to impose order on an otherwise unstructured terrain of producers. Audiences will therefore react with dismay when atypical performances appear to erode these categorical distinctions (Hollander, 2013).
There are, however, reasons to doubt these negative expectations. Investors, like the ones we investigate below, are primarily motivated by value maximization. They often perceive uniqueness and nonconformity as indications of such value (Durand and Calori, 2006; Haans, 2019). Being different is a source of advantage in markets because it makes an organization distinct in the eyes of audiences (Barney, 1991; Deephouse, 1999). Investors should reward performatively atypical organizations to the extent that they perceive this atypicality as indicating unique and difficult-to-imitate capabilities.
Consider Trader Joe’s again. In a rare public comment, the supermarket chain’s CEO reacted to a podcast titled “Should America Be Run by Trader Joe’s?” by saying, “We are pretty sure such work would likely require a coat and tie. We like Hawaiian shirts . . . so we will pass.” 6 The company’s unusual style—from store decor to executives’ public performances—symbolizes its unorthodox customer-focused strategy, which refrains from discounts, advertising, or data-driven targeting. Its leadership’s willingness to challenge industry conventions appears to signal this unique strategy. If outside observers indeed interpret the CEO’s unconventional behavior as indicating such a strategy, it should lead them to evaluate Trader Joe’s favorably.
Performative Atypicality and Analyst Predictions
To evaluate whether audiences interpret performative atypicality as a signal of organizational incompetence or of its unparalleled capabilities, we focus on securities analysts. As demonstrated by a range of scholars (Zuckerman, 1999, 2000; Smith, 2011; Bowers, 2014), investors and analysts strongly rely on categorical distinctions when evaluating firms. They are therefore highly sensitized to instances of atypicality. Investigating analysts’ reactions has two advantages for our purposes.
First, financial analysts occupy a cross-pressured position in financial markets: they are simultaneously motivated to enforce normative behaviors and to reward nonconformity. Analysts rely on established industry categories to cluster firms and thus are often presented as enforcers of the market order (Zuckerman, 1999, 2004). Yet, they gain recognition and status based on their ability to introduce novelty in their reports and, in particular, new or emerging categories (Giorgi and Weber, 2015; Pontikes and Kim, 2017). Analysts can therefore benefit from adopting behaviors akin to that of “market makers” (Pontikes, 2012: 85) as they risk losing ground to their peers if they fail to identify the next big thing. Navigating these contradictory pressures, analysts’ predictions provide fertile ground for exploring the implications of performative atypicality.
Second, analysts cover a broad diversity of industries and market contexts, effectively analyzing the full range of activity in the U.S. for-profit economy. Their estimates are not limited to specific market contexts. In our analyses below, we account for this variation. This enables us to evaluate the relationship between performative atypicality and audience reactions while holding constant market dynamics and the audience’s theory of value. Moreover, we can hold constant resources (such as reputation) that are uniquely available to a given firm by observing them over time. Firms can perform their identities in various forms and media, ranging from formal documents submitted to regulatory agencies to stylistic signals made through subtle office design choices. To derive performative atypicality, we focus on quarterly earnings calls: periodic calls that the management teams of most publicly traded firms in the U.S. hold with the financial analysts who cover their stocks. During these calls, managers discuss their recent financial performance as well as their strategy and prospects for the future. Calls typically unfold in two stages: managers first read prepared statements and then engage in a more informal question and answer session. By all accounts, quarterly earnings calls are highly scripted, tightly controlled, and ritualized (Lee, 2016). Yet, managers often reveal new or unexpected information, either deliberately or inadvertently, as they interact with each other and with analysts. Overall, speakers convey both conscious and unself-conscious meanings about the organization.
We evaluate analysts’ reactions in two different ways. First, if atypicality affects audiences’ perceptions, it should beget uncertainty and ambiguity. Unlike categorical ambiguity, however, performative ambiguity arises not because audiences cannot identify what kind of organization the one under consideration is or who its competitors are. Rather, ambiguity emerges precisely because the organization communicates meanings inconsistent with those typically communicated by similar organizations. These unusual meanings make it more likely that different analysts will reach different conclusions about the firm’s future performance. Insofar as analysts pay attention not only to tangible data and facts but also to the subtleties of word choice, performative atypicality should result in greater disagreement in analysts’ earnings forecasts.
Second, we focus on earnings surprises, the extent to which a firm’s reported quarterly profits diverge from median analyst expectations. As research in accounting and finance has demonstrated, deviations from analyst forecasts affect future valuations and are commonly interpreted as reflecting information-flow inefficiency in the market (e.g., Kasznik and McNichols, 2002). When making their predictions, analysts presumably take into account the variety of information available about a firm, especially hard data relating to performance. An earnings surprise corresponds to a bias in analysts’ estimations above and beyond this information. A positive (negative) earnings surprise occurs when analysts, on average, underestimate (overestimate) a firm’s future performance. Systematic prediction error driven by performative atypicality, we argue, indicates that analysts rely on this atypicality to make inferences about a firm’s underlying quality.
Previous research on atypicality and firm valuation has tended to focus on investment flows (e.g., Smith, 2011). Because these studies seek to estimate the categorical atypicality discount above and beyond firm fundamentals, they typically employ complex methods of taking these fundamentals into account (e.g., excess value calculations in Zuckerman, 1999). Earnings surprises obviate this need. Analyst performance predictions presumably take into account these analysts’ perceptions of how firm fundamentals should affect future performance. The earnings surprise represents the extent to which this consensus estimation is biased.
Data and Methods
Data
Our data, which come from Seeking Alpha (https://seekingalpha.com/), include 99,307 transcripts of quarterly earnings calls for 5,986 firms from 2008 to 2016. We trained a word-embedding model (described in greater detail below) on the text of these calls to develop quarterly measures of performative atypicality for each firm. We then merged our measures of performative atypicality first with analyst estimates from the Institutional Brokers’ Estimate System (I/B/E/S, using unadjusted data) to derive our dependent variables, and second with firm performance data from Compustat. To model analyst reactions, we used firm—quarter observations for which we could measure performative atypicality, our dependent variables (earnings surprise and analyst disagreement), and a host of additional control variables described below. To ensure that our estimates are not driven by outliers or especially small firms, and in a manner consistent with standard practice, we winsorized analyst disagreement at the top 99 percent level and earnings surprise at the 99 percent level on both ends and removed observations for firms whose stock price was less than $1 or whose book value was less than $5M. This resulted in a total of 61,670 firm—quarter observations.
Measuring Performative Atypicality: Word-Embedding Models
We derived our measure of performative atypicality by using word-embedding models, a neural network-based, unsupervised machine learning method for representing words in a high-dimensional vector space. These models are especially well-suited to analyzing connotative information in conversational text and are inspired by the distributional hypothesis, which states that the meaning of a word depends on the contexts in which it appears (Harris, 1954; Lenci, 2018). The approach we use in this study relies on the continuous bag-of-words (CBOW) method, wherein a two-layer neural network is trained to predict a word based on its surrounding words (Mikolov et al., 2013). Each word is then projected to a location in a shared vector space with several hundred dimensions. Although these dimensions are often uninterpretable to human observers, the resulting vectors are generally found to capture meaningful semantic relations between words such that the distance between two words in this high-dimensional space inversely corresponds to their semantic similarity (Mikolov et al., 2013).
Word-embedding models are especially useful for our purposes as they effectively capture connotative meanings above and beyond the literal meanings of words (Kozlowski, Taddy, and Evans, 2019; Lix et al., 2022). Previous research has demonstrated that implicit gendered associations in the meanings of various occupations track with these occupations’ historical gender compositions (Garg et al., 2018) and that different lifestyle activities invoke class, race, and gender identities (Kozlowski, Taddy, and Evans, 2019). These studies identified specific dimensions of meaning—gender, class, or race—by measuring the distance between a focal word and exemplars in the relevant meaning dimension (e.g., “woman”). Because we do not focus on specific words or specific dimensions of meaning, we employed a different approach wherein we measured the similarity between two earnings calls as the distance between their centroids (averaged across all words in each call) in embedding space. This captured the overall similarity in meanings conveyed in the two calls.
To illustrate the advantage of our approach, consider a situation in which we have three real-estate firms—A, B, and C—and three words in the vocabulary—“office,”“space,” and “personality.” Assume further that Firm A uses only the word “office” in its transcript, Firm B uses both the words “office” and “space” in equal proportions, and Firm C uses both the words “office” and “personality” in equal proportions. A simple frequentist approach that does not account for the semantic relationships between words would find that the calls of Firms B and C have the same level of similarity to the call of Firm A. Yet, Firm A ought to be considered closer to Firm B than to Firm C, given the semantic dissimilarity between “personality” and “office” or “space” relative to the latter two words’ similarity. Firm C’s vocabulary carries meanings that are not common in real-estate parlance.
We pre-processed each transcript, following usual guidelines in natural language processing (i.e., removing digits, punctuation, and stopwords and then tokenizing the text). After pre-processing, we trained word-embedding models on a quarterly basis to account for potential shifts in word meanings that may have occurred over our observation period (Hamilton, Leskovec, and Jurafsky, 2016). Specifically, for each quarter, we trained a model on transcripts representing calls that took place in the focal quarter or in the three preceding ones. For example, the model for Q4 2016 was trained on transcripts of earnings calls that occurred between Q1 2016 and Q4 2016. We used quarter-specific vocabularies containing 10,000 words each. We then represented firms within this semantic space and derived a measure of performative atypicality by considering each firm’s distance in this space from its competitors. We provide validations of the word-embedding models in Online Appendix A.
Measure Construction
To measure performative atypicality, we first represent each transcript as the sum over the words it contains of each word’s embedding vector by the word’s frequency in the transcript. Let f index firms, q index quarters, and Cf,q denote a quarterly earnings call for firm f at quarter q. We represent each call’s embedding centroid as follows:

where
The centroid
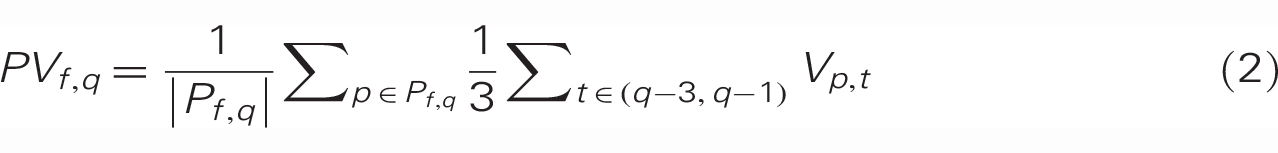
where
To determine a firm’s set of peers, we draw on the Text-based Network Industry Classification (TNIC) developed by Hoberg and Phillips (2016). Drawing on firms’ product descriptions in their annual 10-K statements, this classification identifies a set of competitors for each firm in a given year. This classification is particularly suited for our purposes for two reasons. First, because it depends on product descriptions, this classification comes closer to identifying competitors than do traditional industry classifications such as SIC or NAICS. 7 Second, because the set of competitors varies by firm, firms are not lumped into mutually exclusive categories. This applies especially to multi-category organizations and is more consistent with how audiences classify firms. We define performative atypicality as the cosine distance between a firm’s centroid and its peer centroid. To account for the right-tailed skewness of this measure, we log transform it as follows:

Performative atypicality,
Performative atypicality is sensitive to the length of the earnings call. Longer calls provide an opportunity for a wider range of meanings to be discussed, mechanically reducing performative atypicality. We therefore remove calls that include fewer than 200 words and include call length as a control variable in multivariate models. When we report uni- or bivariate distributions, we use the performative atypicality measure adjusted for call length. This measure is calculated as the residual in a linear model wherein performative atypicality is predicted from the logged number of words in a call.
Categorical Atypicality
Given that prior research has extensively demonstrated the relationship between categorical atypicality and analyst valuations (though more-recent work has challenged the categorical atypicality discount; see Goldfarb and Yan, 2021), we do not explore it further. Nevertheless, we include it as an independent variable in all our models for two reasons. First, we aim to explore whether categorical and performative atypicality exhibit different patterns and relate differently to analyst valuations. Second, we seek to demonstrate that categorical and performative atypicality are independent of each other; performative atypicality is not merely a proxy for categorical atypicality.
Following Bowers (2014) and Zuckerman (2004), we implement categorical atypicality as an organization’s “coherence,” which we infer from the degree of stock coverage overlap among the analysts covering its stock. This operationalization assumes that the perceptions of evaluators best reflect an organization’s categorical atypicality. We infer these perceptions, in turn, from the extent to which a firm draws a varied or homogeneous set of evaluators. Organizations covered by analysts who tend to cover different stocks are, by this construction, categorically atypical.
To construct this measure, we first calculate for each pair of analysts i and j their level of coverage overlap as
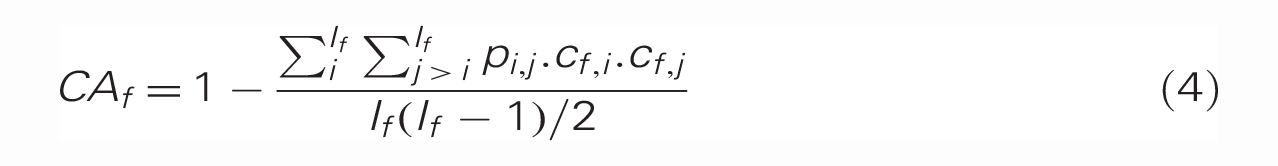
where
This measure is sensitive to the number of analysts covering the firm,
Dependent Variables
Analyst disagreement
To evaluate the relationship between performative atypicality and analyst disagreement, we use the standard deviation in analysts’ estimates for a given quarter. We compute this variable directly based on analysts’ estimates, using each analyst’s most recent estimate for a given quarter. To mitigate the influence of extreme values, we winsorize this variable at the top 1 percent.
Earnings surprise
To evaluate the relationship between performative atypicality and analyst bias, we compute earnings surprise for a given quarter. Following standard practice in research on earnings surprises, we use the difference between a firm’s reported earnings per share and analysts’ consensus estimate (i.e., the median estimate across analysts for a given quarter) divided by the firm’s stock price at the end of the preceding quarter (Livnat and Mendenhall, 2006; Barron, Byard, and Yu, 2008; Westphal et al., 2012; Guo, Sengul, and Yu, 2019). We then multiply it by 100 so that an earnings surprise of 1 means that the earnings surprise is 1 percent. For example, for a firm with reported earnings of 1, a consensus estimate of 0.99, and a stock price of 1, the earnings surprise is then l00x(l–0.99)/1 = 1 percent. To mitigate the influence of extreme values, we winsorize this variable at the top and bottom 1 percent (as, for example, in Skinner and Sloan, 2002; Bochkay, Hales, and Chava, 2019). 9 The mean earnings surprise is slightly negative in our sample, which is in line with other studies using similar measurements of surprise (such as Livnat and Mendenhall, 2006; Akbas, 2016; Lee, 2016; Hartzmark and Shue, 2018).
Control Variables
We include a variety of control variables to account for additional factors that can affect the dependent variables. The controls fall into three main categories: firm, call, and analyst attributes. Moreover, to control for mean differences between industries, we include industry fixed effects in all models that do not include firm fixed effects. The industry classification is based on the Text-based Fixed Industry Classifications (Hoberg and Phillips, 2016), which is the equivalent of two-digit SIC codes.
Firm Attributes
Assets
We control for firm size by using log of assets.
Leverage
We control for leverage, measured as total liabilities over total assets, and winsorized at the top and bottom 1 percent. Leveraged firms have limited access to credit and greater cash flow constraints, which makes them more likely to experience a negative earnings surprise. Moreover, as previous research suggests, investors’ reactions to the information communicated in earnings calls is contingent on firms’ risk profiles (Pan et al., 2018).
Preceding positive surprise
Recent surprises convey signals on future performance that may influence the perception of market participants (e.g., Pfarrer, Pollock, and Rindova, 2010; Shanthikumar, 2012). We thus control for past earnings surprises by using a dummy that takes a value of 1 if there was a positive earnings surprise in the preceding quarter and 0 otherwise. 10
Call Attributes
Order in quarter
Interviews we conducted with communication professionals who advise management teams on how to prepare for quarterly earnings calls suggested that firms sometimes make strategic choices about when to schedule their calls relative to those of other firms. In some situations, firms prefer to go early in the call order so they can shape the industry narrative. In other cases, they prefer to go later so they can hear from their peers before deciding on their own messaging. We therefore control for the order of a firm’s call in a given quarter relative to those of other firms in the same industry.
Positivity
Managers strategically influence the tone of conference calls (D’Augusta and DeAngelis, 2020). As these strategic efforts may correlate both with atypicality and future earnings, we control for the positivity of the earnings call. To do so, we use Loughran and McDonald’s (2011) sentiment dictionary for financial disclosures. We compute positivity as the difference between the number of positive and negative words divided by their sum.
Time horizon
The time orientation of an earnings call may convey signals about the firm’s subsequent ability to achieve robust performance in the future. We therefore control for the call’s time horizon, using DesJardine and Bansal’s (2019) dictionary of short-term- and long-term-oriented words. Specifically, we operationalize time horizon as the difference between the number of long-term words and the number of short-term words divided by their sum.
Litigiousness
A high litigation risk may impact subsequent surprise (Matsumoto, 2002). Additionally, firms may purposefully use atypical language to remain ambiguous regarding ongoing litigations. We thus control for the litigiousness of calls by using the proportion of litigious words in the call. To identify litigious words, we again use Loughran and McDonald’s (2011) sentiment dictionary for financial disclosures.
Length
As mentioned, an earnings call’s length mechanically correlates with performative atypicality. Call length may also relate to future earnings surprises, for example, if it indicates firm risk, above and beyond its mechanical relationship with performative atypicality. We therefore include as a control the log of the total number of words in the call after tokenization.
Analyst Attributes
Analyst churn
Analysts have some latitude in deciding which firms to cover. The composition of analysts is likely related to the probability of an earnings surprise and may be spuriously related to performative atypicality. In particular, because analysts specialize by industry, they may be discouraged by performative atypicality, resulting in their decision not to cover such firms. Moreover, atypical firms may attract inexperienced analysts. Both of these mechanisms would lead to larger surprises. To ensure that this does not drive our results, we control for analyst churn, i.e., the proportion of analysts producing an estimate for the current quarter who did not produce an estimate for the preceding one.
Number of estimates
As noted, the number of analysts covering a firm mechanically correlates with its categorical atypicality. Additionally, firms that draw a smaller number of analysts may be more likely to experience an earnings surprise. We thus control for analysts’ coverage, using the total number of analysts publishing an estimate for the firm’s earnings in the current quarter.
Disagreement
In models in which earnings surprise is our dependent variable, we control for the standard deviation in analysts’ estimates, given that surprises are more likely to occur when analysts have divergent expectations of future performance.
Results
Our empirical analysis has three components. First, we explore the distributional properties of performative atypicality. This distributional analysis aims to (1) validate our measure by demonstrating that it is high for firms that are known for being performatively atypical, (2) evaluate the extent to which performative and categorical atypicality capture different empirical phenomena, and (3) demonstrate that performative atypicality exhibits within-firm variation as we conjecture. In the second part of the analysis, we explore the relationship between performative atypicality and future earnings surprises. Finally, in the third part of our analysis, we use the tools of computational linguistics to inductively unpack the relationship between performative atypicality and analysts’ evaluations. Our objective is to understand why analysts interpret this form of atypicality the way they do.
Performative Atypicality’s Properties
We begin by exploring the distributional properties of performative atypicality. Figure 1 plots the kernel density for performative atypicality (we report descriptive statistics of the main variables of interest in Table 1). As the figure demonstrates, performative atypicality roughly follows a normal distribution.
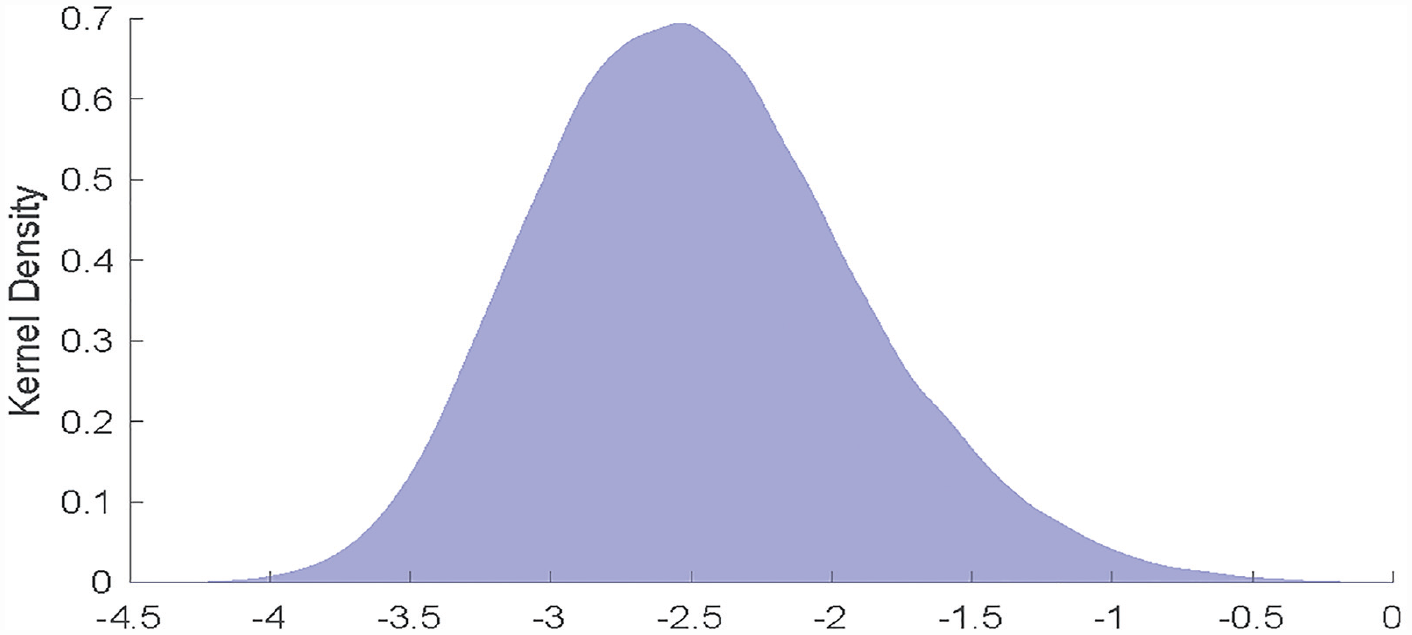
Kernel Density for Performative Atypicality
Descriptive Statistics and Correlations
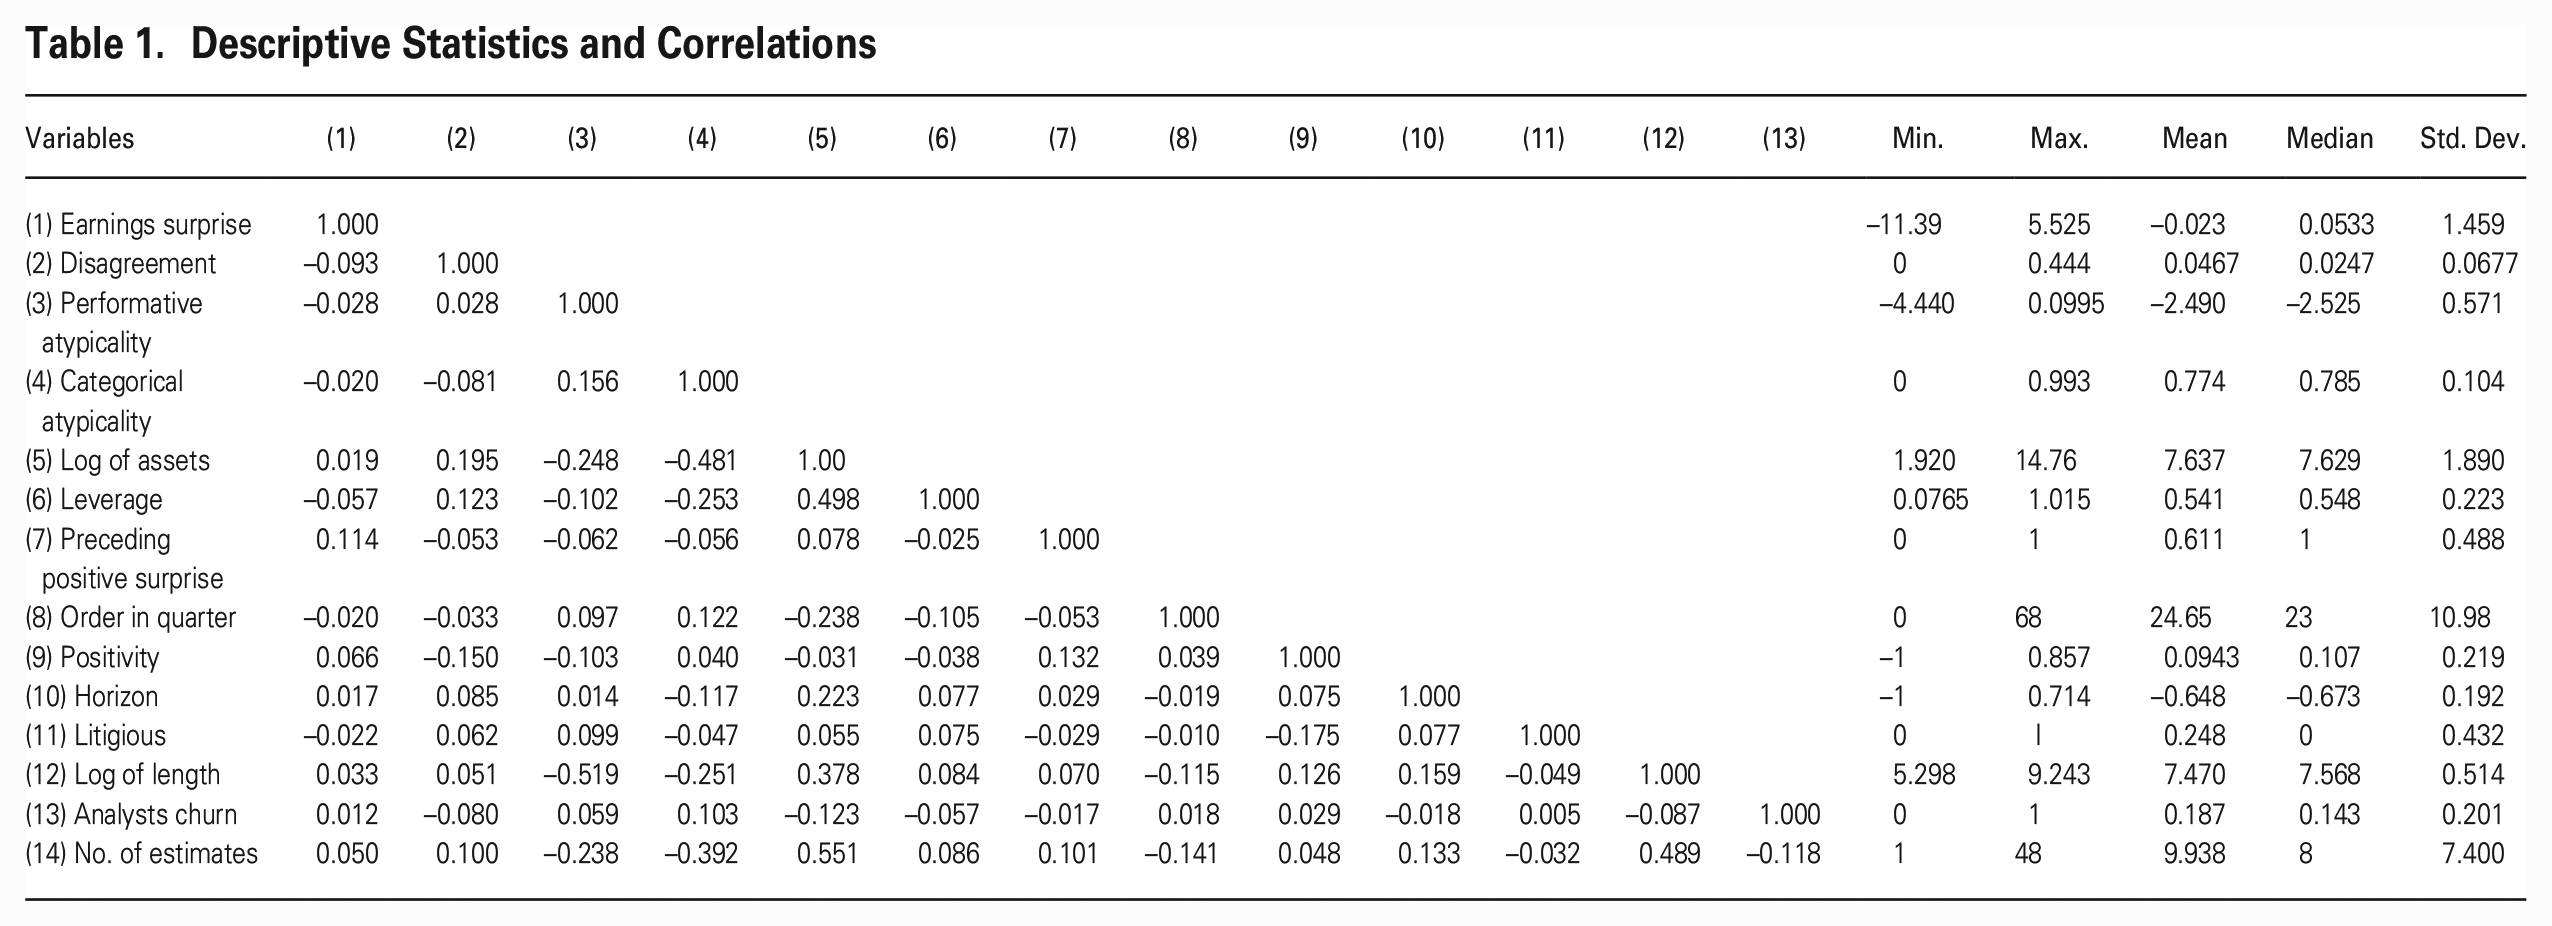
Figure 2 plots standardized performative atypicality (adjusted for call length) as a function of standardized categorical atypicality (adjusted for number of estimates). Each dot corresponds to one firm such that its location on the plot corresponds to the firm’s levels of atypicality averaged across all time periods. Dot sizes are proportional to firm size (in assets, logged). We highlight various firms for illustrative purposes.
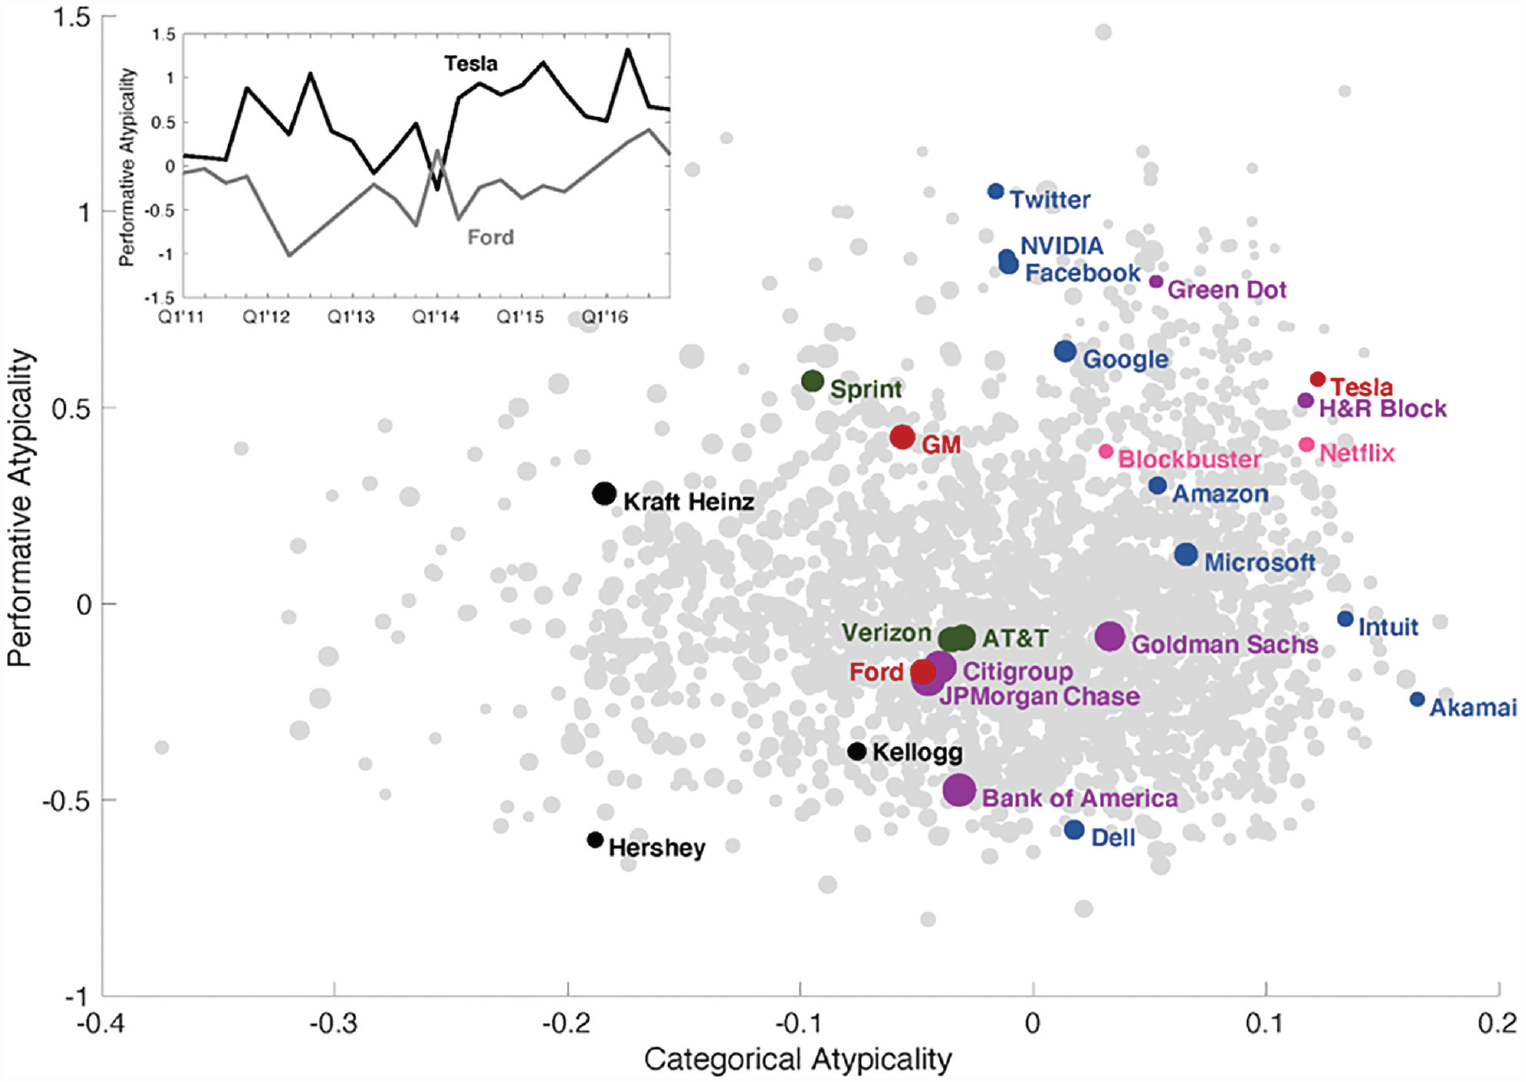
Atypicality by Firm*
The patterns in Figure 2 support our assumptions about performative atypicality. First, validating the measure, the figure illustrates that performative atypicality is higher among firms that have a reputation for doing things differently. Consistent with our intuitive expectations, iconoclastic technology firms such as Twitter and Facebook are among the highest in performative atypicality overall. Differences within industries also conform to these expectations. Tesla, for example, is significantly more performatively atypical than Ford. Similarly, Nvidia and Google are much higher in performative atypicality than are Microsoft or Dell. And whereas major banks such as JPMorgan Chase are below average in performative atypicality, Green Dot, a mobile banking platform, is among the highest. Importantly, differences in performative atypicality do not merely reflect differences in technological innovation. Sprint, for example, stands out relative to other mobile operators, while General Motors is much more performatively atypical than Ford despite both having almost identical categorical atypicality levels.
Moreover, the mean levels of performative atypicality substantially vary between industries. Although there is significant variation within the food industry between firms such as Kellogg, Hershey, and Kraft Heinz, for example, their mean performative atypicality is low relative to that of software companies. This finding comports with naïve expectations that technology sectors exhibit greater overall atypicality than traditional industries do and underscores the need to account for mean differences between industries in estimations of between-firm effects, as we do below.
Second, it is evident that the two forms of atypicality, performative and categorical, capture different phenomena. Although the two adjusted measures are significantly correlated at the mean firm level (ρ = 0.092, p < 0.001), this correlation is weak. Overall, across all quarterly observations, the correlation between the adjusted measures is even weaker (ρ = 0.035, p < 0.001). 11 Firms like Akamai (a provider of distributed computing platforms, cybersecurity, and cloud computing) and Intuit (a financial services and software company), which are among the highest in categorical atypicality, exhibit below mean levels of performative atypicality. While their product portfolios comprise quite unusual combinations, their performances in quarterly earnings calls are fairly standard.
Finally, consistent with our argument that performative atypicality is dynamically produced, it exhibits greater within-firm variance than categorical typicality does. While there is significant variation in performative atypicality between firms, a substantial proportion of the variance is explained by fluctuations within firms. As the inset in Figure 2 illustrates, even Tesla and Ford, two car manufacturers with consistently high and low performative atypicality, respectively, exhibit significant within-firm variation. In fact, as Panel A of Figure 3 shows, differences between firms explain roughly half of the variance in performative atypicality; the rest is attributable to within-firm fluctuations. In contrast, between-firm differences explain roughly 85 percent of the variance in categorical atypicality. Panel B of the figure also reflects this, plotting the kernel densities for the standard deviation by firm for both types of (adjusted and standardized) atypicality measures. As this plot demonstrates, there is far greater variation within firm for performative atypicality than for categorical atypicality.
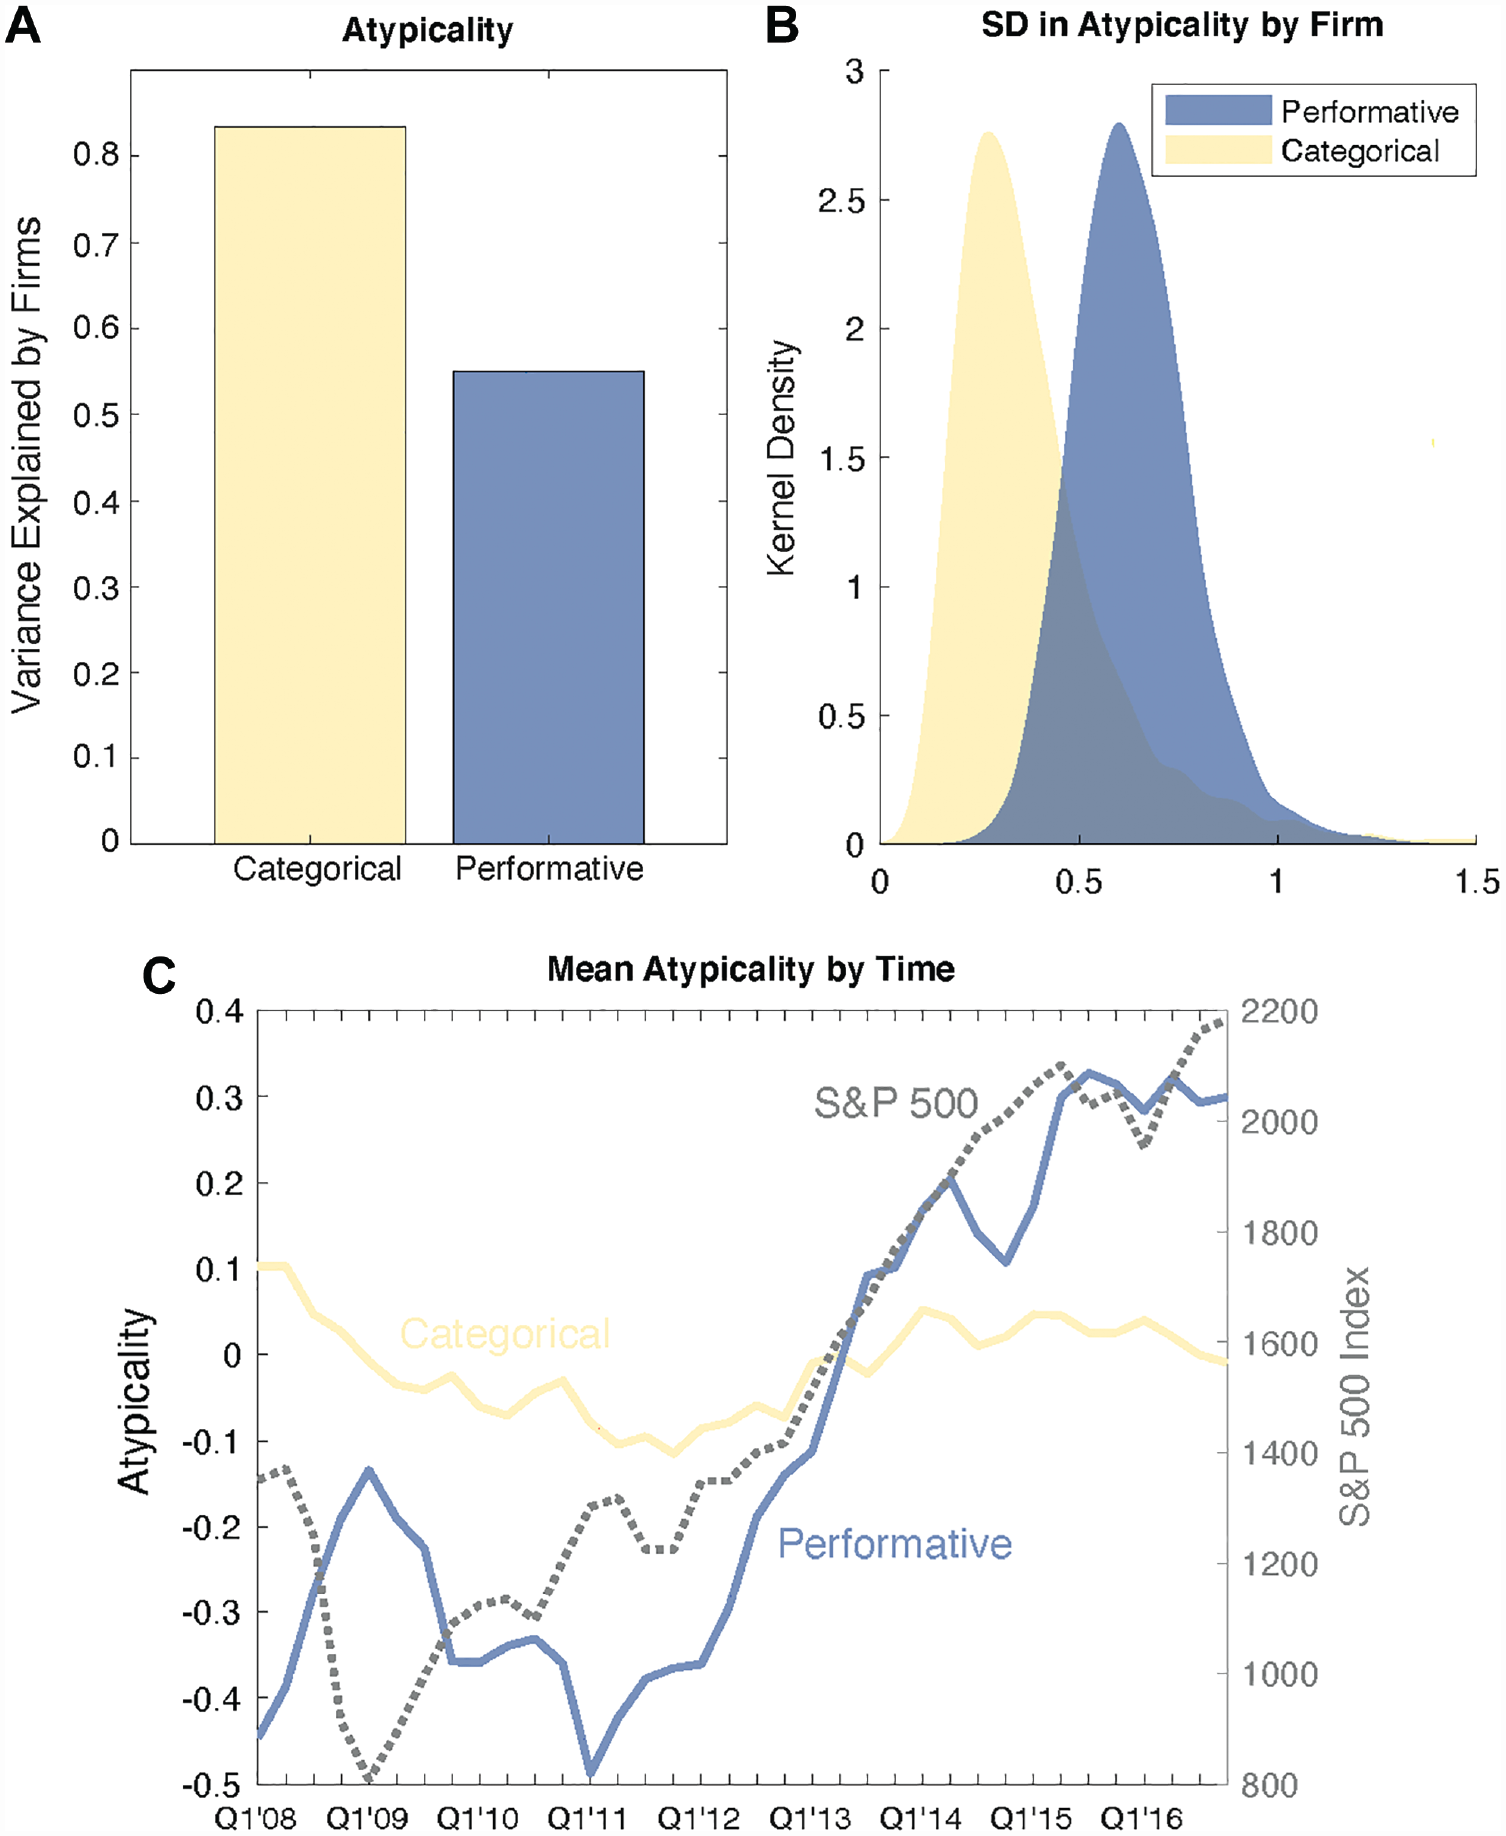
Variance in Performative and Categorial Atypicality*
This finding is also evident in Panel C of Figure 3, which plots mean (standardized) performative and categorical atypicality over time. Once again, we see that performative atypicality is less stable than categorical atypicality. Changes in mean levels of performative atypicality closely track movement in the S&P 500 index, whereas changes in categorical atypicality do not, suggesting that firms have more latitude to diverge from performative conventions during times of growth. During the first three years of our observation window, when the market was reeling from the 2008 financial crash and the Great Recession that followed, mean levels of performative atypicality were suppressed. Consistent with research on threat rigidity (Staw, Sandelands, and Dutton, 1981), firms often resort to more-conservative actions during times of uncertainty and instability. Whether performative atypicality is merely self-presentational or a true reflection of firm behavior, we interpret the relationship between market uncertainty and performative atypicality as an indication that the latter signals a firm’s deviation from conventional practices.
The Performative Atypicality Premium
How do analysts interpret performative atypicality? To answer this question, we examine the relationship between performative atypicality and analyst forecasts by using between- and within-firm model specifications. We use ordinary least squares and cluster standard errors by firm in all models to account for within-firm interdependencies. All variables are measured at the quarter level. Given that performative atypicality varies by industry and time (as Figures 2 and 3 show), we include industry and period fixed effects. Because we cannot identify random sources of variation in performative atypicality, our modeling strategy ultimately does not yield causal estimates. Nevertheless, in addition to including fixed effects, we lag the dependent variables (as well as contemporaneous performance controls) such that the effects of atypicality are estimated for analyst disagreement and earnings surprises in the subsequent quarter. For ease of interpretation, both atypicality measures are standardized.
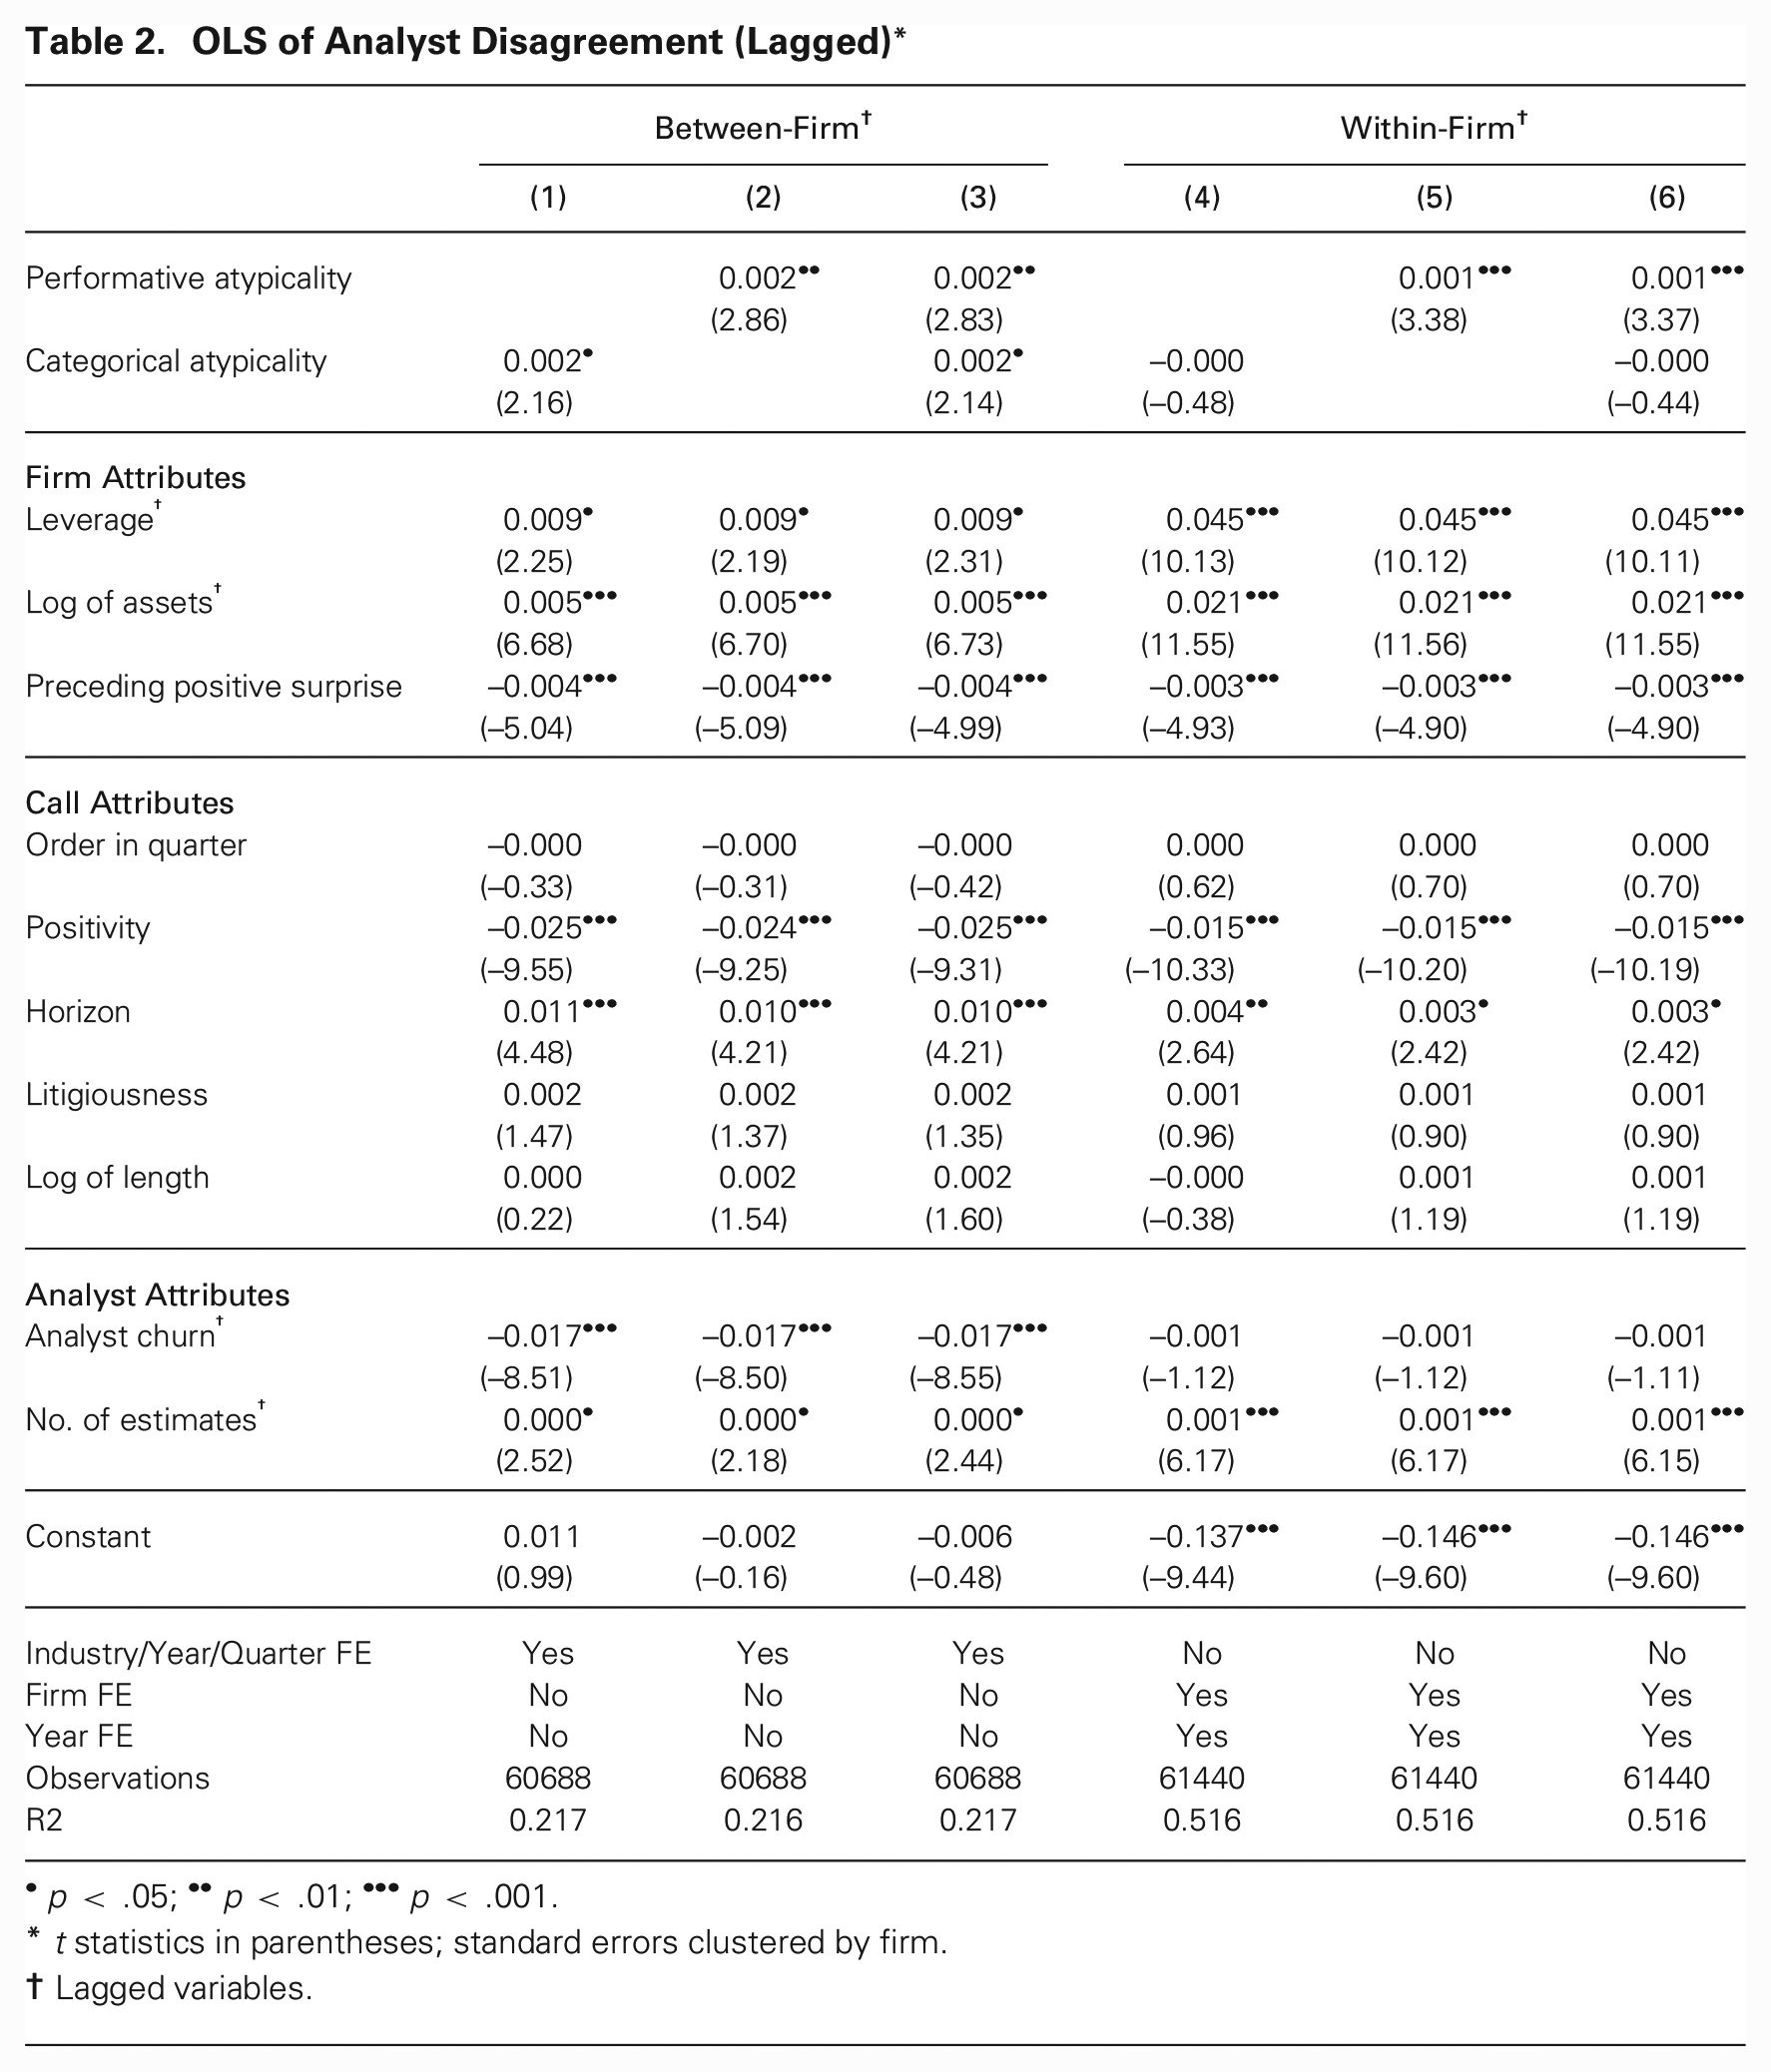
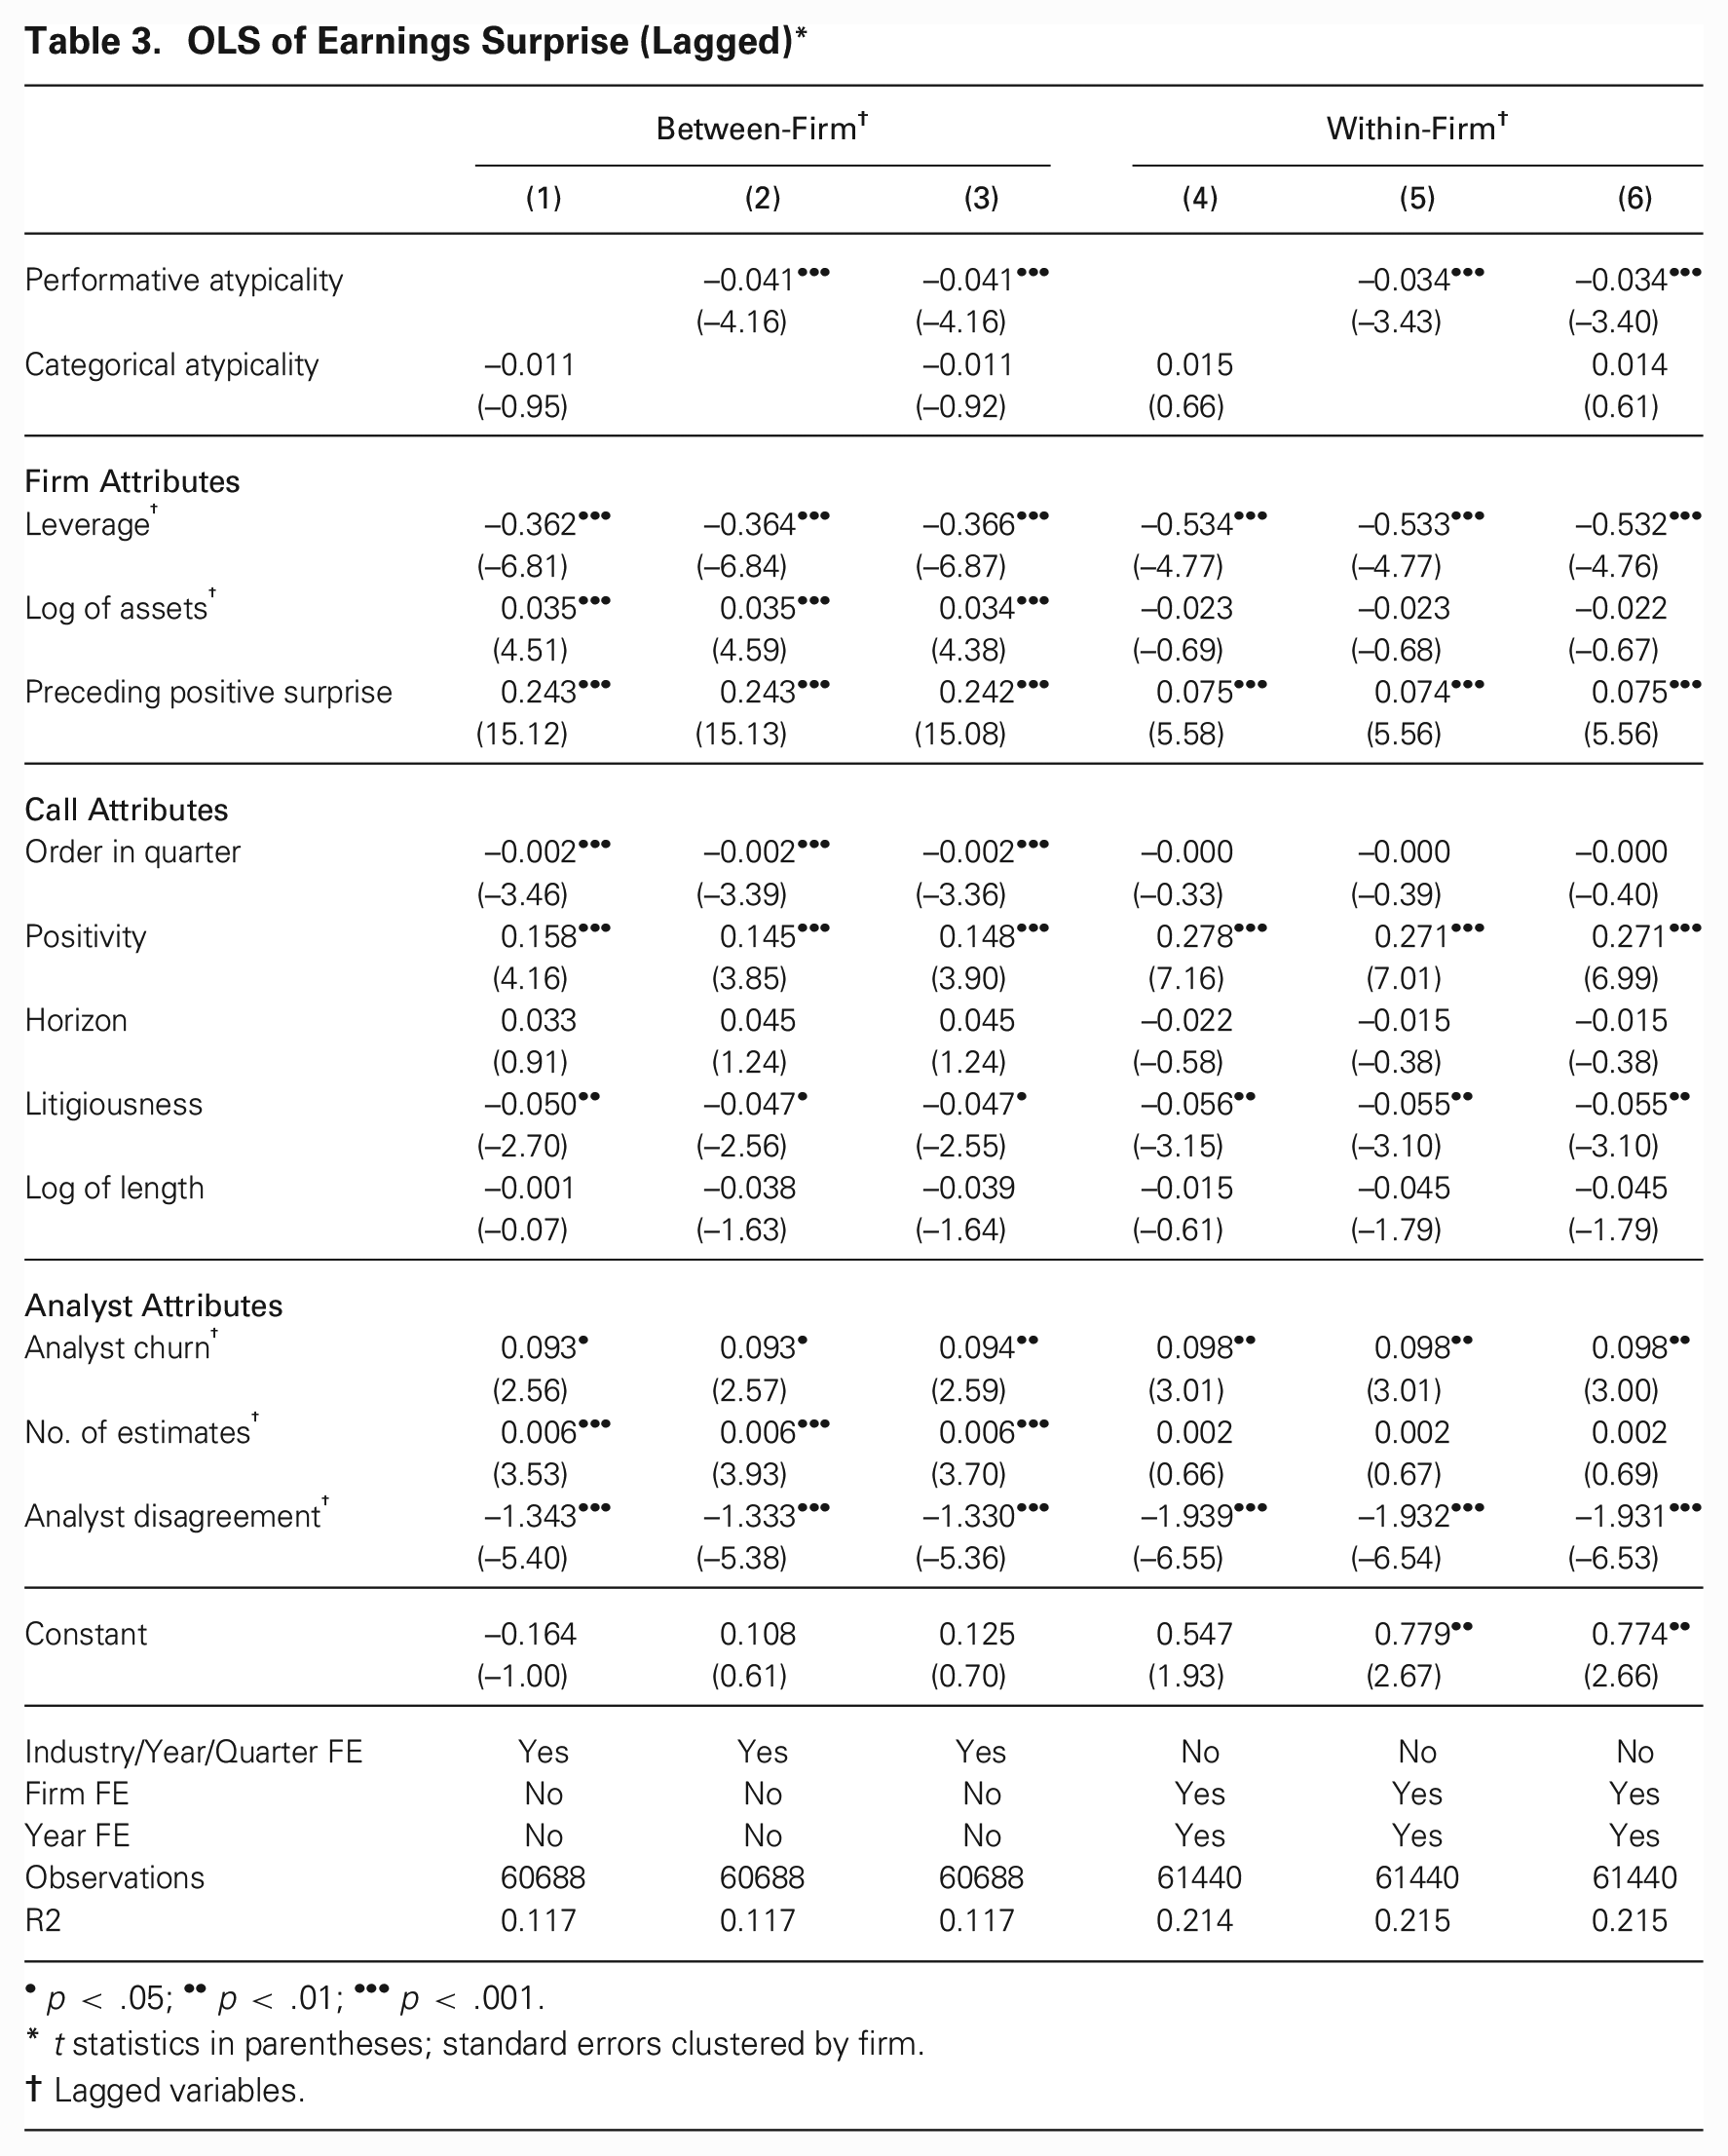
Tables 2 and 3 report results for between-firm (Models 1–3) and within-firm (Models 4–6) OLS models, in which the dependent variable is modeled as a function of performative atypicality. We include categorical atypicality as an independent variable to compare its effects to those of performative atypicality and to explore whether the two forms of atypicality relate differently to analysts’ interpretations. Between-firm models include industry–year–quarter fixed effects, to account for variation attributable to changes within industries over time. These models should therefore be interpreted as reflecting the effects of differences in atypicality between firms that are competing in the same industry and at the same time. 12 The within-firm models include firm and year fixed effects. 13 They should be interpreted as reflecting the effects of changes in atypicality that occur within a firm over its life course, net of its fixed attributes.
OLS of Analyst Disagreement (Lagged)*
p < .05; ••p < .01; •••p < .001.
t statistics in parentheses; standard errors clustered by firm.
Lagged variables.
OLS of Earnings Surprise (Lagged)*
p < .05; ••p < .01; •••p < .001.
t statistics in parentheses; standard errors clustered by firm.
Lagged variables.
Analyst Disagreement
Table 2 reports models estimating analyst disagreement. The effect is positive and significant for performative atypicality across all specifications. We plot the marginal effects estimated by Models 3 and 6 in Figure 4. As a firm becomes more performatively atypical, whether compared to other firms or relative to itself, analysts increasingly disagree about how to predict its future performance. Replicating established findings, Model 1 demonstrates that categorical atypicality is equally disorienting, leading to a similar size increase in analyst disagreement. Model 3 shows that the effects of performative and categorical atypicality on disagreement are independent of each other, further demonstrating that these two dimensions of atypicality relate to different interpretive pathways. Yet, the effect of categorical atypicality becomes insignificant in within-firm specifications (Models 4 and 6). Not only is there far less within-firm variation in categorical atypicality than in performative atypicality (Figure 3, Panel A), but when firms experience shifts in categorical atypicality, analysts appear to be less responsive to such change. We conjecture that this is because they tend to see firms’ categorical identities as fixed.
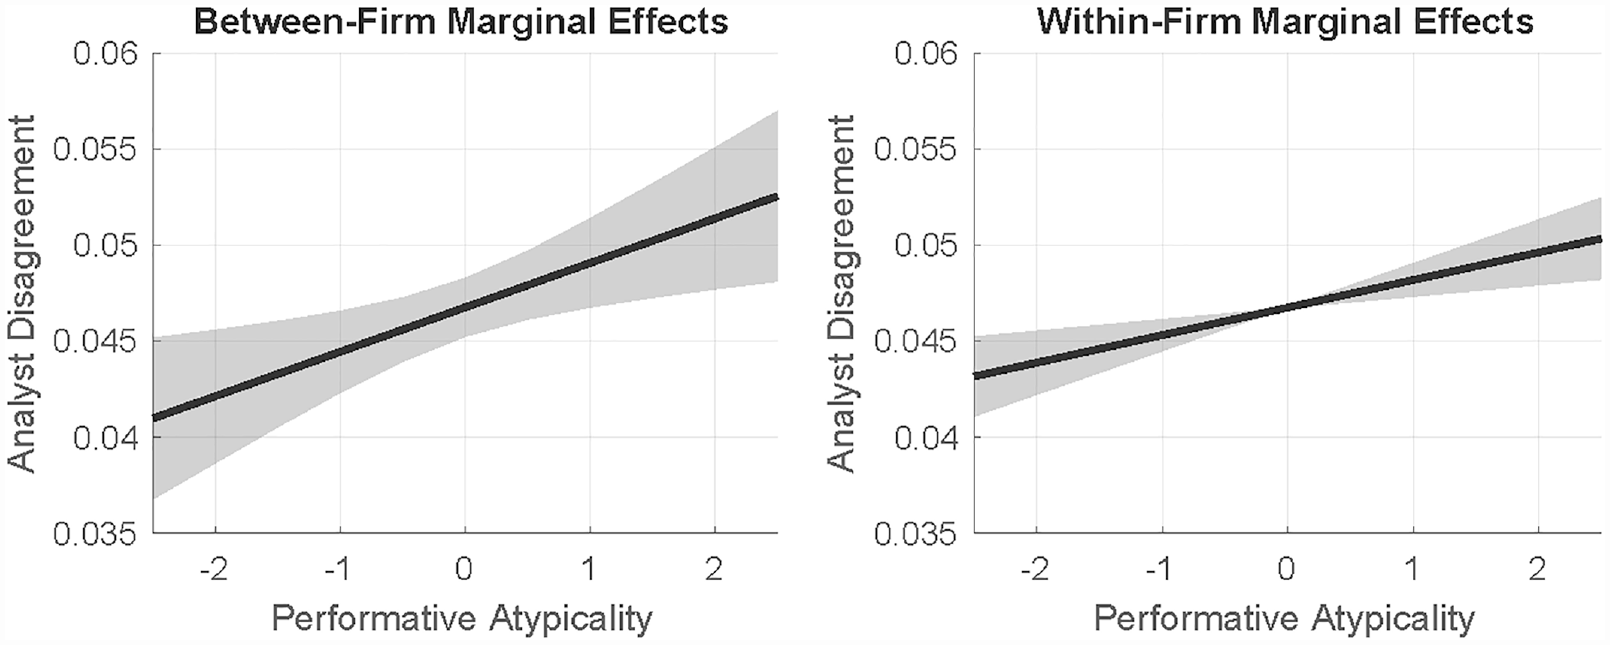
Marginal Effects of Between-Firm and Within-Firm Performative Atypicality on Analyst Disagreement (Models 3 and 6, Table 2)
Earnings Surprises
Results in Table 3 provide robust evidence that analysts reward performative atypicality. Whether estimating between- or within-firm effects, all specifications demonstrate a significant negative relationship between performative atypicality and surprise, indicating that analysts are optimistic about performatively atypical firms. We plot this relationship, as estimated by Models 3 and 6, in Figure 5. As executives veer from conventional meanings in quarterly earnings calls, analysts tend to overestimate the future performance of these executives’ firms. Rather than signaling incompetence, performative atypicality appears to be interpreted as an indication of a firm’s unique capabilities. We refer to this advantage as the performative atypicality premium.
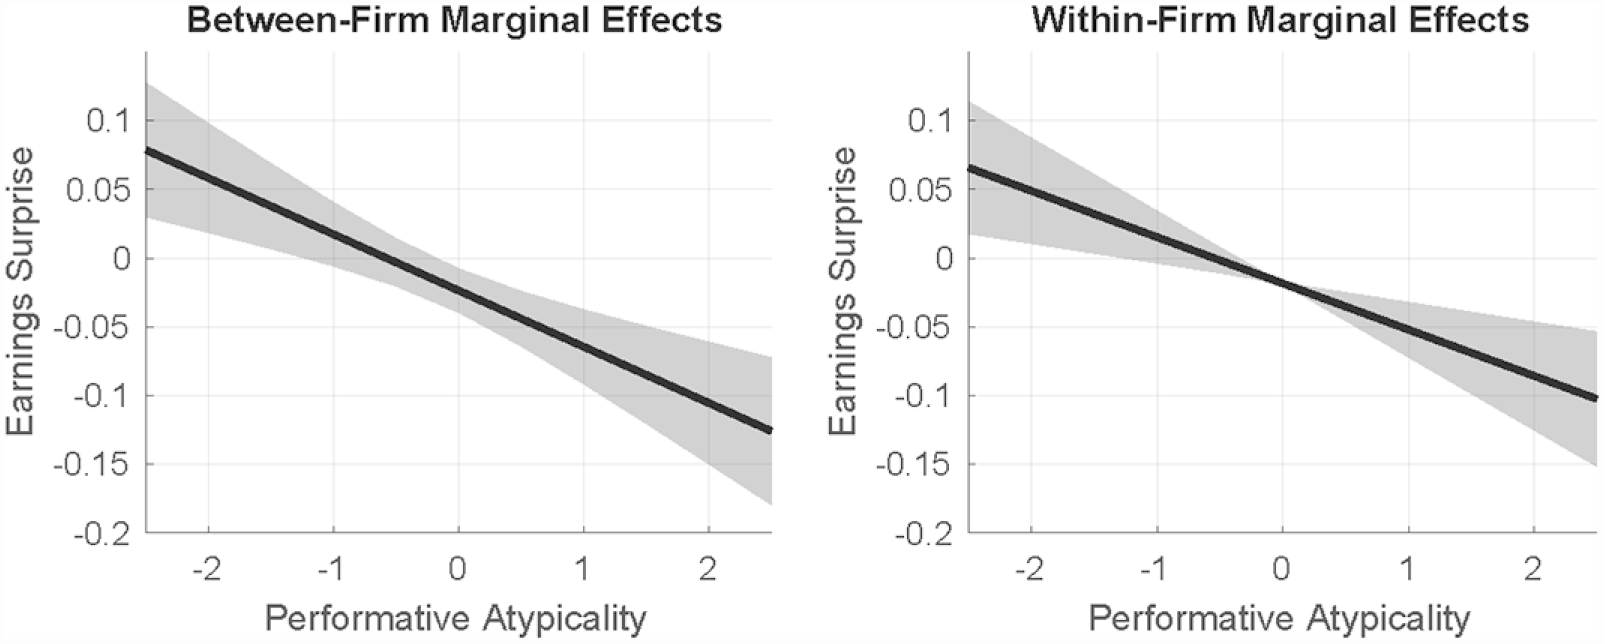
Marginal Effects of Between-Firm and Within-Firm Performative Atypicality on Earnings Surprise (Models 3 and 6, Table 3)
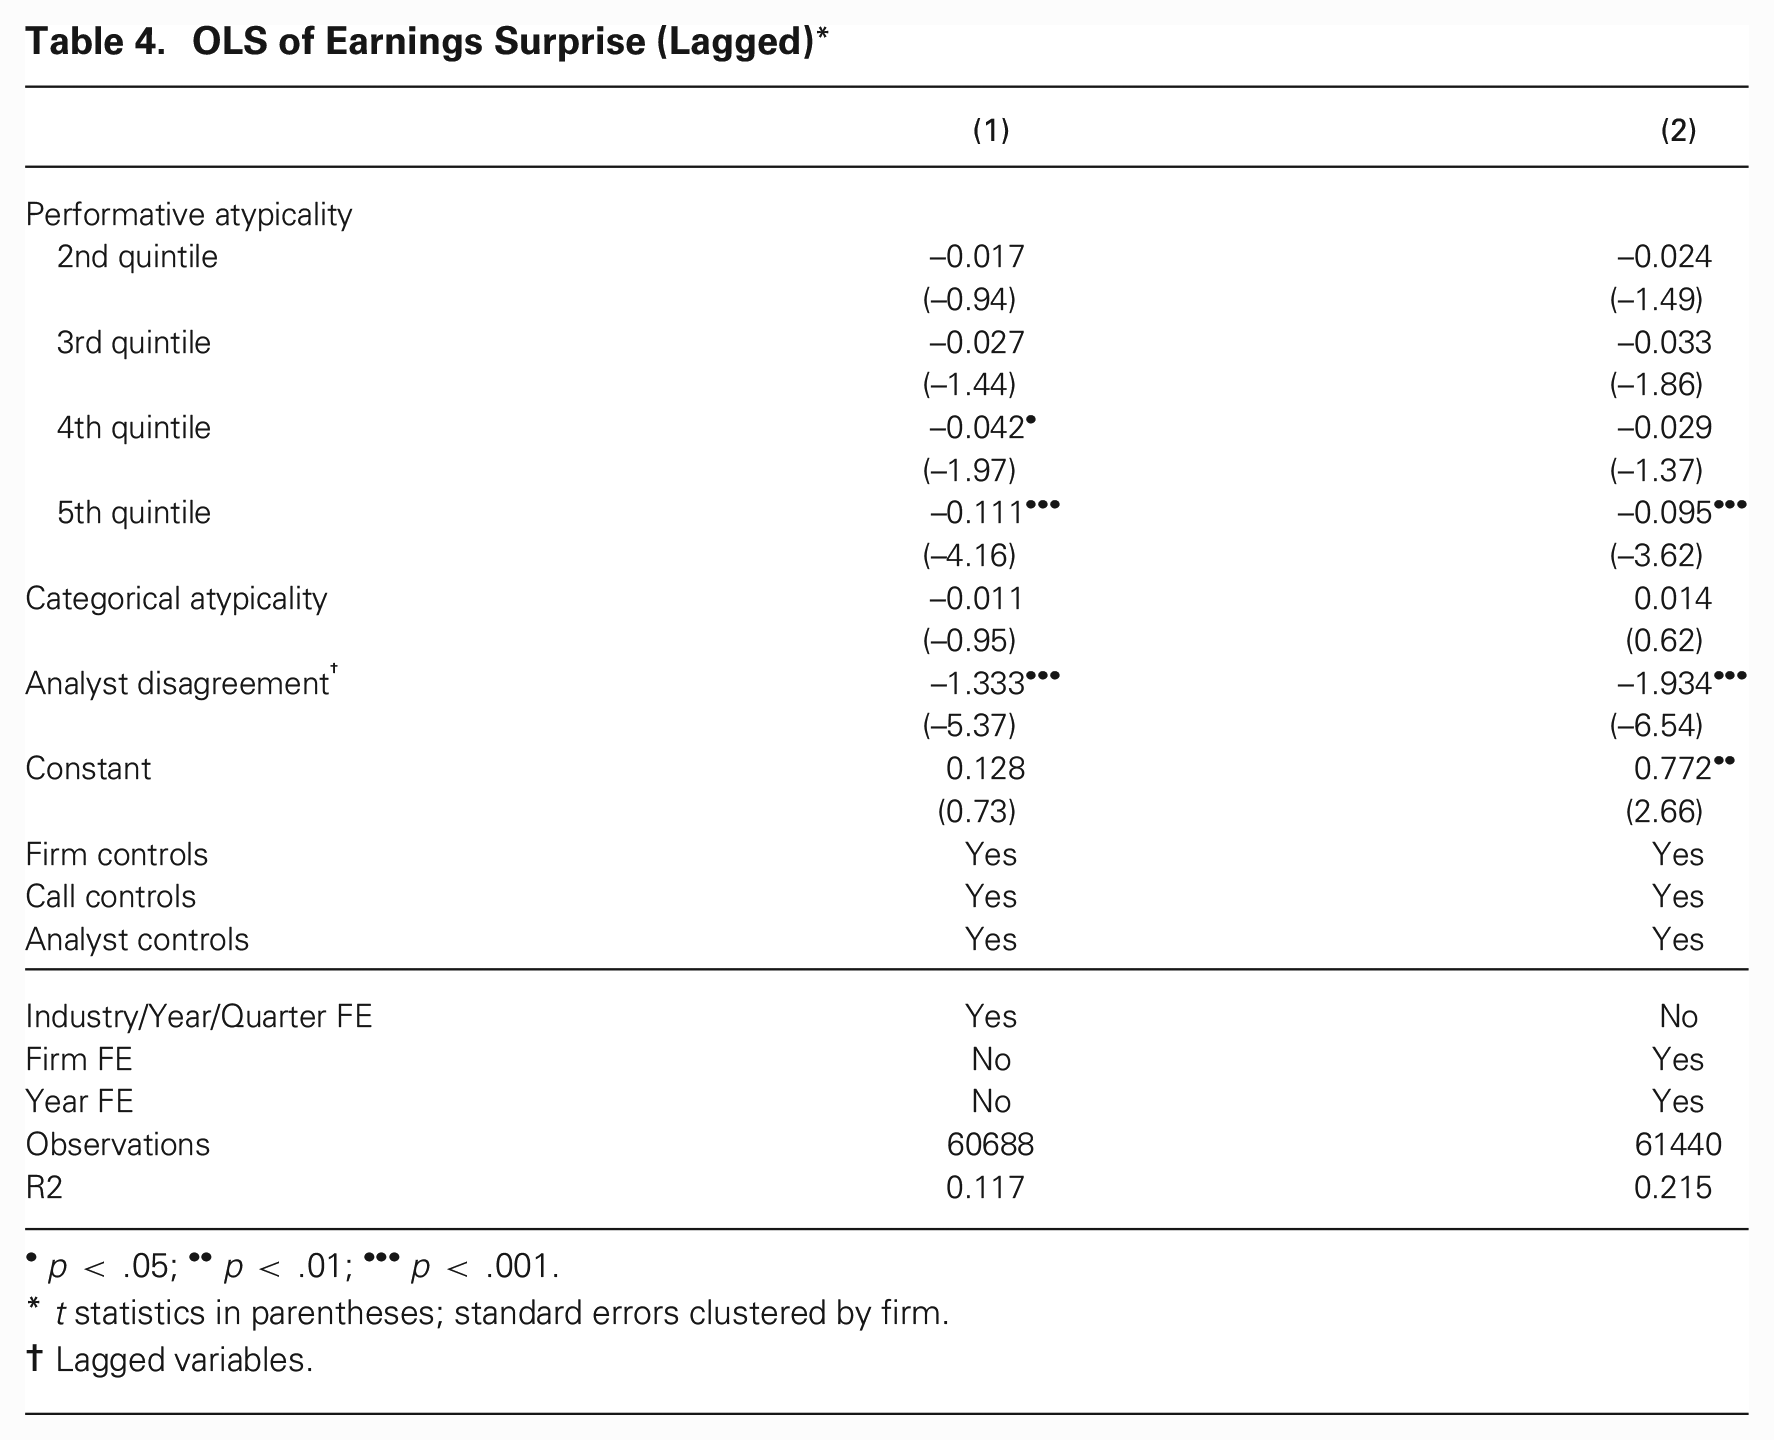
Are the rewards to performative atypicality linear? In the models reported in Table 4, we divide performative atypicality into quintiles. As the results illustrate, analysts are particularly optimistic about the future earnings of firms at the upper quintile of performative atypicality. 14 Given the high within-firm variation of performative atypicality (cf. Figure 3), we interpret this finding as indicating that firms’ performative atypicality has a particularly strong influence on analysts’ evaluations when executives express especially unconventional meanings in their interactions with analysts in a given quarter. Optimal distinctiveness theory would have predicted that analysts overestimate the performance of firms with moderate levels of performative atypicality. Yet, our results indicate that the more performatively atypical a firm, the greater the unjustified enthusiasm of analysts covering it.
OLS of Earnings Surprise (Lagged)*
p < .05; ••p < .01; •••p < .001.
t statistics in parentheses; standard errors clustered by firm.
Lagged variables.
Two different pathways may drive the systematic relationship between performative atypicality and analysts’ biased forecasts. Performative atypicality might be a credible signal of low future earnings if executives behave atypically without conscious awareness when they are trying to conceal negative information. This would produce a negative earnings surprise if analysts fail to pick up on that signal. Alternatively, if performative atypicality is unrelated to future earnings, negative earnings surprises will ensue if analysts misinterpret it as a positive signal. We report results consistent with the latter interpretation in Online Appendix B, showing that performative atypicality is not associated with future low (or high) earnings. We interpret this as evidence that analysts are overly optimistic about the implications of performative atypicality, not that performative atypicality is a signal of low earnings that analysts fail to identify.
Finally, the models reported in Tables 3 and 4 do not find a significant effect for categorical atypicality in any specification. This does not necessarily mean that categorically atypical firms do not suffer an illegitimacy discount; such firms might be discounted by the market, leading analysts to correctly factor that discount into their estimates. 15 Nevertheless, our results clearly indicate that while analysts are overly optimistic about the implications of performative atypicality on future earnings, their estimates are not similarly systematically biased by categorical atypicality. We discuss the implications of this finding below.
What Explains the Performative Atypicality Premium?
Why are analysts swayed by performative atypicality? We posit that there are two general explanations for analysts’ overall tendency to be bullish about the prospects of performatively atypical firms. The first maintains that performative atypicality signals executives’ private information. Analysts interpret executives’ indifference to audience expectations as an indication of their confidence about their firms’ unique capabilities, regardless of what these capabilities are. The content of their performances is therefore less important than the confidence these atypical performances signal. Alternatively, analysts may have a theory of value that privileges certain types of atypicality over others. If that is the case, we should find that the relationship between performative atypicality and earnings surprises is patterned along specific dimensions of meaning.
To evaluate the two possibilities, we inductively explore the semantics of atypical performances. We leverage the scale afforded by word embeddings to identify whether analysts especially reward or penalize certain dimensions of semantic divergence. To do so, we use embedding vector subtraction. As Mikolov et al. (2013) showed, the vector subtraction “King”—“Male” captures a semantic difference that is analogous to the meaning “Royal.” Building on this rationale, we subtract a firm’s peer embedding centroid from its call centroid to capture the call’s semantic difference from its peers. We refer to this difference as an earning call’s atypicality centroid. The atypicality centroid corresponds to the meanings uniquely communicated in a specific call relative to those of its peers (see Online Appendix C.2 for a detailed definition). If atypicality centroids are non-randomly associated with analysts’ reactions, we can conclude that analysts are attentive to the content of performative atypicality.
Drawing on Nelson’s (2020) computational grounded theory approach, we perform this inductive analysis in three steps. In the first step, we use principal component analysis (PCA) to evaluate the extent to which firms’ performative atypicality is structured. We find that a handful of PCA dimensions explain an overwhelming majority of the variance in atypicality centroids, suggesting that atypical performances are not arbitrarily divergent; rather, they are structured by a few dominant axes of meaning. Further analyses show that this variance is explained by differences between firms but not between industries. This assuages concerns that performative atypicality merely captures topical variation driven by differences between industries. We report this analysis in full in Online Appendix C.2.
In the second step, we turn to human-based hermeneutics to systematically interpret these dimensions and explore how they relate to earnings surprises. These results paint a fairly complex picture, as we discuss in detail in Online Appendix C.3. Rather than falling into the trap of fine-grained nuance (Healy, 2017), however, we point to the two overarching conclusions these results afford. First, being performatively divergent does not automatically yield an evaluation premium. Not all types of atypical performances result in systematic analyst overestimation. Second, one underlying axis of meaning appears to dominate the structure of analysts’ reactions. One end of this axis is populated by performances that tend to atypically focus on the procedural aspects of financial earnings. This, we conjecture, connotes the firm’s staid and circumspect formality. At the other end are performances that deviate from conventions by discussing the firm’s innovative competitiveness, its collaborative orientation, and its obligations and opportunities. This semantic axis suggests that analysts develop an optimistic impression of a firm’s earnings prospects when its performative atypicality invokes conventional connotations of innovation and creativity.
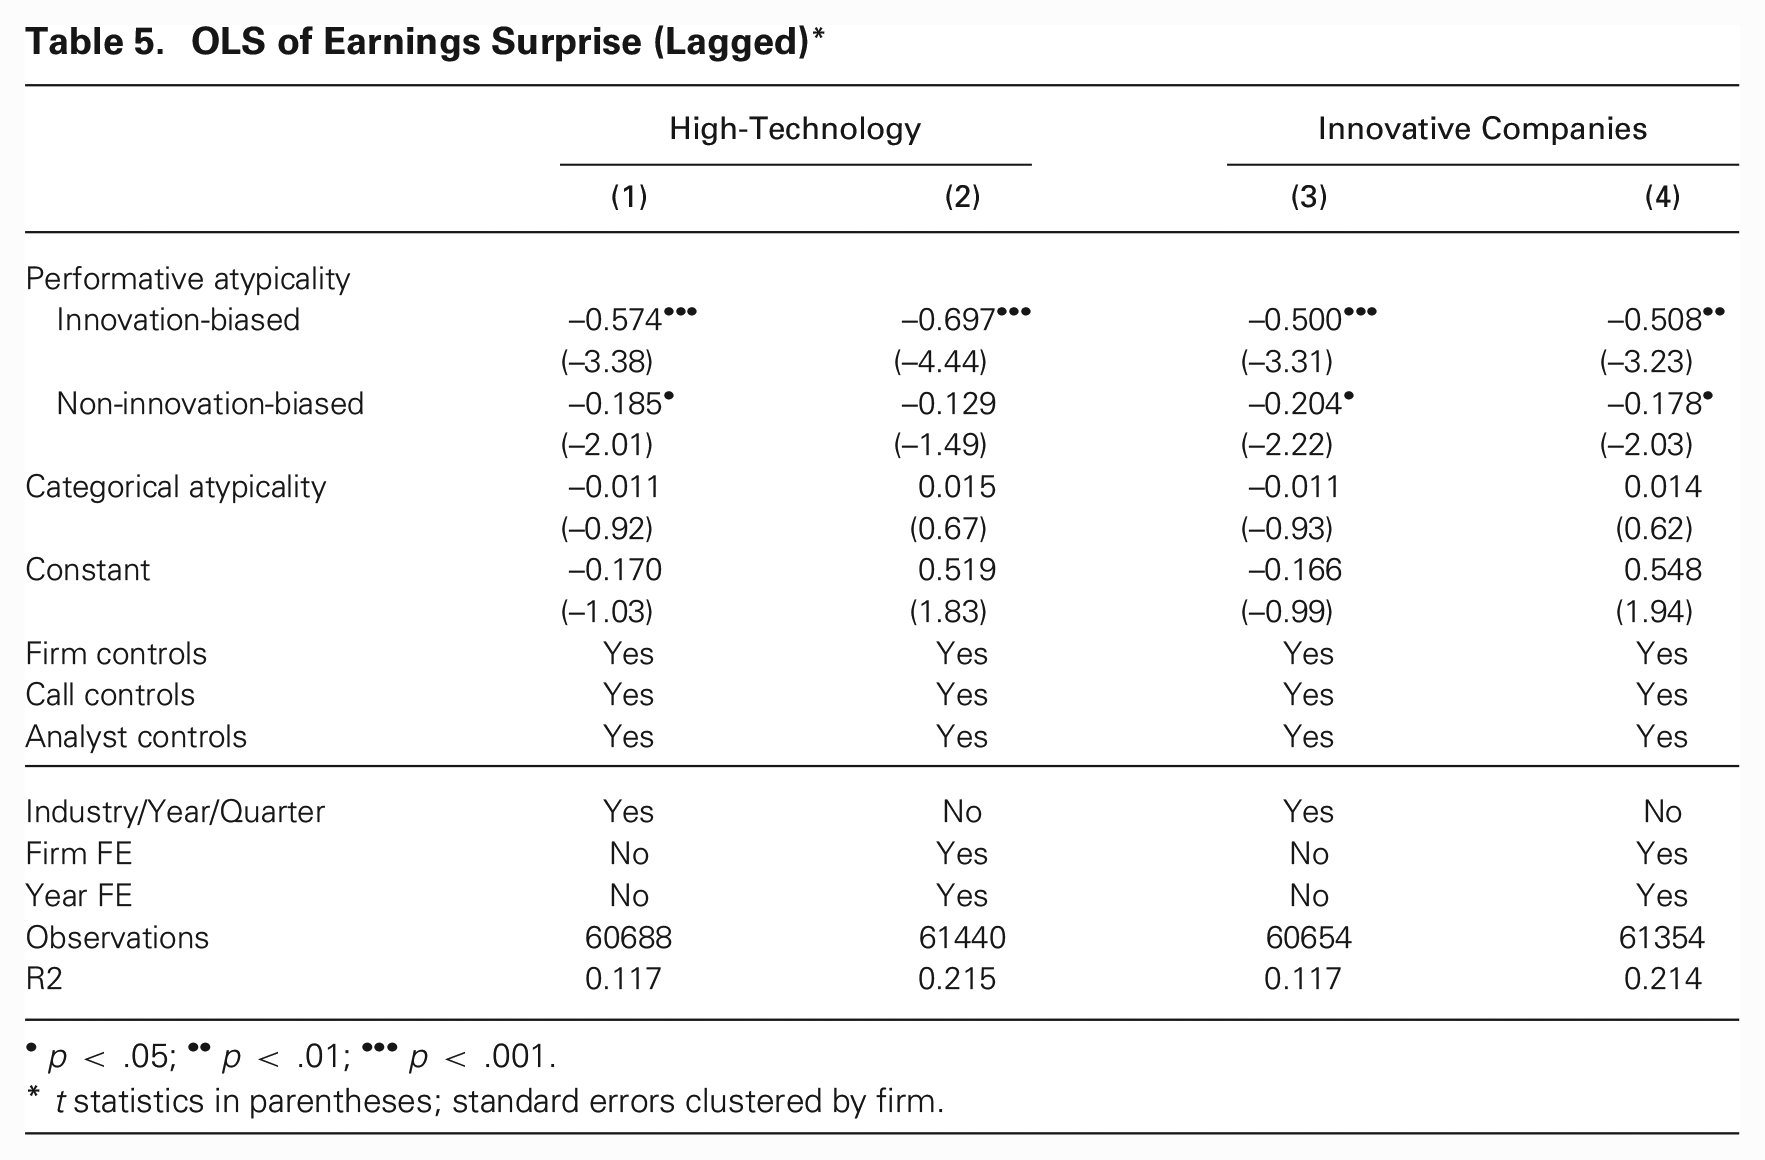
If this interpretation is correct, we should find that the performative atypicality premium is more likely to occur as a firm’s performance becomes more like the performances of firms perceived as innovative and less like its own competitors’ performances. To test this proposition, in the third and final step we decompose an earnings call’s performative atypicality into two components: innovation-biased atypicality and its complement, non-innovation-biased atypicality. Innovation-biased atypicality is the portion of atypicality that emulates performances of firms perceived as innovative. Non-innovation-biased atypicality is the remainder. We operationalize innovative firms either as high-technology firms (using Kile and Phillips’s 2009 classification approach) or as firms listed by Fast Company as among the world’s Most Innovative Companies during our window of observation. Additional details are provided in Online Appendix C.4.
We include innovation-biased atypicality and non-innovation-biased atypicality as variables in between- and within-firm models predicting earnings surprise (following the same specification as that reported in Table 3) and by using both operationalizations of innovative firms. We report results in Table 5. Innovation-biased atypicality significantly predicts a negative earnings surprise in all specifications, irrespective of operationalization or modeling approach. As a firm becomes atypical in a way that connotes innovation, whether relative to other firms or to itself, analysts tend to overestimate its future earnings. Non-innovation-biased atypicality, in contrast, is weaker in its effect on earnings surprise and fails to reach significance in all specifications. Atypicality that does not connote innovation, in other words, has an attenuated effect on analysts’ overestimation of firm earnings.
OLS of Earnings Surprise (Lagged)*
p < .05; ••p < .01; •••p < .001.
t statistics in parentheses; standard errors clustered by firm.
Discussion
Firms that meet or exceed earnings expectations are rewarded by the market (Kasznik and McNichols, 2002). A negative earnings surprise is therefore an adverse outcome that executives seek to prevent. Ironically, however, our results suggest that a firm’s performative atypicality might lead to a subsequent negative earnings surprise because, counterintuitively, analysts interpret such performances as positive signals of a firm’s strategic positioning and future financial performance. While categorical atypicality is ultimately a liability leading to an illegitimacy discount (Zuckerman, 1999), performative atypicality appears to generate a uniqueness premium.
Our inductive analysis led us to conclude that not all forms of performative atypicality are created equal. Atypical performances that invoke meanings of innovation and creativity appear to result in especially buoyant analyst forecasts; other types of atypicality are received with less enthusiasm. Although this buoyancy translates into a disadvantageous position in the setting we study empirically, it may be that it results in significant rewards in other settings if investors, or outside audiences more generally, are commonly swayed by innovation-biased performative atypicality.
The spectacular rise and fall of WeWork, the shared work space management company, provides an instructive example of the innovation-biased performative atypicality premium. Founded in 2010, WeWork’s product was by no means categorically unusual. Shared work spaces were not a novel idea at the time, and competitors such as Regus were already managing such spaces across the globe for two decades prior to WeWork’s entry into the market. Nevertheless, WeWork was perceived as inherently different. Owing to the eccentric style of its founder, Adam Neumann—who was occasionally spotted walking barefoot on the streets of Manhattan and frequently professed unconventional aspirations in interviews and public appearances, such as the desire to live forever—the company was seen as innovative and pioneering relative to its gray, conventional, and seemingly unambitious competitors. In the eyes of many, WeWork was not a typical real-estate company but a “capitalist kibbutz” ushering a new model of work and collaboration. 16 Indeed, Fast Company named WeWork as one of the world’s Most Innovative Companies in 2015. Leading and experienced investors were tempted by this performative atypicality. As Neumann himself confessed, these investments were based more on “our energy and spirituality than . . . on a multiple of revenue.” 17 When the company filed its initial public offering prospectus in 2019, however, it became apparent that WeWork’s revenue model, profitability strategy, and governance structure were inherently flawed. The IPO was subsequently withdrawn, and the company’s valuation, peaking at a staggering $47B, was cut by almost 80 percent.
A story of excess, delusion, and debauchery, WeWork’s implosion has been hailed by some as an “astounding moment in business” (Brown and Farrell, 2021, p. xi), its performative atypicality so extreme that many fell prey to the belief that what was ultimately no more than an office space provider was a truly trailblazing tech company. Our findings suggest that while undoubtedly unusual in magnitude, WeWork’s tale is an extreme manifestation of a more broadly, if modestly, prevalent principle. Firms performatively behaving like celebrated innovators appear to create an exaggerated impression of ability. This, we contend, has several implications for our understanding of how atypicality relates to audience perceptions.
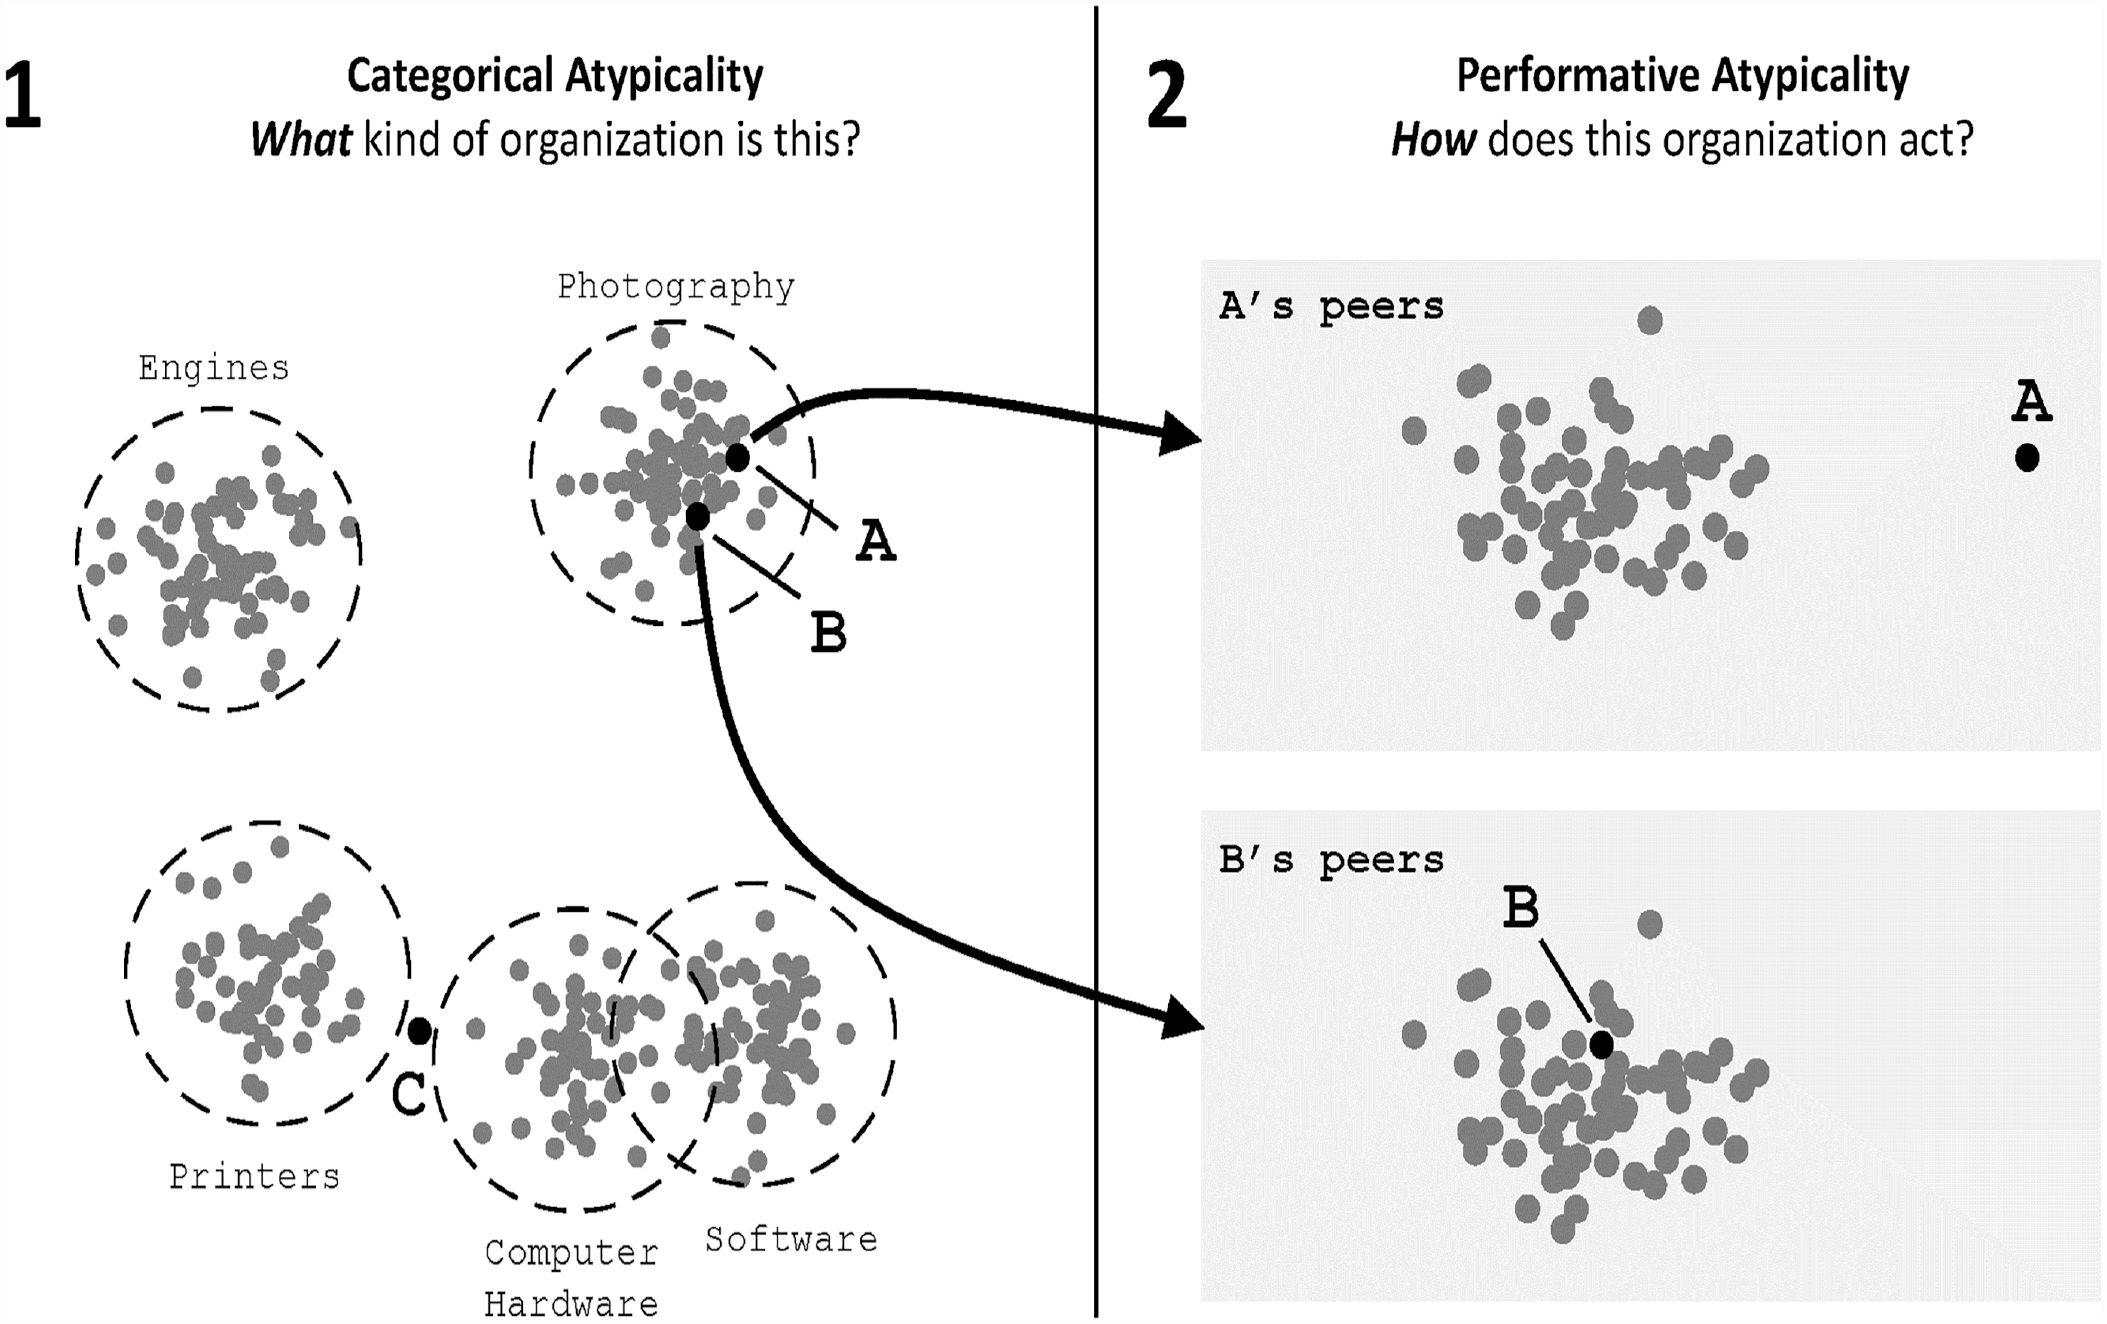
A Bilateral Model of Valuation
Our results are consistent with the two-stage model of valuation. In the first stage, observers determine the “what” on the basis of the products and services an organization offers. In the second stage, they infer the “how” on the basis of the organization’s performative interactions. As we show, the two forms of atypicality have independent effects on earnings surprises (refer to Table 3). 18 This, we posit, suggests that outside observers compartmentalize their inferences about an organization’s identity. Each stage catalyzes a different cognitive process.
Our bilateral conceptualization of atypicality extends the two-stage model. In doing so, it addresses one of that model’s major shortcomings. Researchers often acknowledge that organizations differentiate along a small subset of features. Yet, they mostly remain vague as to which features are conducive to differentiation and which are important for gaining legitimacy. The few studies that lay out this distinction provide ad hoc and context-specific explanations. Phillips, Turco, and Zuckerman (2013), for example, demonstrated that high-status law firms face disapproval when diversifying into personal injury law but not into family law. It remains unclear why organizations can, in general, successfully differentiate along certain features but not others.
Our analytical approach offers a different way of thinking about the axes along which organizations are expected to conform or stand out. Rather than focusing on organizational features, it points to the different mediums through which organizations communicate their identities: the products and services they offer or their ongoing interactions with outside stakeholders. Our results suggest that these different mediums correspond to two different interpretive dimensions along which analysts evaluate organizations. One relates to the industry an organization competes in, the other to its degree of innovation. This explains how organizations can be simultaneously typical and distinctive. We refer to this theoretical extension as the bilateral model of valuation, and we illustrate it in Figure 6.
The Bilateral Model of Valuation*
The bilateral model rests on two assumptions. First, like the original two-stage model, it assumes that the first stage of valuation precedes the second. Observers evaluate the “how” only after determining the “what.” In fact, our operationalization of performative atypicality assumes that observers first reach a conclusion about a firm’s competitors before they can determine the extent to which it diverges from them performatively. This does not mean, however, that the two types of atypicality are contingent on each other. Our second assumption, therefore, is that the effects of categorical and performative atypicality on audience valuations are independent. Our results are consistent with this assumption.
These results imply that successful organizations can enjoy the differentiating benefits of performative atypicality without necessarily paying the price of categorical atypicality. Consider the two organizations labeled A and B in Figure 6. Both offer conventional products, making them easily classifiable. Existing theory would therefore expect them to be more favorably valued relative to organization C, which is categorically atypical. But these two firms appear differently in the second stage. While firm A stands out as unique, firm B’s interactions with stakeholders are similar to those of its peers. Our findings suggest that analysts will interpret the former as more innovative, leading them to overestimate its future earnings.
Two qualifications are in order. First, because we do not directly measure the cognitive mechanisms connecting atypical performances and negative earnings surprises, we cannot determine with certitude that analysts’ compartmentalized inferences drive this relationship. Yet, the evidence is consistent with such an explanation. In particular, performative atypicality is associated with an increase in disagreement between analysts’ forecasts (refer to Table 2), suggesting that it induces interpretive uncertainty. At the same time, this atypicality is not associated with a decline in earnings (Table B1), suggesting that it is unrelated to firm financial outcomes. Together, these findings suggest that performative atypicality is related to analysts’ perceptions.
Moreover, our finding that analysts are especially optimistic about an organization’s earnings if it performatively emulates perceived innovators is consistent with the contention that performative atypicality catalyzes inferences about the “how” of organizational identity. Our inductive analyses also indicate that the performative atypicality premium is not driven by discussions of firms’ atypical product offerings (as reported in Online Appendix D), alleviating concerns that it is simply a different manifestation of categorical atypicality. Whether consciously or not, analysts appear to interpret performative atypicality as an indication of unique firm capabilities.
Second, the distinction between the categorical and performative mediums of valuation is pronounced in some contexts more than others. Securities analysts arrive in quarterly earnings calls with intimate knowledge of the companies they cover. Their impressions of executives’ performative atypicality are temporally differentiated from their determinations of the firm’s categorical atypicality. In other contexts, however, these inferences occur contemporaneously. A clothing store window, for example, communicates both categorical (what types of clothes it sells) and performative (how unusual the window dressing is relative to other clothing stores) information. The bilateral model of valuation will apply as long as a patron evaluating the window can differentiate categorical and performative features (e.g., between the products on sale and their arrangement). This will result in a performative atypicality premium if the patron prefers uniqueness.
More broadly, this finding implies scope conditions for our theoretical conclusions. The bilateral model of valuation and its resultant performative atypicality premium should generally apply in settings in which two conditions hold. First, the categorical and performative channels of information are distinct, and second, audiences see value in candidates’ unique capabilities. These conditions are more likely to apply, for example, when venture capital firms evaluate relatively late-stage (e.g., series C) funding opportunities than very early-stage opportunities (e.g., seed funding), when there is greater ambiguity about a firm’s products. 19
Distinguishing Categorical and Performative Atypicality in Empirical Work
Thinking about atypicality through our bilateral lens sheds new light on previous empirical findings. In a recent article, for example, Taeuscher, Bouncken, and Pesch (2021) analyzed the success of technology crowdfunding campaigns. Apparently contrary to the expectations of the two-stage valuation model, the authors found that higher levels of distinctiveness are associated with greater, rather than smaller, crowdfunding success. Yet, they measured this distinctiveness as the level of topical divergence between a founding team’s entrepreneurial story and the prototypical entrepreneurship story in the venture’s market category. Although these stories often refer to product features, affecting the venture’s perceived categorical atypicality, they are also inherently performative. It is therefore quite likely that, consistent with the bilateral model of valuation, performative rather than categorical atypicality drives funding success.
More broadly, we conjecture that in practice, research examining the illegitimacy discount has often conflated categorical and performative atypicality. Consider the common focus in the categories literature on the penalty accruing to category-spanning restaurants (Rao, Monin, and Durand, 2005; Goldberg, Hannan, and Kovács, 2016). Menus, for example, are frequently used in this research stream as product descriptions for the purpose of inferring atypicality (e.g., Kovács and Johnson, 2014). Restaurants that include terms typical of different cuisines, such as ciabatta (Italian) and chapati (Indian), are considered atypical by this construction. But menus are also performative. Some minimally list ingredients, whereas others include more evocative descriptions of how these ingredients are, for example, tossed in a homemade secret BBQ sauce. These stylistic choices convey information about the restaurant’s identity above and beyond its cuisine classification. The mere insinuation of customer choice, for example, connotes the restaurant’s lack of culinary sophistication (Jurafsky, 2015).
Our findings suggest that future scholarship should pay greater attention to differentiating the categorical and performative dimensions of atypicality. In settings where these dimensions are experientially distinct, like the one we study here, this task is fairly straightforward. In other settings, however, the same object—a menu, a storefront, or a sales pitch—can simultaneously convey categorical and performative information. Existing literature mostly treats this information as uniform organizational features, aggregating them to measure an organization’s overall level of atypicality. Our findings highlight the importance of distinguishing features that relate to inferences about “what” from those that relate to inferences about “how.” This distinction, we conjecture, will vary as a function of context. In menus, for example, words describing dishes or ingredients will relate to categorical atypicality, while the use of non-culinary terminology will serve a performative role. During a startup pitch, in contrast, categorical information is conveyed in discussions of product features, while performative information is conveyed through speakers’ aesthetic and linguistic choices. Where this distinction exists is where the performative atypicality premium should be more pronounced.
Future research might also explore assumptions about the cognitive mechanisms that connect performative atypicality to a valuation premium. This work should seek to confirm whether the categorical and performative channels affect, respectively, impressions of “what” and “how” as we conjecture and whether these effects are independent. Rather than using valuations as their dependent variables, such investigations will need to employ tools from cognitive science to measure audience members’ interpretations.
Finally, while a voluminous prior literature has demonstrated that categorical atypicality is associated with an illegitimacy discount, we do not find empirical support for that dynamic in our data. Counter to the intuitions of the two-stage valuation model, analysts do not underestimate the future earnings of categorically atypical firms (refer to Table 3). Indeed, recent work has had limited success in replicating Zuckerman’s (1999) original findings (Goldfarb and Yan, 2021) about analysts’ illegitimacy discount. Nevertheless, we hesitate to conclude that categorical nonconformity is inconsequential for analysts’ evaluations. 20 Because our purpose has been to explore the implications of performative atypicality, not the scope conditions for the categorical atypicality discount, we leave a more thorough investigation of this result for future research.
Innovation-Biased Performative Atypicality as Conventional Coolness
Existing literature predominantly conceptualizes atypicality in distributive terms as the magnitude of deviation from normative expectations. Our results, however, suggest that whether performative atypicality is interpreted as a positive signal of firm capabilities depends not only on the degree of atypicality but also on its content. Merely being performatively different translates to a small, mostly insignificant, premium (refer to Table 5). Yet, analysts respond with consistent optimism to atypical performances that conform to conventional understandings of what being innovative looks like.
In other words, to resolve the conflicting demands of conformity and differentiation, it is not enough for firms to limit atypicality to performative channels. Rather, this performative atypicality needs, ironically, to resonate with conventional images of uniqueness. Idiosyncratic departures from normative expectations are not interpreted as signals of competence in their own right. Only when they evoke recognizable scripts of successful heterodoxy are they perceived as indications of quality. Our results suggest that what makes these scripts symbols of quality is not so much their substance as the identities of those who originate them.
This conventional performative atypicality, we conjecture, is not limited to for-profit organizations vying for the attention of investors. We speculate that it emerges in other contexts in which actors need to balance the conflicting demands of conformity and uniqueness. In fact, the innovation-biased performative atypicality that analysts interpret as indicating strategic competence shares strong affinities with the elusive concept of coolness that is pervasive in Western culture (Quartz and Asp, 2016). As Zuckerman (2016) pointed out, nonconformist performances tread a thin line between being interpreted as cool or as incompetent. Our findings suggest that coolness emerges when actors deviate from expectations in ways that connote familiar images of success.
Conclusion
In one of the most memorable scenes in The Life of Brian, British comedy troupe Monty Python’s celebrated religious satire, the protagonist, who is mistaken for the Messiah, tells his thousands of followers that they are all individuals. “We are all individuals!” they respond in unison, with the exception of one screechy voice shouting ‘‘I’m not!” This brilliant comic exchange epitomizes a perennial social conundrum: the conflicting need for individuality and desire to fit in (Brewer, 1991; Chan, Berger, and Van Boven, 2012; Goldberg et al., 2016). Organizations’ ability to balance these dual pressures is a matter of survival. Those that are too unique are dismissed as unintelligible or unappealing, whereas those too conformist struggle to get audiences’ attention.
Dominant theories claim either that successful organizations strike a fine balance between conformity and differentiation or that they are ultimately forced to comply with categorical expectations. These conclusions, we argue, relate to these theories’ unidimensional and static conceptualizations of atypicality. Building on constructivist theories of identity, we propose, in contrast, that organizational members interactionally “do” organizational identity. We analytically distinguish between categorical and performative atypicality and demonstrate that the latter results in a premium in the eyes of external stakeholders. Organizations can meet the need for differentiation performatively while maintaining categorical conformity. Yet, harnessing the forensic affordances of computational linguistics, we also find that to result in positive reactions, performative atypicality needs to heed conventional scripts of being different. Like the lone anonymous dissenter in The Life of Brian, being idiosyncratically different is often greeted with indifference.
Supplemental Material
sj-csv-4-asq-10.1177_00018392231180872 – Supplemental material for Doing Organizational Identity: Earnings Surprises and the Performative Atypicality Premium
Supplemental material, sj-csv-4-asq-10.1177_00018392231180872 for Doing Organizational Identity: Earnings Surprises and the Performative Atypicality Premium by Paul Gouvard, Amir Goldberg and Sameer B. Srivastava in Administrative Science Quarterly
Supplemental Material
sj-do-3-asq-10.1177_00018392231180872 – Supplemental material for Doing Organizational Identity: Earnings Surprises and the Performative Atypicality Premium
Supplemental material, sj-do-3-asq-10.1177_00018392231180872 for Doing Organizational Identity: Earnings Surprises and the Performative Atypicality Premium by Paul Gouvard, Amir Goldberg and Sameer B. Srivastava in Administrative Science Quarterly
Supplemental Material
sj-ipynb-2-asq-10.1177_00018392231180872 – Supplemental material for Doing Organizational Identity: Earnings Surprises and the Performative Atypicality Premium
Supplemental material, sj-ipynb-2-asq-10.1177_00018392231180872 for Doing Organizational Identity: Earnings Surprises and the Performative Atypicality Premium by Paul Gouvard, Amir Goldberg and Sameer B. Srivastava in Administrative Science Quarterly
Supplemental Material
sj-npy-5-asq-10.1177_00018392231180872 – Supplemental material for Doing Organizational Identity: Earnings Surprises and the Performative Atypicality Premium
Supplemental material, sj-npy-5-asq-10.1177_00018392231180872 for Doing Organizational Identity: Earnings Surprises and the Performative Atypicality Premium by Paul Gouvard, Amir Goldberg and Sameer B. Srivastava in Administrative Science Quarterly
Supplemental Material
sj-npy-6-asq-10.1177_00018392231180872 – Supplemental material for Doing Organizational Identity: Earnings Surprises and the Performative Atypicality Premium
Supplemental material, sj-npy-6-asq-10.1177_00018392231180872 for Doing Organizational Identity: Earnings Surprises and the Performative Atypicality Premium by Paul Gouvard, Amir Goldberg and Sameer B. Srivastava in Administrative Science Quarterly
Supplemental Material
sj-pdf-1-asq-10.1177_00018392231180872 – Supplemental material for Doing Organizational Identity: Earnings Surprises and the Performative Atypicality Premium
Supplemental material, sj-pdf-1-asq-10.1177_00018392231180872 for Doing Organizational Identity: Earnings Surprises and the Performative Atypicality Premium by Paul Gouvard, Amir Goldberg and Sameer B. Srivastava in Administrative Science Quarterly
Supplemental Material
sj-txt-7-asq-10.1177_00018392231180872 – Supplemental material for Doing Organizational Identity: Earnings Surprises and the Performative Atypicality Premium
Supplemental material, sj-txt-7-asq-10.1177_00018392231180872 for Doing Organizational Identity: Earnings Surprises and the Performative Atypicality Premium by Paul Gouvard, Amir Goldberg and Sameer B. Srivastava in Administrative Science Quarterly
Supplemental Material
sj-7z-8-asq-10.1177_00018392231180872 – Supplemental material for Doing Organizational Identity: Earnings Surprises and the Performative Atypicality Premium
Supplemental material, sj-7z-8-asq-10.1177_00018392231180872 for Doing Organizational Identity: Earnings Surprises and the Performative Atypicality Premium by Paul Gouvard, Amir Goldberg and Sameer B. Srivastava in Administrative Science Quarterly
Footnotes
Acknowledgements
We thank participants of the Duke University Fuqua School of Business Finance Seminar, the Uppsala University OT Seminar, the Berkeley Culture Conference, the Berkeley Haas Marketing Group Seminar, the Berkeley Open Innovation Seminar, the Yale Computational Social Science Seminar, the Nagymaros Conference, the AOM 2022 Symposium on New Frontiers of Organizational Culture Research, and the Harvard Values and Valuation Conference for helpful comments and feedback. The usual disclaimer applies.
1
Target was not the first or only retailer to do so. Other large American retailers began combining groceries and non-food items in the late 1980s. Yet, these mixed retail spaces were limited to superstores.
2
Organizational scholars have used the term “identity” in various ways. Many use the term to refer to the ways in which members of an organization understand the organization’s core and enduring attributes (e.g., Gioia, 1998; Whetten, 2006). We focus, in contrast, on perceptions of external audiences (Hsu and Hannan, 2005). We define identity as the various meanings that outside observers typically associate with an organization. Our theoretical focus also stands in contrast to the concept of organizational image, which is commonly conceived as the ways by which organizational members imagine that outside stakeholders view their organization (Gioia, Schultz, and Corley, 2000).
3
A related literature on organizational impression management has also emphasized external stakeholders’ perceptions. That work often focuses on the purposeful actions that organizational leaders take in order to influence their status and approval in the eyes of outside audiences (Highhouse, Brooks, and Gregarus, 2009). Our approach, instead, focuses on the interactional ways by which these impressions are formed, emphasizing the role of typicality or lack thereof in shaping these impressions.
5
In fact, in some cases the “what” and “how” are inherently intertwined. The handmade processes used by a craft chocolatier, for example, are integral to the product’s value proposition.
7
8
The results reported below are robust to an alternative construction of this variable whereby peer firms are determined on the basis of their two-digit SIC classification.
9
10
In unreported models, we also include a dummy variable for past negative earnings surprise. Our results are robust to this specification, which we do not report for the sake of brevity.
11
Note, moreover, that the raw correlation between the two variables, as reported in ![]() , is misleadingly high. This correlation is mechanically driven by the number of analysts covering a firm, which affects both the call’s length and the number of estimates produced by analysts. These two latter variables, the call’s length and number of estimates produced by analysts, are negatively correlated with performative and categorical atypicality, respectively. Consequently, the correlation between performative and categorical atypicality drops from 0.156 to 0.035 once they are adjusted for call length and number of estimates.
, is misleadingly high. This correlation is mechanically driven by the number of analysts covering a firm, which affects both the call’s length and the number of estimates produced by analysts. These two latter variables, the call’s length and number of estimates produced by analysts, are negatively correlated with performative and categorical atypicality, respectively. Consequently, the correlation between performative and categorical atypicality drops from 0.156 to 0.035 once they are adjusted for call length and number of estimates.
12
Specifically, we test between-firm models of the form:
where Yf,q+1 is our dependent variable for firm f in quarter-year q+1, PAf,q is performative atypicality for firm f in quarter q, CAf,q is categorical atypicality for firm f in quarter q, Xf,q+1 is a vector of controls for firm f in quarter q+1, Zf,q is a vector of controls for firm f in quarter q, αi,f,q is the fixed-effect for i, the industry of firm f, in quarter q, and uf,q is the error term. We do not include quarter fixed effects as that would absorb too much variation.
13
Specifically, we test within-firm models of the form:
where Yf,q+1 is our dependent variable for firm f in quarter-year q+1, PAf,q is performative atypicality for firm f in quarter q, CAf,q is categorical atypicality for firm f in quarter q, Xf,q+1 is a vector of controls for firm f in quarter q+1, Zf,q is a vector of controls for firm f in quarter q, αf is the fixed-effect for firm f,
14
These results are robust to dividing performative atypicality into deciles.
15
We do not, however, find evidence for such a market discount. In additional analyses, we do not find that categorical atypicality is significantly associated with lower median estimates, lower earnings, or lower returns on assets.
18
In additional analyses, we do not find evidence for an interaction effect between categorical and performative atypicality in producing the performative atypicality premium.
19
This would also suggest that audience members with different perspectives of the same organization might reach divergent conclusions about its appeal.
20
We hesitate for two reasons. First, while previous research predominantly explored the relationship between categorical atypicality and market returns, our analysis focuses on earnings forecasts. Second, consistent with prior work, we operationalize categorical atypicality as the inverse of the mean overlap in analyst coverage. This measure is one step removed from categorical atypicality in that it relates to analysts’ perceptions of atypicality rather than objective atypicality per se. We also constructed an alternative measure of categorical atypicality by using the TNIC (Hoberg and Phillips, 2016). We operationalize a firm’s categorical atypicality as its weighted clustering coefficient in the product similarity network. The analyst overlap and TNIC-based measures of categorical atypicality are weakly (<0.09 in all specifications) but significantly correlated. This alternative operationalization is also insignificantly associated with earnings surprises. Moreover, the relationship between performative atypicality and negative earnings surprise is robust to this implementation.