
Abstract
Survey respondents overestimate, on average, the number of immigrants living in their country. This phenomenon, known as immigration innumeracy, seems incompatible with the wisdom-of-crowds effect, which suggests that large samples of individuals should, as a collectivity, be good at estimating such figures. However, this article reveals that crowd wisdom does emerge in a previously overlooked subgroup: non-rounding respondents. Drawing on German and European survey data, it is shown that when round estimates (5, 10, 15, …) are excluded, a subset of “wise” non-rounding respondents remains, who collectively estimate the share of foreigners in their country with astounding precision. Thus, a relevant—and easily identifiable—part of the population is actually collectively immigration numerate. Two potential mechanisms behind this emergent phenomenon are explored. First, regression models reveal that non-rounders are more educated and politically interested than rounders, indicating more informed guesses. Second, simulations show that the coarse-grained nature of round numbers itself can contribute to inaccurate estimates. Using round numbers is thus associated with uncertainty, resulting in biased estimates. Taking the crowd wisdom of non-rounding respondents into account qualifies the extent of immigration innumeracy and improves our understanding of a phenomenon that is often seen as a root cause of xenophobia.
Introduction
What do you think is the percentage of foreign-born people in your country? Please take a moment to think of an answer. If you are like most people, you may have guessed something like 10%, 20%, or perhaps 25%. Most people use round numbers such as these when guessing—and they collectively overestimate the share of migrants. However, some people use non-round numbers (8%, 12%, etc.) and they—as a group—produce surprisingly accurate immigration estimates, as this article will show.
Laypersons are regularly confronted with important estimation tasks in their everyday lives. For example, faced with a viral threat, they have to estimate health risks when engaging in social interaction. In light of the climate crisis, they need to estimate the environmental costs of their behavior. Ever more often, this requires handling numbers, from COVID-19 incidence rates to CO2 footprints. However, humans frequently face difficulties in such estimation tasks. For example, they underestimate pandemic risk (McColl et al., 2022) and social inequality (Hauser and Norton, 2017). A better understanding of the structure and mechanisms behind such miscalculations is essential for tackling some of the most pressing societal problems of our time, where success depends heavily on the active participation of the general population.
Apart from macro-structural factors (e.g., the spread of misinformation) and personal ideological biases, our limited ability to process information (Tversky and Kahneman, 1974) is a central problem in such estimation tasks. Numbers are particularly hard to process for humans, a phenomenon known as innumeracy (Paulos, 1988). An interesting case of innumeracy arises with regard to immigration estimates. Past research has shown that survey respondents consistently overestimate, on average, the share of immigrants in their country (Sides and Citrin, 2007; Herda, 2010; Duffy, 2018: 97). This phenomenon, known as immigration innumeracy, is important because it offers an explanation for the prevalence of anti-immigrant sentiment and the success of right-wing populism: People feel threatened because they perceive the outgroup of foreigners in their society as larger than it actually is (Alba et al., 2005; Nadeau et al., 1993; Semyonov et al., 2004). So far, however, it has not been considered that the existence of immigration innumeracy is puzzling in that it seems to contradict the wisdom-of-crowds effect, which suggests that large samples of individuals should actually be good, on average, at estimating such figures (Condorcet, 1785; Galton, 1907; Page and Shapiro, 1992; Surowiecki, 2005).
The classic example for the emergence of crowd wisdom is a competition that took place at a fair in Plymouth in 1906 where people had to guess the weight of an ox. Francis Galton, who visited the fair, was skeptical of the abilities of the masses and surprised when he found in his statistical analyses of the 787 guesses by the local population that on average, they estimated the weight of the Ox correctly (Galton, 1907; Surowiecki, 2005: xi‒xiii). The reason behind this fascinating phenomenon of “collective intelligence” is that while individual guesses can be off to either side, these deviations cancel each other out when the quantity of estimates is large enough. As Surowiecki put it in his book The Wisdom of Crowds: under the right circumstances, groups are remarkably intelligent, and are often smarter than the smartest people in them. Groups do not need to be dominated by exceptionally intelligent people in order to be smart. Even if most of the people within a group are not especially well-informed or rational, it can still reach a collectively wise decision. This is a good thing, since human beings are not perfectly designed decision makers. (Surowiecki, 2005: xiii‒xiv)
Crowd wisdom can emerge—and be used to derive better judgements—in many different contexts, from political and economic forecasting to the evaluation of nuclear safety, the rise of sea levels, and the quality of chemical probes to medical decisions and general knowledge tests (Bamber and Aspinall, 2013; Budescu and Chen, 2015; Galesic et al., 2018; Morgan, 2014; Oprea et al., 2009; Prelic et al., 2017). Some researchers have even described crowd wisdom as “highly robust” (Davis-Stober et al., 2014). What then could explain the suppression of crowd wisdom in the case of immigration estimates?
Several conditions have to be fulfilled for crowd wisdom to emerge: Estimators need to (a) have some information about the issue, (b) be motivated to give an accurate answer, and (c) make somewhat independent judgements and not be systematically biased (Goldstein et al., 2014). In addition, (d) there needs to be a diversity of viewpoints with people bringing in local knowledge (Surowiecki, 2005: 10). Condition (a) is clearly fulfilled since all survey respondents participate in society at large and thus should have at least some information about the share of foreigners. They also clearly bring in different perspectives, drawing on the knowledge in their immediate surroundings, which differ from person to person, fulfilling condition (d). Conditions (b) and (c) are a bit trickier: For one thing, social influence can undermine the wisdom of crowds (Golub and Jackson, 2010; Lorenz et al., 2011; Frey and Van de Rijt, 2021). 1 The media, for example, could have a common influence on many respondents (Czymara and Dochow, 2018; Pavía et al., 2019), hampering independent estimations by individuals. Misinformation (and confidence about it) can have distortive effects (Kuklinski et al., 2000). Furthermore, politicized emotions could stop respondents from making accurate estimates (Surowiecki, 2005). Immigration is obviously a highly politicized, polarizing, and contentious topic (e.g., Deutschmann, 2025), making it potentially susceptible to these detrimental factors. 2 Lutz and Bitschnau (2023) have indeed identified the protection of group identity, the defense of self-interest, and security concerns as factors that can distort the perception of immigration. There are thus plausible arguments for the non-occurrence of crowd wisdom in this case. But is there really no “collective intelligence” at all when it comes to estimating the share of immigrants?
Previous studies have predominantly focused on individual response patterns, examining which share of interviewees gives an estimate close enough to the true value—for example, within a deviation of one (or five) percentage point(s)—and how many respondents over- or underestimate it (Herda, 2010, 2013). Past research has also found that some groups (e.g., ethnic minorities and conservatives) overestimate the share of immigrants more and that in the USA, the estimated share of immigrants has increased faster than the actual share (Herda, 2019).
The article at hand offers an alternative perspective by providing evidence that a relevant share of respondents collectively estimates the share of foreigners in their country correctly, in line with the wisdom-of-crowds effect. To do that, it differentiates between rounding and non-rounding respondents and argues that the usage of round numbers (i.e., numbers that end with the digits “0” or “5”) is a sign of uncertainty. It then demonstrates, based on ALLBUS survey data from Germany, that when respondents who round are excluded from the analysis, the remaining sample of non-rounding respondents is collectively capable of estimating the share of foreigners in their country with astounding precision. Thus, there is actually a “wise crowd” of non-rounders that usually remains hidden among the overall sample. Reversely, those respondents who do collectively overestimate the share of foreigners (who are thus, as a group, immigration innumerate), all have in common that they round. This suggests that immigration innumeracy could be driven by uncertainty about the correct answer rather than a conviction that the share of foreigners is really higher than it actually is. What is more, we will demonstrate that rounding is not just a sign of uncertainty, but also a source of uncertainty in itself. These findings have implications for the explanation of anti-immigrant sentiment and right-wing populism, and potentially also for other estimation and prediction tasks, as will be discussed toward the end of the article.
Before that, the following sections subsequently present the state of research regarding the human preference for round numbers, the research design, the analysis, and two mechanisms behind the emergence of crowd wisdom among non-rounders. Overall, the article contributes to our understanding of immigration innumeracy, the wisdom of crowds, the role of round numbers in estimation tasks, as well as human behavior under uncertainty.
The human preference for round numbers
The human tendency to disproportionally use round numbers can be called “terminal digit preference” (Hayes, 2008), “response heaping” (Holbrook et al., 2014) or rounding bias. This rounding bias can be observed in many situations. For example, consumers prefer round prices, baseball players round batting averages, and Scholastic Assessment Test (SAT) takers round test scores (Pope and Simonsohn, 2011; Lynn et al., 2013). Yet the mechanisms behind rounding are complex. In real-estate markets, for example, precise, non-round values for offers appear to trigger more fine-grained pricing scales among market participants, which leads to lower counteroffers compared to round offers (Leib et al., 2021). In some cases, rounding may simply occur due to the aesthetical appeal of round numbers or the fact that they are easier to cognitively process (Nguyen et al., 2022); but often—and especially in estimation tasks—the choice of round numbers is clearly related to uncertainty. This will become evident in the subsequent analyses but is also apparent from past research: For instance, accounting research finds that analysts who round earnings-per-share forecasts are less informed, make less effort, and have fewer resources (Herrmann and Thomas, 2005). Demographic research on age reporting in censuses shows that ages ending with “0” and “5” are overrepresented due to biased guessing behavior on the part of census enumerators in situations where exact information on age is scarce—which is often the case in low-income countries (Lee and Zhang, 2017).
This rounding bias can have a negative impact on the reliability of all kinds of information, from quantitative surveys to administrative and digital-trace data. In survey research, the rounding bias occurs when interviewees who are asked to respond on a continuous, numbered scale have a greater-than-expected 3 tendency to pick round numbers. For example, when asked about the count of lifetime sexual partners, round numbers (e.g., “10,” “15,” “20”) are given disproportionally often, resulting in an odd distribution of responses that may lead to biased conclusions when used without caution (Tourangeau et al., 2000: 233). The rounding bias can also be a problem for the reliability of medical data, for example, when pathologists record prognostic data (such as tumor sizes) using round approximations (Hayes, 2008). On the flip side, knowing about the rounding bias can prove quite useful. For example, Khakhalin (2020) demonstrated that the disproportionate appearance of round numbers in reported turnout and votes indicates fraud in the 2020 Russian constitutional referendum. Newman (2020) suggested that the famous “blue zones,” that is, local concentrations of centenarians, could partly be the outcome of “fraud and error” because of a disproportionate amount of birth dates divisible by five. Finally, Recchi et al. (2021) showed that overcharging by a private company that sells travel visas can be spotted due to the excess occurrence of round surcharge rates. Thus, even where people have a self-interest in disguising it, they often appear unable to avoid the conspicuous use of round numbers.
Survey research aims at capturing the attitudes, knowledge, and characteristics of individuals and social groups as adequately as possible. Yet, thus far, insufficient attention has been paid to the question of how and why the rounding bias affects respondents’ behavior in survey situations. In specific, relatively little is known about (a) the social structure of rounding, (b) the mechanisms driving rounding, and (c) the consequences of rounding. One important pioneering study was Alba et al. (2005), which discovered excess occurrences of round estimates of ethnic minority group sizes in the USA (even showing a tripartite histogram very similar to the ones we have provided below in Figures 1 and 2) and concluded that “there are patterns in the way respondents express themselves in numbers that would appear to inflate minority group sizes” (Alba et al., 2005: 902). However, it did not examine this rounding behavior or the emergence of numeracy among non-rounders further. The objective of this article is to contribute to filling this gap by exploring the social structure, mechanisms, and consequences of rounding in the case of immigration innumeracy.
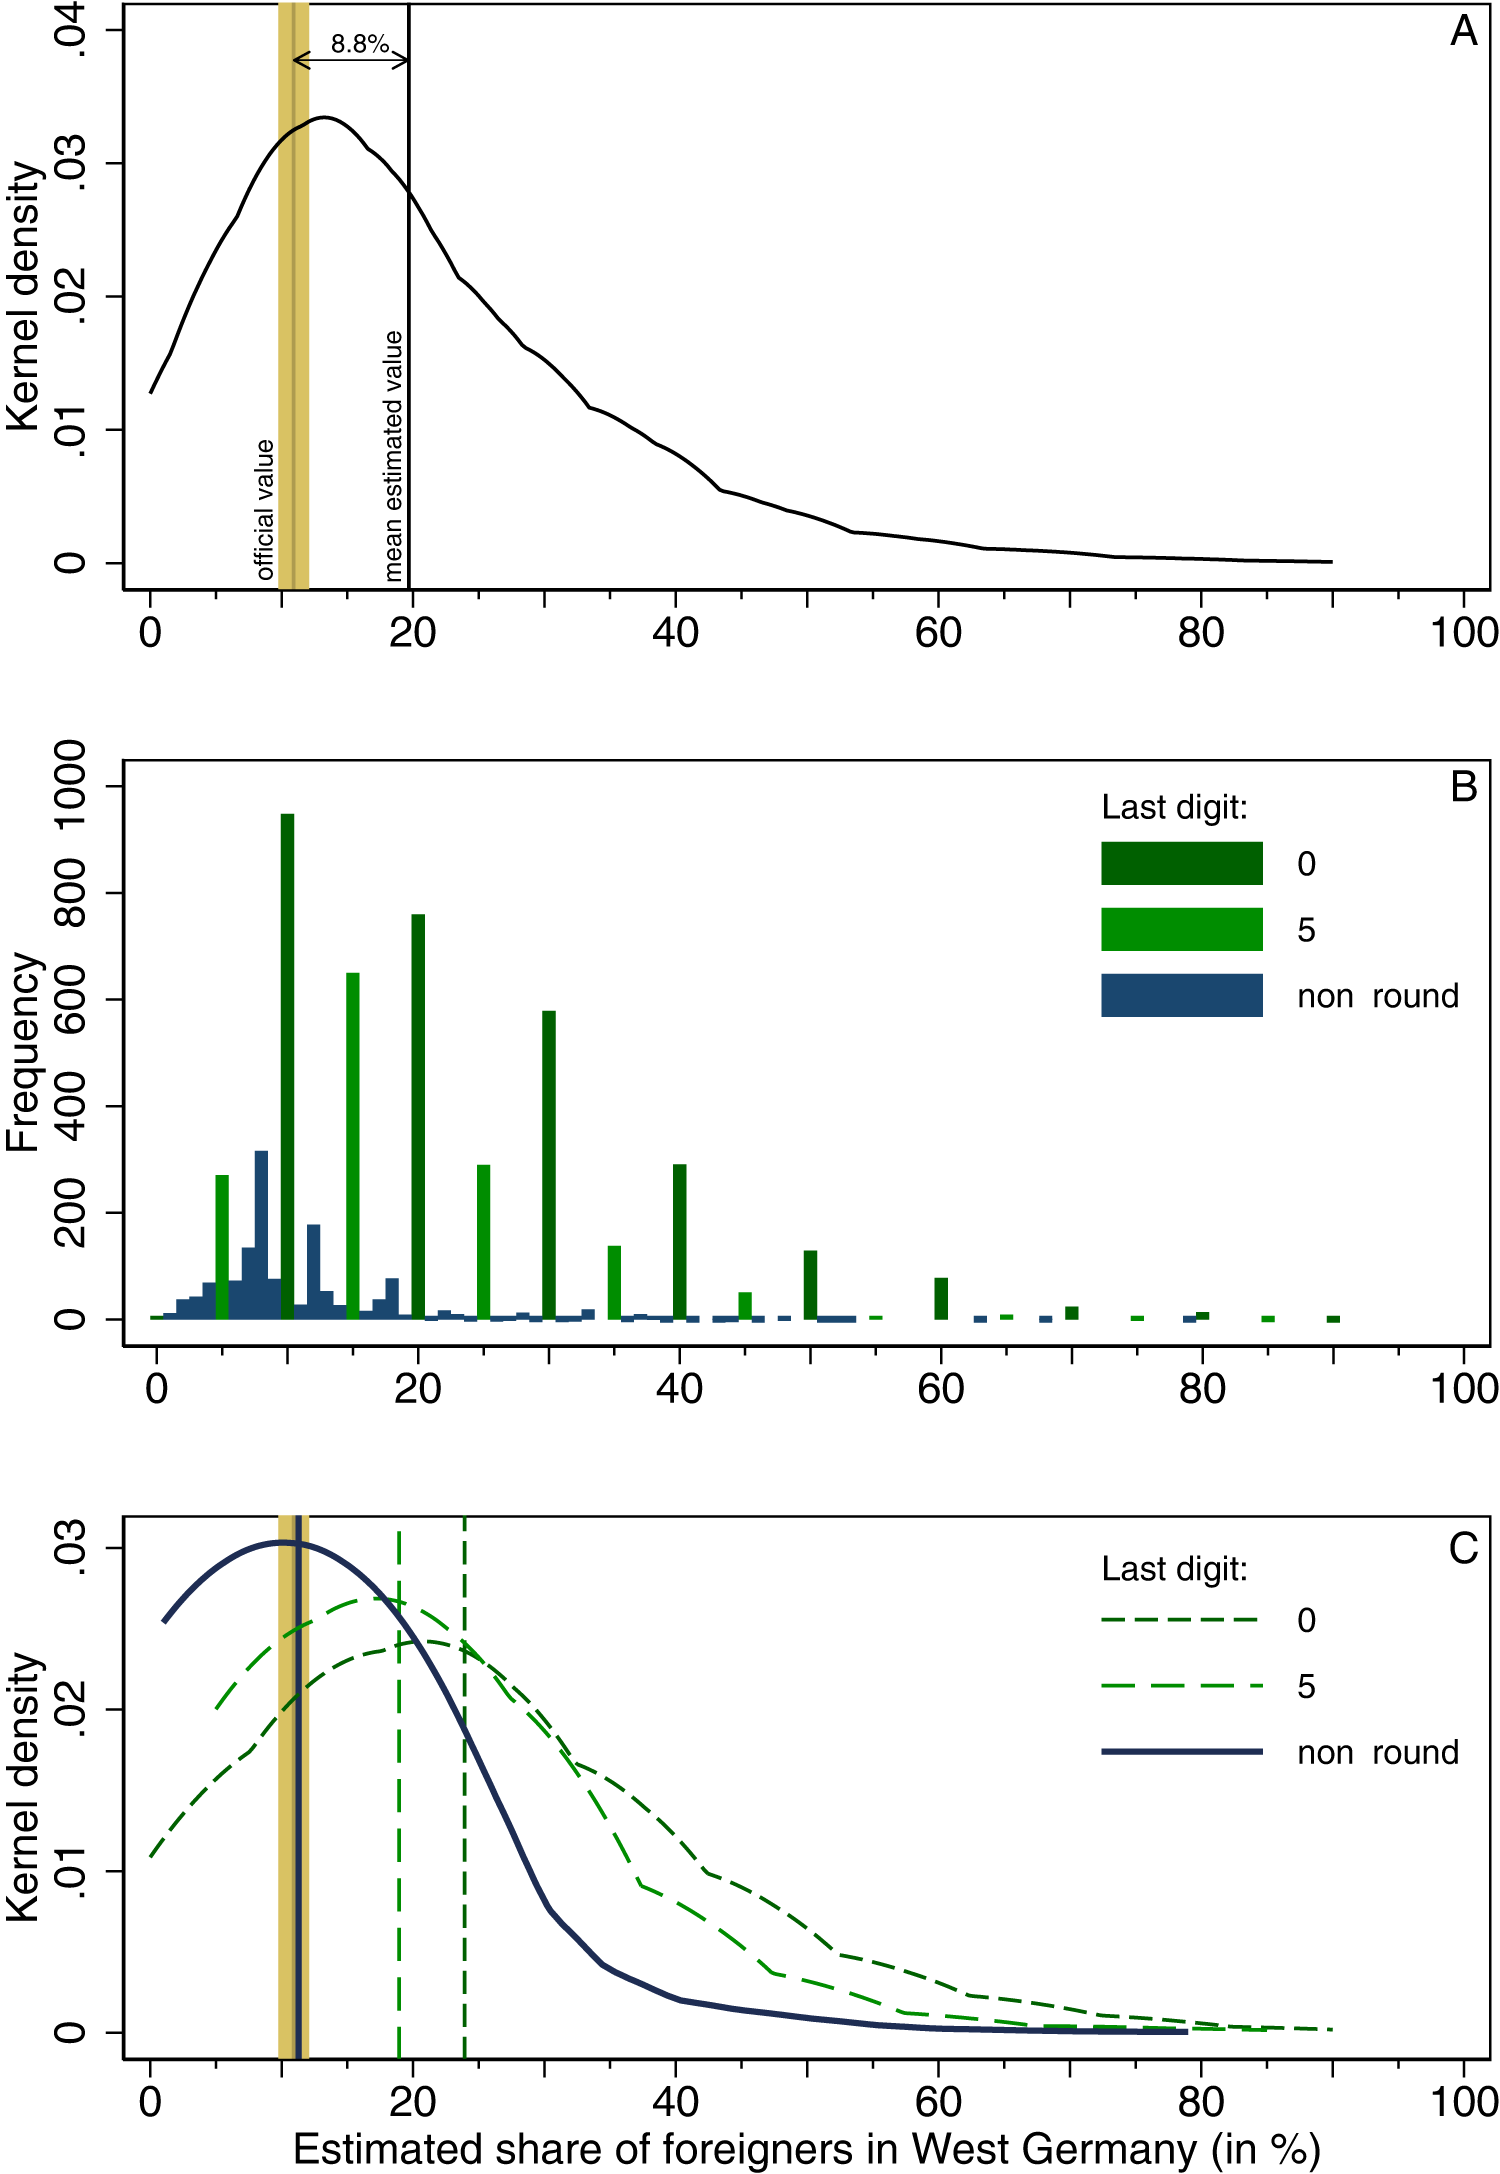
Response patterns for West Germany by West Germans.
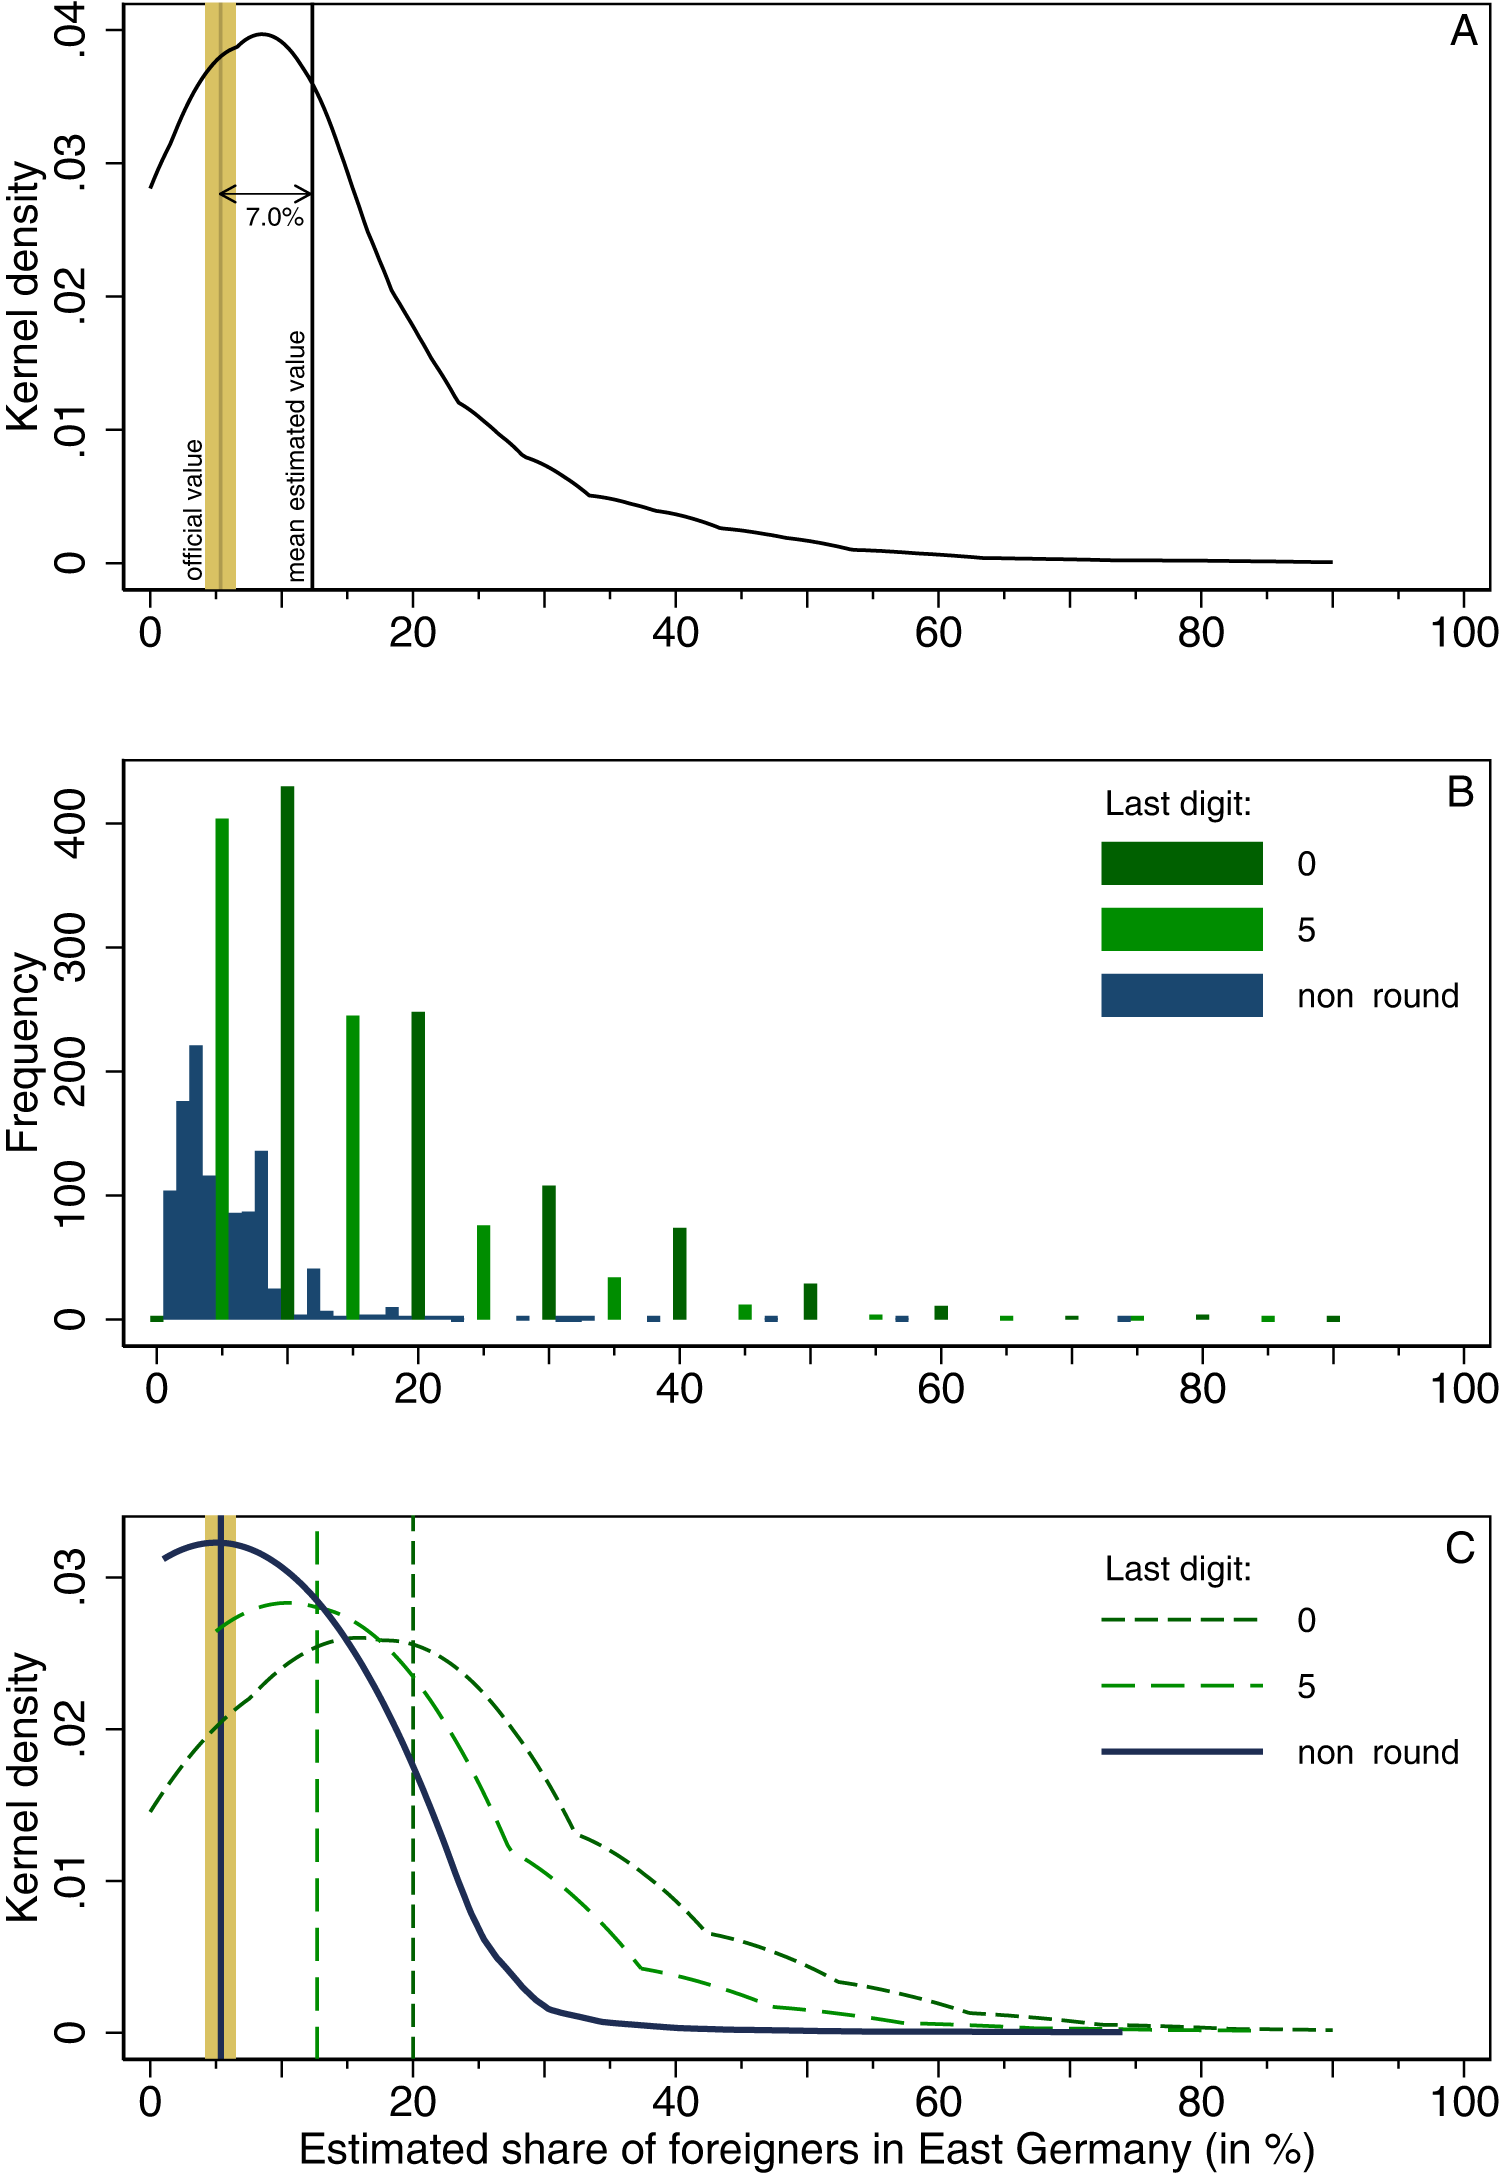
Response patterns for East Germany by East Germans.
Research design
We mainly use data from the German General Social Survey (ALLBUS), a yearly survey that has been carried out continuously since 1980 and is representative of the resident adult population in Germany,
4
with approx. 3500 respondents per year. Here, we draw on the 1996, 2006, and 2016 waves, which contained the following items:
“What do you think is the percentage of foreigners in Western Germany?” (mp13); “And in Eastern Germany?” (mp14).
5
While all respondents were asked both questions, we will report below how West German respondents estimated the share of foreigners in West Germany, and how East Germans estimated the share of foreigners in East Germany. This decision is based on the first precondition for crowd wisdom outlined above, which states that some information about the issue in question is necessary, and those living within a region typically have more knowledge about it than outsiders. ALLBUS oversamples the smaller region, East Germany, which is useful for our purposes, since we are interested in having a large enough “crowd” in both subsamples.
6
Only whole numbers were recorded as estimates. About one fifth of all respondents stated they “don’t know” or refused to answer (20.9% in the West; 19.7% in the East). In this study, we ignore this group
7
and focus exclusively on those respondents who did provide an estimate. Among these, we differentiate between three groups:
Strong rounders, whose estimate ends in “0” (0, 10, 20, 30, …) Weak rounders, whose estimate ends in “5” (5, 15, 25, 35, …) Non-rounders, whose estimate ends in any of the remaining digits (1, 2, 3, 4, 6, 7, …)
We compare their estimates to the “actual” share of foreigners as calculated by the German Federal Statistical Office (Destatis, 2007, 2019), henceforth “official value.” Since the official value may itself be ambiguous
8
and deviate from the true value (which is, of course, unknown), some leeway is necessary for such comparisons. Following Herda (2013), we consider a value accurate in the strict sense when it is within a one percentage-point proximity to the official value, and additionally consider a five percentage-point difference as a more generous accuracy threshold. The longitudinal nature of the data is used here only to increase the number of observations (with the aim of having a sample that is large enough to facilitate the emergence of crowd wisdom even in smaller subgroups). In the main analyses, the three waves are analyzed jointly (the West German sample contains 5555 observations, the East German one 2733). To take into account that the actual share of foreigners varies over time, we calculated the mean official value across all three time points, weighting each of the three official values by the exact number of respondents in the corresponding wave who made a guess. The resulting composite official value is the one that the overall sample should be aspiring to be close to. In West Germany, the official share of foreigners was 10.4%, 9.9%, and 12.2% in 1996,
9
2006, and 2016, respectively, and taking into account the number of respondents per wave, the weighted official value across all three waves is 10.9%. The respective numbers for East Germany are 3.8%, 4.7%, and 6.9%, resulting in a weighted average of 5.4%. An additional analysis of the three waves separately is available in the Supplementary Material.
Regarding the first proposed mechanism (the role of respondents’ characteristics), logistic regression models are used to detect how education, political orientation, political interest, age, gender, citizenship, xenophobic attitudes, contact with foreigners, and the share of foreigners in the district affect the probability of using non-round estimates as opposed to using round estimates. Education refers to the highest level of education, differentiating between “primary or less,” “secondary,” and “tertiary.” Political orientation is originally on a 10-point scale and recoded into three groups: “left” (1–4), “center” (5–6), and “right” (7–10). Political interest is on a five-point scale running from “very strong” to “not at all,” and included in the model as a categorical variable. Age is added as a continuous variable with ages ranging from 18 to 97. Gender is binary in this survey with 1 indicating “female,” and 0 indicating “male.” German citizenship is also dichotomous, with 1 indicating “yes.” Xenophobic attitudes and personal contact with foreigners are measured by two indices created via exploratory factor analysis from six and four individual items, respectively (cf. Supplementary Material for details). 10 The share of foreigners in the respondent's district (“Landkreis,” which corresponds to a NUTS-3 administrative unit in the EU, or a county in the USA) contains 14 categories running from “under 2%,” “2 to under 4%,” “4 to under 6%,” …, until “30 to under 32%.” For simplicity, this variable is included as a continuous variable in the model.
To corroborate the second proposed mechanism, which states that the structure of the task and the location of the true value on the spectrum from 0% to 100% could be an explanatory factor in itself, we run a series of simulations. Specifically, we create 101 simulated datasets with 10,000 integer observations each. The observations are drawn as a sample from a normal distribution with a standard deviation of five. 11 The form of a normal distribution was chosen based on the assumption that a simple case of crowd wisdom occurs when the estimates cluster around a center value (the “true” value) with similar amounts of estimates on either side of it. 12 The center of the normal distribution shifts in the simulated data. It is 0 in the first dataset, 1 in the second, 2 in the third, and so on until it is 100 in the last dataset. Values ≤ 0 and ≥ 100 are dropped since the task is about estimating a percentage share. The values 0 and 100 are dropped assuming that they would be considered unlikely by any participant in a realistic estimation task (e.g., both “no foreigners at all” and “exclusively foreigners in the country” are unrealistic options). The observations in each dataset are then again divided into three groups: strong rounders (whose estimates end with the digit “0”), all rounders (whose estimates are divisible by “5”), and non-rounders (everyone else). In addition, we consider the full sample, which contains all drawn round and non-round numbers (which means that round values occur in “natural” quantities), and a “biased sample,” which contains an elevated share of round estimates (50% strong rounders and 25% weak rounders, which corresponds roughly to the real-world situation of the West-German ALLBUS sample). 13 We then examine how the mean estimate in each group deviates from the “true” center of the normal distribution. The simulation thus allows us to examine (a) how the position of the true value (i.e., the center of the normal distribution) on the percentage scale affects the likelihood of the crowd (i.e., the normally distributed sample) being collectively wise, and (b) whether round estimates tend to be further away from the true value than non-round numbers regardless of any real-world influences such as the topic of the estimation task or the characteristics and biases of respondents.
As a robustness check, the Supplementary Material provides evidence that the emergence of crowd wisdom among non-rounding respondents can be replicated in other countries with alternative datasets and item formulations. This additional analysis is based on European Social Survey (ESS) data from 2002, covering 21 European countries. Here, the item is phrased as: “Out of every 100 people living in [country], how many do you think were born outside [country]?.” The official value was calculated by combining the “stock of foreign-born population by country of birth” from the OECD's International Migration Database with population data from the World Bank. All analyses were conducted in Stata 18.
Analysis
We begin with a look at the overall distributions of estimates and the deviation of their mean from the official share of foreigners in West and East Germany (Figures 1A and 2A, respectively). As a reminder: In West Germany, the official share of foreigners across the three years under study (weighted by the number of respondents from each year) is 10.9%, while in East Germany it is 5.4%. The overall estimations significantly deviate from these numbers. For West Germany, respondents on average estimated the share of foreigners to be 19.7%, which amounts to an overestimation by 8.8 percentage points, or 80.3%. For East Germany, respondents estimated the share of foreigners to be 12.3%, an overestimation by 7.0 percentage points, or 130.7%. Another way of looking at this is that 68.4% of West German respondents who provided an estimate of the share of foreigners in West Germany chose a number higher than the actual one. For East Germany, this value is even higher, with 71.7% of respondents giving an estimate above the true value. So far, these results are in line with previous research, which showed that immigration innumeracy is a common phenomenon in Germany as in other countries. If anything, the overestimations found here are even higher than the ones previously reported. 14
However, the picture changes once we dissect the distributions of estimates and depict them as a hundred discrete bars, one per percentage point, instead of a smoothed line (Figures 1B and 2B). It now becomes apparent that the distributions contain a clearly discernable series of non-random peaks that occur when a digit ends in “0” or “5.” Overall, 76.6% (West Germany, 61.8 for East Germany) of respondents who give an estimate provide a round value, which is, of course, far above the expectation of 20% under random conditions. 15 There is thus clear evidence for a rounding bias. The preference for very round numbers (ending in “0”) is even higher than the preference for less round numbers (ending in “5”). In fact, there visually appear to be three separate distributions: one for “strong rounders” (dark green), one for “weak rounders” (light green), and one for “non-rounders” (blue). These three distributions have different means (Figures 1C and 2C). Strong rounders heavily overestimate the share of foreigners (by 13.0 percentage points in West Germany and 14.7 percentage points in East Germany). Weak rounders also overestimate (by 8.0 percentage points in the West and 7.4 percentage points in the East), but less so than strong rounders. Non-rounders, however, on average estimate the share to be 11.29% in the West and 5.38% in the East. Hence, in both cases, the deviation from the official value is less than one percentage point (0.37 percentage points in the West, and a mere 0.03 percentage points in the East), the most rigorous threshold for a correct estimation. Non-rounders thus appear collectively able to pinpoint the share of foreigners in their country correctly, in line with the wisdom-of-crowds effect.
Note that this is a phenomenon of crowd wisdom, not personal wisdom. It is not the case that each of the non-rounding respondents picks the correct value individually (e.g., because they would know exactly what it is). Rather, non-rounders are spread around the correct value in a way that makes their average guess quite accurate. While the standard deviation in the distribution of non-rounders (West: 8.1 percentage points, East: 5.2) is smaller than the one of strong rounders (West: 14.4, East: 13.0) and weak rounders (West: 11.7, East: 10.9), it is still considerable. The wisdom thus only arises at the macro level—a fascinating phenomenon that we could dub emergent numeracy. But why does it occur?
Potential explanations
What explains the emergent numeracy among non-rounders in contrast to the collective overestimation by rounders? Here, we explore two potential mechanisms. One is based on different characteristics of rounding and non-rounding respondents. The other one is based on the structure of the estimation task itself, specifically the location of the true value on the continuum of possible values (in this case 0% to 100%) and the coarse-grained nature of round numbers.
The respondents-based mechanism
The first mechanism is based on the straightforward argument that non-rounders are different from rounders in that they are better informed and more interested in the topic and in giving an adequate answer. Table 1 shows that this respondents-based explanation has some merit. The underlying logistic regression models reveal that compared to rounders, non-rounders are better educated and more interested in political matters. It thus seems plausible that they are making more informed guesses, even if many of them do not know the exact value in question. Non-rounders are also more left-leaning politically, which might be connected with a wish to pinpoint the correct estimate of the share of foreigners compared to a right-winger likely having no problem with an overestimation through an excessive round guess that could confirm their stereotype of immigration being too high. 16 Non-rounders also tend to be older (fitting the popular equation of “old and wise”) and more likely men than women. Past research has found that men have a higher propensity to guess in surveys about political knowledge (Mondak and Anderson, 2004). Our finding suggests that men also have a stronger tendency to guess using non-round numbers. No significant effects were found for having German citizenship (only available in models 1 and 3 since items that are added in models 2 and 4 were only presented to respondents with German citizenship).
Logistic regression predicting being a non-rounder as opposed to being a rounder.
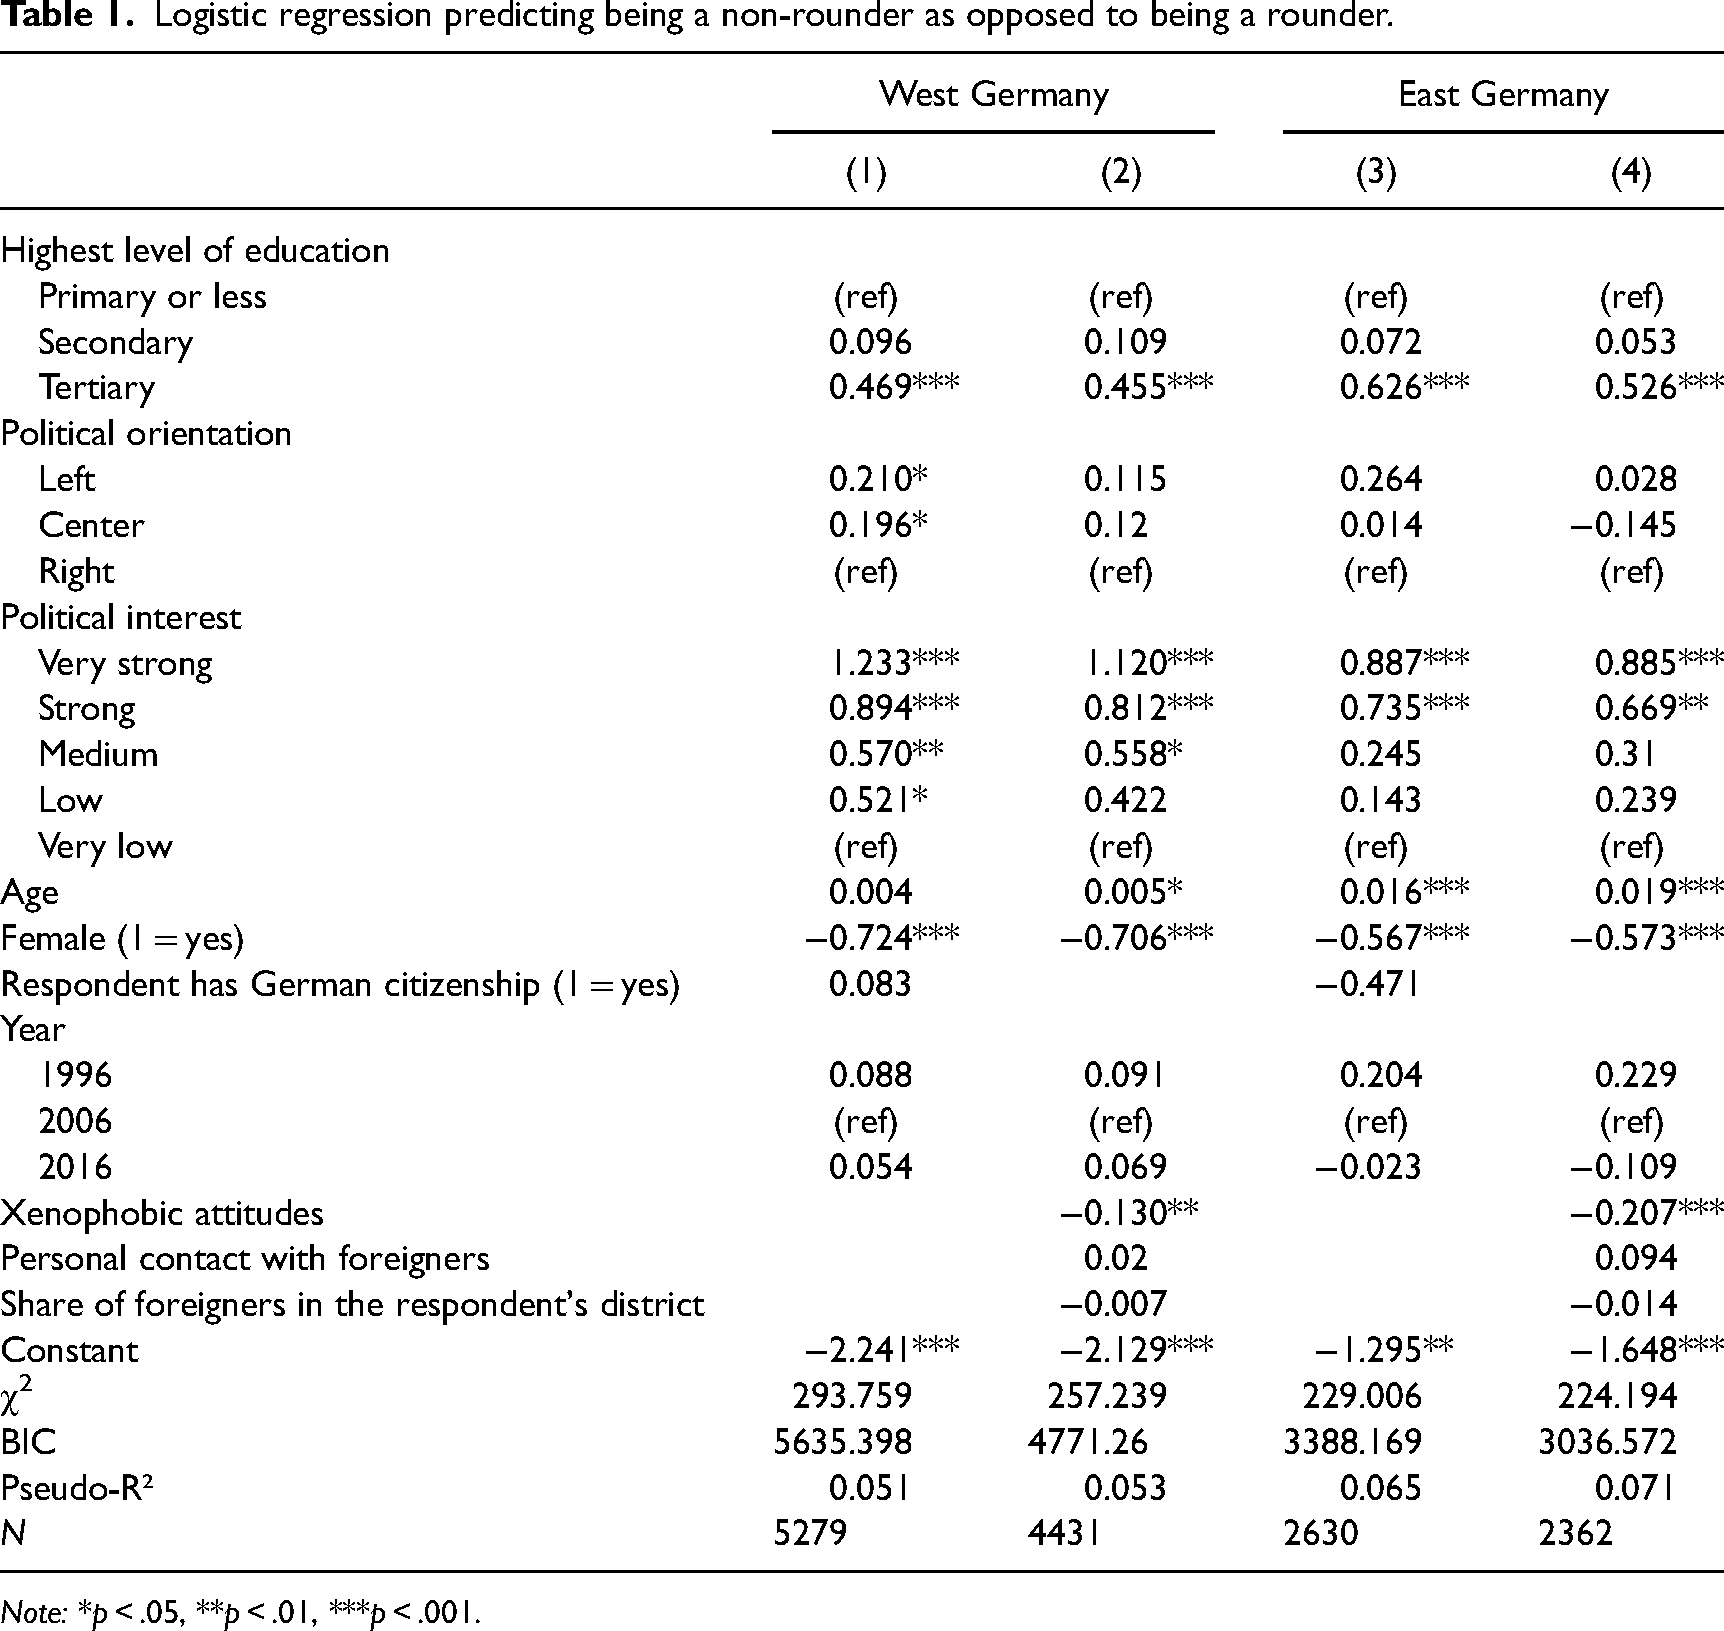
Note: *p < .05, **p < .01, ***p < .001.
Models 2 and 4 reveal that xenophobic attitudes are strongly associated with rounding. People who do not like foreigners are more likely to guess their relative group size using round numbers. When this variable is added, the effect of political orientation becomes much smaller in both regions. This suggests that the higher likelihood to round among the political right is partly a function of its xenophobic dispositions. By contrast, neither personal contact with foreigners nor the share of foreigners in the respondent's district has a significant effect. The decision to round in this estimation task seems to be more influenced by mental dispositions than by the actual situation in one's immediate social surroundings.
Overall, the demographic differences are substantial. For example, the predicted probability of “Holger,” a hypothetical leftist man aged 60 with tertiary education, who is very strongly interested in politics and has no issue with foreigners, to be a non-rounder is 52.1%, compared to 5.8% for “Jennifer,” a conservative woman aged 25 with secondary education, who has very little interest in politics and who does not like foreigners. 17
Still, the respondents-based mechanism cannot explain the discrepancy between rounders and non-rounders entirely. For example, a respondent like Holger, who basically fulfils the ideal conditions for being a non-rounder, still has about the same chance of being a rounder (47.9%). Thus, other mechanisms could play a role as well.
The structural mechanism
A second, more abstract mechanism lies within the structure of the estimation task itself. Consider a hypothetical situation in which respondents estimate a value on a continuum of numbers with no upper or lower bound. Assuming that their estimates are drawn from a normal distribution and that the sample is big enough, the structure of the task should not lead to an overestimation. Instead, over- and underestimations should cancel each other out, resulting in crowd wisdom. In reality, however, there often is a natural upper and lower bound, for example when the estimation task is about percentage shares (where values below 0% and above 100% would not make sense). In these cases, the relative position of the true value can have meaningful structural effects. For example, the share of foreigners in most countries does not lie somewhere in the middle of the possible range, where the bounds would have little practical influence, but toward the lower end. In the case of Germany, it is, as we have seen, 10.9% (West) and 5.4% (East). Crucially, this implies that respondents with a rounding bias have very few options to choose from on the underestimation side. This is most obvious in the case of East Germany with the “true” value at 5.4%. Here, a strong rounder (with a preference for values ending in “0”) can only choose 0 on the underestimation side, but 10, 20, 30, …, 90, 100 on the overestimation side. In addition to fewer options on the underestimation side, the only option available, 0, should appear highly unlikely. 18 A non-rounder, by contrast, still has several realistic options to choose from on the underestimation side (1, 2, 3, and 4 in the case of East Germany). In such a setup, the rounding bias should lead to an overestimation merely due to this situational structure, independently of any social characteristics of the respondents or the substantial topic of the estimation task. Moreover, the overestimation should be larger the closer the true value lies to one of the bounds.
To test this argument more systematically, we deploy the simulation as described in the methods section. The results are illustrated in Figure 3, which shows, on the horizontal axis, the center of the normal distribution that underlies a given simulated data sample. The vertical axis depicts, for each of the five groups under study (strong rounders, all rounders, non-rounders, full sample, and biased sample), the absolute deviation of the mean (i.e., the group-specific collective estimate) from the center (i.e., the true value) of the corresponding normal distribution. In line with the mechanism described above, the deviation (i.e., the collective miscalculation) increases dramatically the closer we come to the upper and lower bounds of the eligible set of values (here: 0‒100). The reason is that the part of the normal distribution that lies beyond these bounds is cut off (due to being ineligible), distorting the mean. Notably, the collective deviation is much higher for strong rounders than for all-rounders, and lowest for non-rounders. This is precisely because very few options remain for strong rounders and most options are left for non-rounders in the vicinity of the bounds, just as outlined above. Eventually, however, even the collective estimates of non-rounders get distorted as we approach the bounds, suggesting that crowd wisdom is structurally harder to achieve when the true value is close to the extremes of a spectrum. The comparison between the full and the biased sample is also interesting: The full (unbiased) sample fares similarly well as the non-rounders (except at the margins, where non-rounders appear hard to beat), but the biased sample (which contains an elevated share of rounders, similar to the one observed in the ALLBUS data) does feature higher deviations from the true values, situating it between the non-rounders and the unbiased sample on the one hand and the rounders on the other. This fits very well with the overestimation among the biased full samples in the real-world data (Figures 1A and 2A). Thus, the composition of the sample matters, and when there is a disproportionate amount of rounders (as is the case in the real world), crowd wisdom tends to be diminished.
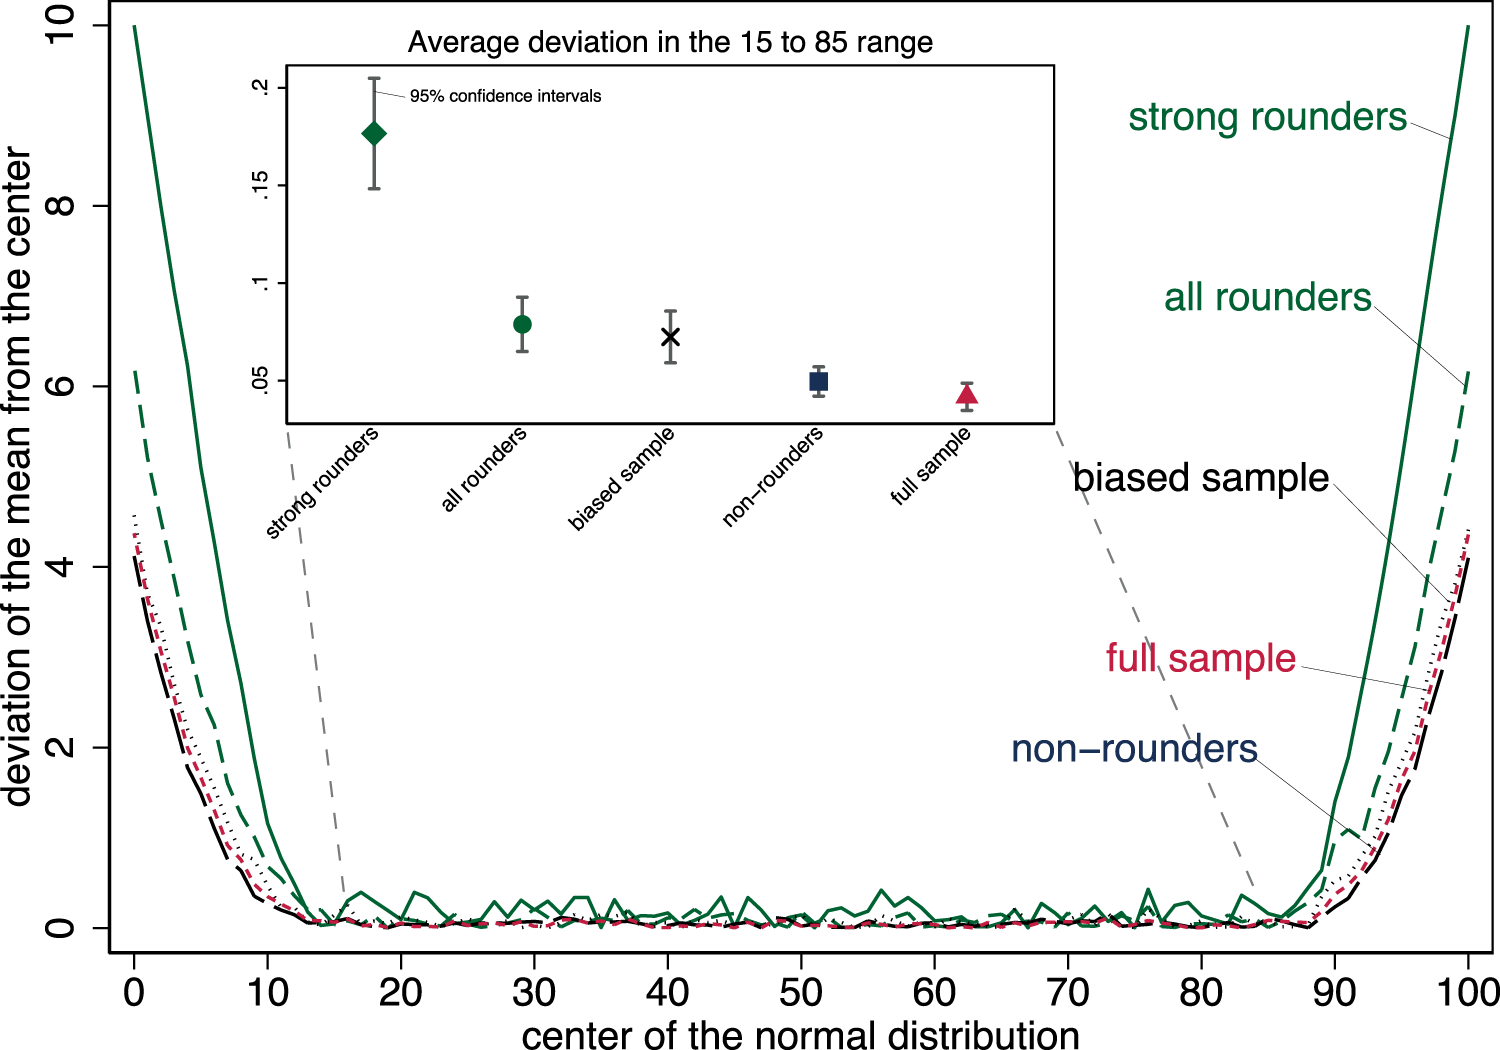
Simulation of deviations depending on the center of an assumed normal distribution.
So far, the results of the simulation confirm the theoretical argument. But it reveals another interesting aspect that would have been more difficult to foresee: Even in the middle range of the spectrum, that is, when the true value lies in the range from 15 to 85, the mean estimate of the simulated non-rounders is significantly more accurate than the mean estimate of rounders (and the biased sample; only the full sample does similarly well). The contrast is largest compared to strong rounders, whose collective guess is particularly distorted even when the outer bounds play no role as cut-off points (inset in Figure 3). Thus, it seems that the coarse-grained nature of rounding itself leads to more “bumps” and inaccuracy in guesses, whereas the fine-grained nature of non-round numbers facilitates crowd wisdom. Note that this structural pattern holds independently of any substantial content of the estimation task in question. Even in the absence of differences in knowledge and education, political preferences, or psychological biases, non-round estimates are more likely to generate emergent numeracy and crowd wisdom, as this blank simulation model reveals. 19
While this structural mechanism was illustrated based on simulation data here, some existing empirical findings also seem to be in line with it. In Herda's (2010) comparative study across 21 European countries, the two countries with by far the highest actual share of migrants, Luxemburg (32.9%) and Switzerland (22.8%), also feature the lowest overestimation (5.1 and 4.4 percentage points, respectively). These are the only two countries in that study in which the true share of foreign-born people is situated far enough in the middle of the range for the lower bound to become more or less irrelevant as an obstacle for rounders. At the same time, there are of course aspects of reality that our simple simulation does not capture, such as better information among non-rounders. Thus, the regression models and the simulation should be seen as complementary and it should be remembered that further mechanisms (e.g., uncertainty-based rescaling/inward bias, which results in a systematic overestimation of small values and an underestimation of large values, see e.g., Hollands and Dyre, 2000; Landy et al., 2018) may play a role that could not be considered here. Future research may further corroborate the extent to which this argument holds via experimental setups or by looking at estimation tasks in other fields where the true value is not typically situated close to the lower bound of the percentage spectrum. One interesting case for comparisons would be estimations of wealth inequality, where the true value is typically situated at the upper bound and where underestimations occur (Norton and Ariely, 2011).
Discussion and conclusion
By combining hitherto disconnected phenomena—immigration innumeracy, the wisdom-of-crowds effect, and the rounding bias—this study revealed new insights into the question of whether and why people actually overestimate the share of foreigners in their country. Taking the rounding bias into account allowed to identify two distinct groups of respondents:
Non-rounders, who are collectively able to estimate the true share of foreigners with astounding precision, in line with the wisdom-of-crowds effect. Rounders, who collectively overestimate the share of foreigners in their country.
The very fact that the latter group rounds suggests that its members are likely uncertain about the issue in question rather than determined that the share of foreigners is higher than it actually is. In turn, non-rounding behavior should not be mistaken for an indicator of absolute certainty. Individual non-rounders do usually not know the exact true value—their crowd wisdom is just a collective property and the usage of non-round figures merely a sign of more educated, careful guesses. Thus, there is still a diversity of estimates among non-rounders, which, as discussed, is an important precondition for the emergence of crowd wisdom. To make sure that the German case is not exceptional, the Supplementary Material also contains evidence from the ESS on 21 European countries that illustrates that the phenomenon described here also holds in other nation-states and when the question is phrased differently.
Our assumption that rounding is associated with uncertainty was corroborated via the exploration of two mechanisms. The regression analyses revealed that non-rounders are better educated and politically more interested than rounders, suggesting that they make more informed guesses and are potentially more certain. The simulation additionally showed that the setup structure (i.e., the fact that the true share of foreigners lies close to the lower bound of the possible range of percentages) and the coarse-grained nature of round numbers itself may contribute to the overestimation by rounders. Whereas the respondents-based mechanism suggests that rounding is a sign of uncertainty in the individual interviewee, the structural mechanism demonstrates that it is also a source of uncertainty in itself. Rounding is thus likely an outcome of uncertainty and simultaneously produces more uncertainty.
All this qualifies past research on immigration innumeracy in important ways: It was uncovered that a non-negligible share of the population is collectively immigration numerate and that all other respondents show behavior that is more likely based on uncertainty than on conviction. This pattern offers an additional explanation for innumeracy over and above the ones proposed in the literature, including cognitive mistakes and emotional responses (Herda, 2010). Sigelman and Niemi (2001: 93) have raised the question of whether gross overestimations of minority group sizes result from response behavior or whether they are “genuine beliefs.” The present paper may contribute to an answer to this question: Rounding, as a response bias linked to uncertainty, plays a relevant—and hitherto neglected—role in producing immigration innumeracy. This finding could have meaningful implications: If a lack of certainty contributes to the overestimation, then targeted information about the actual situation might have a better chance of being accepted compared to a situation where people have a deep-seated conviction that the share of foreigners is overly high. At the same time, our regression models also showed that people with xenophobic attitudes tend to be more likely to round. The role of the rounding bias in creating immigration innumeracy should thus be considered by actors interested in educational measures against xenophobia.
Finding ways to tackle immigration innumeracy is relevant: Survey research on South Africa (a country with a very high overestimation of the share of migrants) shows that immigration innumeracy is not only related to anti-immigrant attitudes but also a greater willingness to engage in anti-immigrant violence and even reported violent behavior against immigrants (Herda, 2023). Another study found, based on European data, that the larger the overestimation of the share of migrants, the more opposed people were to immigration and that the discrepancy between the actual and the perceived size of the share of migrants was a better predictor of anti-immigrant sentiment than the actual share (Gorodzeisky and Semyonov, 2020). A meta-analysis also revealed that the perceived share more consistently predicts prejudice than the actual share (Pottie-Sherman and Wilkes, 2017). The situation thus aligns with the Thomas theorem: When people perceive something as real, it is real in its consequences (Thomas and Thomas, 1928: 572). Better understanding which social groups are exempt from (or especially prone to) innumeracy thus seems vital. The possibility of crowd wisdom also matters in the case of immigration estimates, because where it exists, there is, for every crude overestimation, a more considerate voice that counterbalances it. In other words: Crowd wisdom could be interpreted as pointing to a balanced public debate that is “in touch” with the objective ground truth, in this case, the actual size of the group of foreigners.
The finding that a specific subset of people can make more accurate guesses collectively than the general population fits past research that has argued that the wisdom of crowds does not necessarily increase monotonically with the size of the crowd (Kao and Couzin, 2014; Budescu and Chen, 2015; Tetlock and Gardner, 2016; Galesic et al., 2018; Lorenz, 2021; Budescu et al., 2024). Several studies have examined the role of “wise sub-crowds,” demonstrating that smaller crowds composed of smarter, better-informed, or unbiased people can perform better than both larger crowds and smart individuals alone (e.g., Goldstein et al., 2014; Mannes et al., 2014). Here, we clearly have such a case of a wise sub-crowd that performs better because it likely has more information, is more determined to make an accurate guess, and makes smaller errors precisely because it picks non-round numbers.
Whether numeracy among non-rounders also emerges in other estimation and prediction tasks remains to be examined. If it turns out to be the case, then controlling for the rounding bias might become a parsimonious (and readily available) new approach in research on the wisdom of crowds: Rather than trying to figure out which characteristics (knowledge, education, experience, certainty, diligence, etc.) could be utilized to select a smaller and potentially wiser crowd—a costly and labor-intensive approach, which requires the availability of information on all these proxies—one could simply select based on a direct indicator that is always automatically available since it is an inseparable part of the estimation or prediction itself: the usage of non-round numbers. If the crowd wisdom of non-rounders were repeatedly confirmed to be a reliable indicator, it might be used to spot noticeable deviances between official statistics and crowd-based indicators, which could then be investigated further. Of course, further studies are needed to corroborate the reliability of such a new source of information.
A caveat might be that a relatively large sample size is needed to end up with a group of non-rounders that is big enough to facilitate the emergence of crowd wisdom. We have seen here (and will further explore in the Supplementary Material) that in the ALLBUS with a comparatively large sample size of ca. 3500 respondents per wave and the ESS with sample sizes of ca. 1500–2500 respondents per country, crowd wisdom does tend to emerge among non-rounders, but that the collective numeracy is even more accurate when waves or countries are combined/averaged, creating “crowds of crowds.” This suggests that the larger the crowd of non-rounders, the better the estimate will typically be—in line with the law of large numbers (Poisson, 1837). While more research is needed to determine when this crowd wisdom tends to break down, it seems plausible that surveys with, for example, just 1000 or fewer respondents would lead to less reliable collective estimates. Survey research aiming at harnessing the wisdom of non-rounders should thus aim for a large pool of participants. Non-rounders make up 19% (West) to 31% (East) of the respective ALLBUS samples (including “don’t knows”) and between 9% (Greece) and 53% (Finland) of the ESS sample (cf. Supplementary Material). Given that it is impossible to exclusively sample non-rounders ex ante, these figures imply that if one wants a sample of non-rounders as large as a conventional sample, one would have to collect about twice to ten times as much data. Our regression models suggest that this ratio could be improved by oversampling certain social characteristics (high education, high political interest, etc.). Another way to increase the “wise” sample might be to consider a fraction of the round estimates as “legitimate” (cf. Supplementary Material).
Future research should aim to test these ideas and implications in the context of other estimation and prediction tasks. The emergence of crowd wisdom among non-rounders in other thematic fields is of course anything but a given, but it seems more likely to emerge if similar conditions hold as in the situation under investigation here: (a) many people are biased and uncertain, (b) some people have a bit more information, are less biased, and more interested in making the right guess, and (c) the true value is not located at the very extremes of the possible spectrum. Moreover, research on the inward bias/uncertainty-based rescaling (Landy et al., 2018) suggests that (d) the wisdom of non-rounders would not stand out as particularly noticeable when the true value is situated in the very middle of the spectrum (e.g., 50% on a percentage scale), where the general population also tends to produce unbiased estimates. Our hope is that the paper at hand becomes a starting point for a larger set of studies with the goal of understanding the structure and mechanisms behind rounding and the emergence of crowd wisdom among non-rounding respondents. As stated at the beginning of this article, how people deal with numbers is a highly consequential issue in society today. Understanding the rounding bias and how not using round numbers can contribute to crowd wisdom matters.
Supplemental Material
sj-pdf-1-asj-10.1177_00016993241311523 - Supplemental material for Emergent numeracy: How the crowd wisdom of non-rounding survey respondents generates accurate immigration estimates
Supplemental material, sj-pdf-1-asj-10.1177_00016993241311523 for Emergent numeracy: How the crowd wisdom of non-rounding survey respondents generates accurate immigration estimates by Emanuel Deutschmann in Acta Sociologica
Footnotes
Acknowledgments
I would like to thank four anonymous reviewers at Acta Sociologica for extremely helpful comments, suggestions, and even computations that improved the quality of the manuscript tremendously. Furthermore, I am grateful to the participants of the Tuesday meeting at the Institute for Analytical Sociology at Linköping University, where an earlier version of this work was presented, for their thoughtful feedback.
Data availability
The data used are freely available from the ALLBUS (https://www.gesis.org/allbus/download) and European Social Survey (https://www.europeansocialsurvey.org/) websites. A Stata do-file that allows to replicate the analyses is available at ![]() .
.
Funding
The author received no financial support for the research, authorship, and/or publication of this article.
Supplemental material
Supplemental material for this article is available online.
Notes
Author biography
References
Supplementary Material
Please find the following supplemental material available below.
For Open Access articles published under a Creative Commons License, all supplemental material carries the same license as the article it is associated with.
For non-Open Access articles published, all supplemental material carries a non-exclusive license, and permission requests for re-use of supplemental material or any part of supplemental material shall be sent directly to the copyright owner as specified in the copyright notice associated with the article.