
Abstract
In this article, we study the role of automation risks in the school-to-work transition (STWT) of secondary vocational education (VET) graduates in the Netherlands. We use a combination of administrative and survey data, enriched with estimates of automation risks. Using sequence analysis, we find four ideal-type school-to-work trajectories representing the first 10 years in the labor market: employment, further education, further VET, and NEET. Multinomial regressions show that automation risk is not consistently associated with the type of school-to-work trajectory. We also investigate the relation between automation risk and starting wages and wage growth. We find that automation risk is negatively associated with starting wages, but not with wage growth.
Keywords
Introduction
Technological innovations have long been thought to drive social inequalities. Yet, how robotics and artificial intelligence may affect future social inequalities is still poorly understood. Some evidence suggested that the adoption of automation technologies has increased employment and income polarization by particularly affecting tasks performed in medium-skilled-medium-income jobs (Autor et al., 2003, 2008; Goos et al., 2014; Spitz-Oener, 2006). Indeed, wages in easier-to-automate jobs are lower (De La Rica et al., 2020; Nedelkoska and Quintini, 2018), wages for abstract tasks have increased (Böhm, 2020; De La Rica et al., 2020), and reemployment probabilities for unemployed workers are lower if their previous occupation had a higher automation risk (Schmidpeter and Winter-Ebmer, 2021). Other studies argued that such routine-biased polarization is not a given and has not happened to the same extent in Europe, as compared to the US (Fernández-Macías and Hurley, 2016; Oesch and Piccitto, 2019). However, it is still unclear, how automation risks change individual's careers and how this affects macro-level outcomes. We therefore investigate how automation risk shapes the early career of school-leavers from vocational education (VET) in the Netherlands.
It can be expected that human, cultural, and social capital as well as cognitive skills or certain personality traits buffer against the negative effects of automation or that such resources enable people to benefit from the potentials of automation. For example, social capital can help find an apprenticeship or job (e.g., Flohr and Protsch, 2023). Higher cognitive skills might make it easier to adapt to automation because they increase the likelihood of participating in further training (cf. Fouarge et al., 2013). The increased use of computers also boosted the demand for and the wages of people with better “people skills” (Borghans et al., 2014). Personality traits like openness to experience also entail a readiness to adapt, while neuroticism, on the other hand, brings about negative reactions to changing environments (McCrae and John, 1992). Another mechanism might be a more effective job search for individuals with certain personality traits (Baay et al., 2014).
Hence, we aim to understand how and if automation has changed labor market inequalities by studying recent school-leavers from VET in the Netherlands. We do so because, first, most studies on labor-market consequences of technological change focus on macro-level data, for example on the job level (e.g., Nedelkoska and Quintini, 2018). Few observe the micro-level processes that aggregate into macro-level regularities. Second, young people's early careers are generally more volatile than careers of established employees. They are labor market outsiders and are relatively unprotected by unions and collective employment protection agreements (Lindbeck and Snower, 2001). In times of uncertainty, they are first fired and last hired (e.g., Reagan, 1992) and more affected by labor market changes related to automation (see Dauth et al., 2021). Hence, they serve as the proverbial canary in the coal mine: any observable impact of automation on workers will be first observed in this group. At the same time, the negative long-term effects of a failed school-to-work transition (STWT) are well-studied (e.g., Gregg and Tominey, 2005; Ralston et al., 2021; Steijn et al., 2006). This makes it crucial to understand how and if automation changes school-to-work transitions and early careers. Studying school-leavers helps us to better understand the role of education and the possible consequences of being taught soon-to-be obsolete skills for the school-to-work transition and early careers. We focus on the Netherlands, a country with very low unemployment rates and low income and a highly skilled labor force. As a least-likely case, this can provide us with lower-bound estimates of the effects of automation risks on the school-to-work transition.
Graduates from VET generally transition to both lower- and middle-skilled jobs, making them well suited to study processes of job polarization and educational upgrading. VET is also seen as a safety net for low-qualified youth (Iannelli and Raffe, 2007; Shavit and Müller, 2000). Technological change might erode this function because automation is likely to first replace routine tasks (Goos et al., 2014). Some argue that VET graduates are particularly at risk (Ter Weel et al., 2021). However, in countries with a strong VET system, such as the Netherlands, VET graduates also have an initial labor market advantage over graduates from general education (Breen, 2005; De Graaf and Ultee, 1998; Forster et al., 2016; Middeldorp et al., 2018; Ryan, 2001; Shavit and Müller, 1998; Wolbers, 2007). Yet, the specificity of their skills might also make them less able to respond to technological changes (Forster et al., 2016; Hanushek et al., 2017). Crucially, vocational specificity varies between VET programs (DiPrete et al., 2017; Forster and Bol, 2018; Muja et al., 2019). We suggest that there are also differences in the extent to which different VET programs are affected by automation.
Our analyses answer the following research questions: (1) to what extent and how are school-leavers from different vocational education and training programs exposed to automation risks, (2) to what extent does the automation risk of different VET programs correlate with early career paths and wage development of VET graduates during the school-to-work transition, and (3) to what extent does the correlation of automation on labor market outcomes vary with (a) social class, (b) psychological traits, and (c) cognitive skills?
To answer these questions, we use longitudinal register data from Statistics Netherlands, which allow us to follow the early career of one cohort of VET graduates for 10 years. To the diploma data, we merge indicators of automation risks. The cohort was part of the Voortgezet Onderwijs Cohort Leerlingen (VOCL’99) survey, which includes data on cognitive skills and personality traits (Kuyper et al., 2003). Merging survey and register data allows for the analysis of population-wide, high-quality, prospective data from administrative registers combined with metrics only measurable in surveys. In addition, the monthly economic activity data enable us to perform sequence- and cluster analysis to group VET graduates by their type of STWT. We then use multinomial logistic regressions to test whether automation risk explains sorting into either trajectory. To test whether automation risk explains differences in wages and wage growth, we use random-effects growth curve models.
Background
Vocational education and automation
To understand how automation alters the STWT of VET graduates, we follow the general argument that labor market allocation is a matching process between people and jobs (Logan, 1996; Spence, 1973; Thurow, 1975), where job seekers and employers seek optimal matches, given their preferences, opportunities, and constraints. Employers sort and match job seekers into jobs based on observable characteristics, mainly educational credentials. These signal the extent to which candidates are immediately productive, that is, do not require much additional training and possess the required (although unobserved) skills for the given job. How strongly employers can rely on educational credentials differs between countries. The Dutch education system is highly stratified and standardized and characterized by strong institutional linkages and high vocational specificity (see Appendix A for a schematic overview; see also Bol and van de Werfhorst, 2013; Iannelli and Raffe, 2007; Raffe, 2008). Here, credential signals are clearer than in less standardized, less vocationally oriented countries (Müller, 2005). This is thought to help limit skill mismatches during the STWT (Levels et al., 2014) and to reduce training costs, making VET graduates more attractive to potential employers (Arum and Shavit, 1995; Barone and van de Werfhorst, 2011; Wolbers, 2007). Hence, VET graduates find jobs faster, are less often unemployed, and have a smoother STWT, even more so in vocationally oriented education systems (Breen, 2005; De Graaf and Ultee, 1998; Forster et al., 2016; Middeldorp et al., 2018; Ryan, 2001; Shavit and Müller, 1998; Wolbers, 2007). This also holds for differences within the vocational education system and between programs, as the vocational specificity of VET programs is positively associated with employment chances in the early career (Bol et al., 2019; Muja et al., 2019). However, this initial advantage might become a disadvantage because VET graduates are less able to adjust to a changing labor market later in life (Forster et al., 2016; Hanushek et al., 2017). Hence, the labor market success of VET graduates partly depends on whether their skills are in demand, whether these skills make them immediately productive, and to what extent employers can infer information on these skills from educational credentials. However, the increased potential of automation technologies might change skill requirements and task composition of occupations (Autor et al., 2003; Brynjolfsson and McAfee, 2011). Therefore, it is important to know which occupations are most affected. Frey and Osborne (2017) defined the automation risk of an occupation by judging which tasks machines cannot yet easily perform, that is, perception and manipulation of complex objects as well as creative and social intelligence. Frey and Osborne (2017) estimated that 47% of US jobs are at risk of automation. Other studies arrived at similar conclusions. Bonin et al. (2015) estimate that share at 42% for Germany, using a task rather than an occupational approach, whereas Dengler and Matthes (2018) estimate that share at 15%. Other findings are less alarming, for example, 9% for the US (Arntz et al., 2016) or 14% for OECD countries (Nedelkoska and Quintini, 2018). However, all agree that automation will significantly change the labor market by destroying, creating, and altering jobs.
So, what does automation mean for VET graduates in the labor market? We expect that those graduating from a program preparing for easier-to-automate occupations are less likely to have a successful STWT. First, because of the high standardization of VET and the tight institutional linkages, employers know which skills are taught in which VET program. Employers also form opinions about the future of certain jobs and the demand for certain skills and might thus infer the potential of automation technologies for each VET program. For example, in a survey with HR professionals in the Netherlands, two-thirds agreed that “Due to the use of robots and artificial intelligence, more jobs will disappear than new jobs will be created” (Somers and Fouarge, 2022). Employers might then sort educational credentials based on the perceived ease of automation (the potential return on investment) and refrain from hiring graduates from VET programs that teach skills, which in their opinion will soon be obsolete.
The second reason why graduates from VET programs with higher automation risks might have less successful STWTs is that they are labor market outsiders (Lindbeck and Snower, 2001) who have yet to attain union protection, higher wages, and tenured contracts protecting already established employees. Meaning that in times of uncertainty, young employees, and labor market entrants are likely the first to be fired and the last to be hired (Reagan, 1992). If automation decreases the demand for easier-to-automate VET diplomas and shifts firms’ investments from labor to capital, employers might resort to hiring stops rather than termination of existing employment. Therefore, we hypothesize that, ceteris paribus, the automation risk of occupations for which VET programs prepare is positively associated with STWTs that are characterized by (H1) long joblessness or time spent not in employment, education, or training (NEET). However, automation risks might also lead to different expectations. For some, as described above, automation likely means lower employment chances or reduced earnings. Others, however, might react to this with continued learning and further education. Hence, we might also expect that, ceteris paribus, the automation risk of occupations for which VET programs prepare is associated with a higher probability to continue with education (H2). Lastly, a similar, but less extreme reaction of employers than hiring stops would be to offer lower wages. Potential occupational downgrading and the general lower demand for automatable skills lead us to expect that, ceteris paribus, the automation risk of occupations for which VET programs prepare is negatively associated with (H3) starting wages and (H4) wage growth during the early career.
The role of social class
While technological change may affect all of society equally, the resources to compensate for possible negative side effects are distributed unequally. Higher social class backgrounds mean access to more parental knowledge, resources, networks, and cultural and social capital. Parents from a higher social class background will mobilize their social, cultural, and economic resources to avoid their children's downward mobility and to secure advantages wherever possible (Bernardi and Gil-Hernández, 2021; Breen and Goldthorpe, 1997; Lucas, 2001). Higher social class families are likely better connected and can leverage their social network to secure a better labor market position for their children (Lin, 2001). This leads us to expect that the negative relation between automation risks and outcomes during the STWT is weaker for young people with a higher social class background (H5).
Moderation by cognitive skills
We expect that individuals with higher cognitive skills better adapt to new technologies. We base our expectation on the intuition that “cognition is essential in processing information, learning and in decision-making” (Borghans et al., 2008) and that lower-educated workers are less likely to participate in further training (Bassanini et al., 2007; Fouarge et al., 2013). Additionally, workers whose jobs are the most likely to be substituted by machines are least likely to receive further training (Ehlert, 2020; Nedelkoska and Quintini, 2018). Those with higher cognitive skills, however, might be more able and willing to follow training. Hence, we expect that the higher the cognitive skills of VET graduates, the weaker the expected effect of automation risk on their labor market outcomes (H6).
Moderation by personality
Personality traits offer another moderation mechanism of automation risk. These “relatively enduring patterns of thoughts, feelings, and behaviors that reflect the tendency to respond in certain ways under certain circumstances” (Roberts, 2009: 140) mean that individuals with different personalities will respond differently to automation risk. They are commonly organized into five domains: extraversion, agreeableness, conscientiousness, emotional stability, and openness to experience (Hendriks et al., 1999a; McCrae and John, 1992). However, we only hypothesize about the following three.
Conscientiousness describes people as being efficient and organized (McCrae and John, 1992). Conscientious people should cope better with technological changes because of their efficient and planful way of working. They likely plan ahead and thus avoid the negative effects of automation. Hence, the higher VET graduates score on conscientiousness, the weaker the expected negative association of automation risk on their labor market outcomes (H7).
People scoring low on emotional stability are described as anxious, self-defeating, and vulnerable (McCrae and John, 1992) whereas emotionally stable people “readily overcome setbacks” (Hendriks et al., 1999a). People scoring high on neuroticism might prefer positively affective, stable work environments that are predictable and frictionless (Bode et al., 2019). Technological changes at work disrupt this stability. In addition, emotionally stable individuals might be more successful in their job-search efforts (Baay et al., 2014). Hence, the higher VET graduates score on emotional stability, the weaker is the expected negative association of automation risk and labor market outcomes (H8).
Openness to experience (autonomy) describes people as imaginative, curious, and following unusual thought processes (McCrae and John, 1992). Open individuals are therefore better equipped to adapt to novel situations or environments that provide opportunities to engage their intellectual capacities, such as new technologies. In our data, this trait is called autonomy. Autonomy correlates with openness to experience (Hendriks et al., 1999a). An autonomous person “can easily link facts together” and “thinks quickly” (Hendriks et al., 1999a). This adaptability might be beneficial in occupations with rapidly changing skill requirements and tasks. Hence, we hypothesize that the higher VET graduates score on autonomy, the weaker is the expected negative association of automation risk and labor market outcomes (H9).
Data and methods
Data and sample selection
We use a combination of survey and register data. The VOCL’99 survey (Kuyper et al., 2003) includes personality traits, cognitive skills, and parental education, which are not available in register data. It was collected from a 10% random sample of pupils in the first year of Dutch regular secondary education. The register data (Bakker et al., 2014) give us access to vocational diplomas, socioeconomic activity, wages, employment contracts, and working hours. From the VOCL sample, we select first-time VET graduates (middelbaar beroepsonderwijs (MBO), levels 3/4) between 2006 and 2012 (N = 5588). For the sequence analysis, we exclude observations with more than 10% missing states over the 10-year observation period, yielding a sample of N = 5222. For the wage analysis, the sample is N = 5471 as we exclude records with invalid wage data. MBO 3 and 4 represent the intermediate and high levels of VET in the Dutch system. The cohort's modal graduation year was 2007. For each diploma, we merge estimated automation risks, which we will describe below.
Operationalization
We use the following variables in our analyses. Descriptive statistics of all variables are presented in Table 1, histograms are provided in Appendix B.
Descriptive statistics in the first year after graduating MBO3/4.
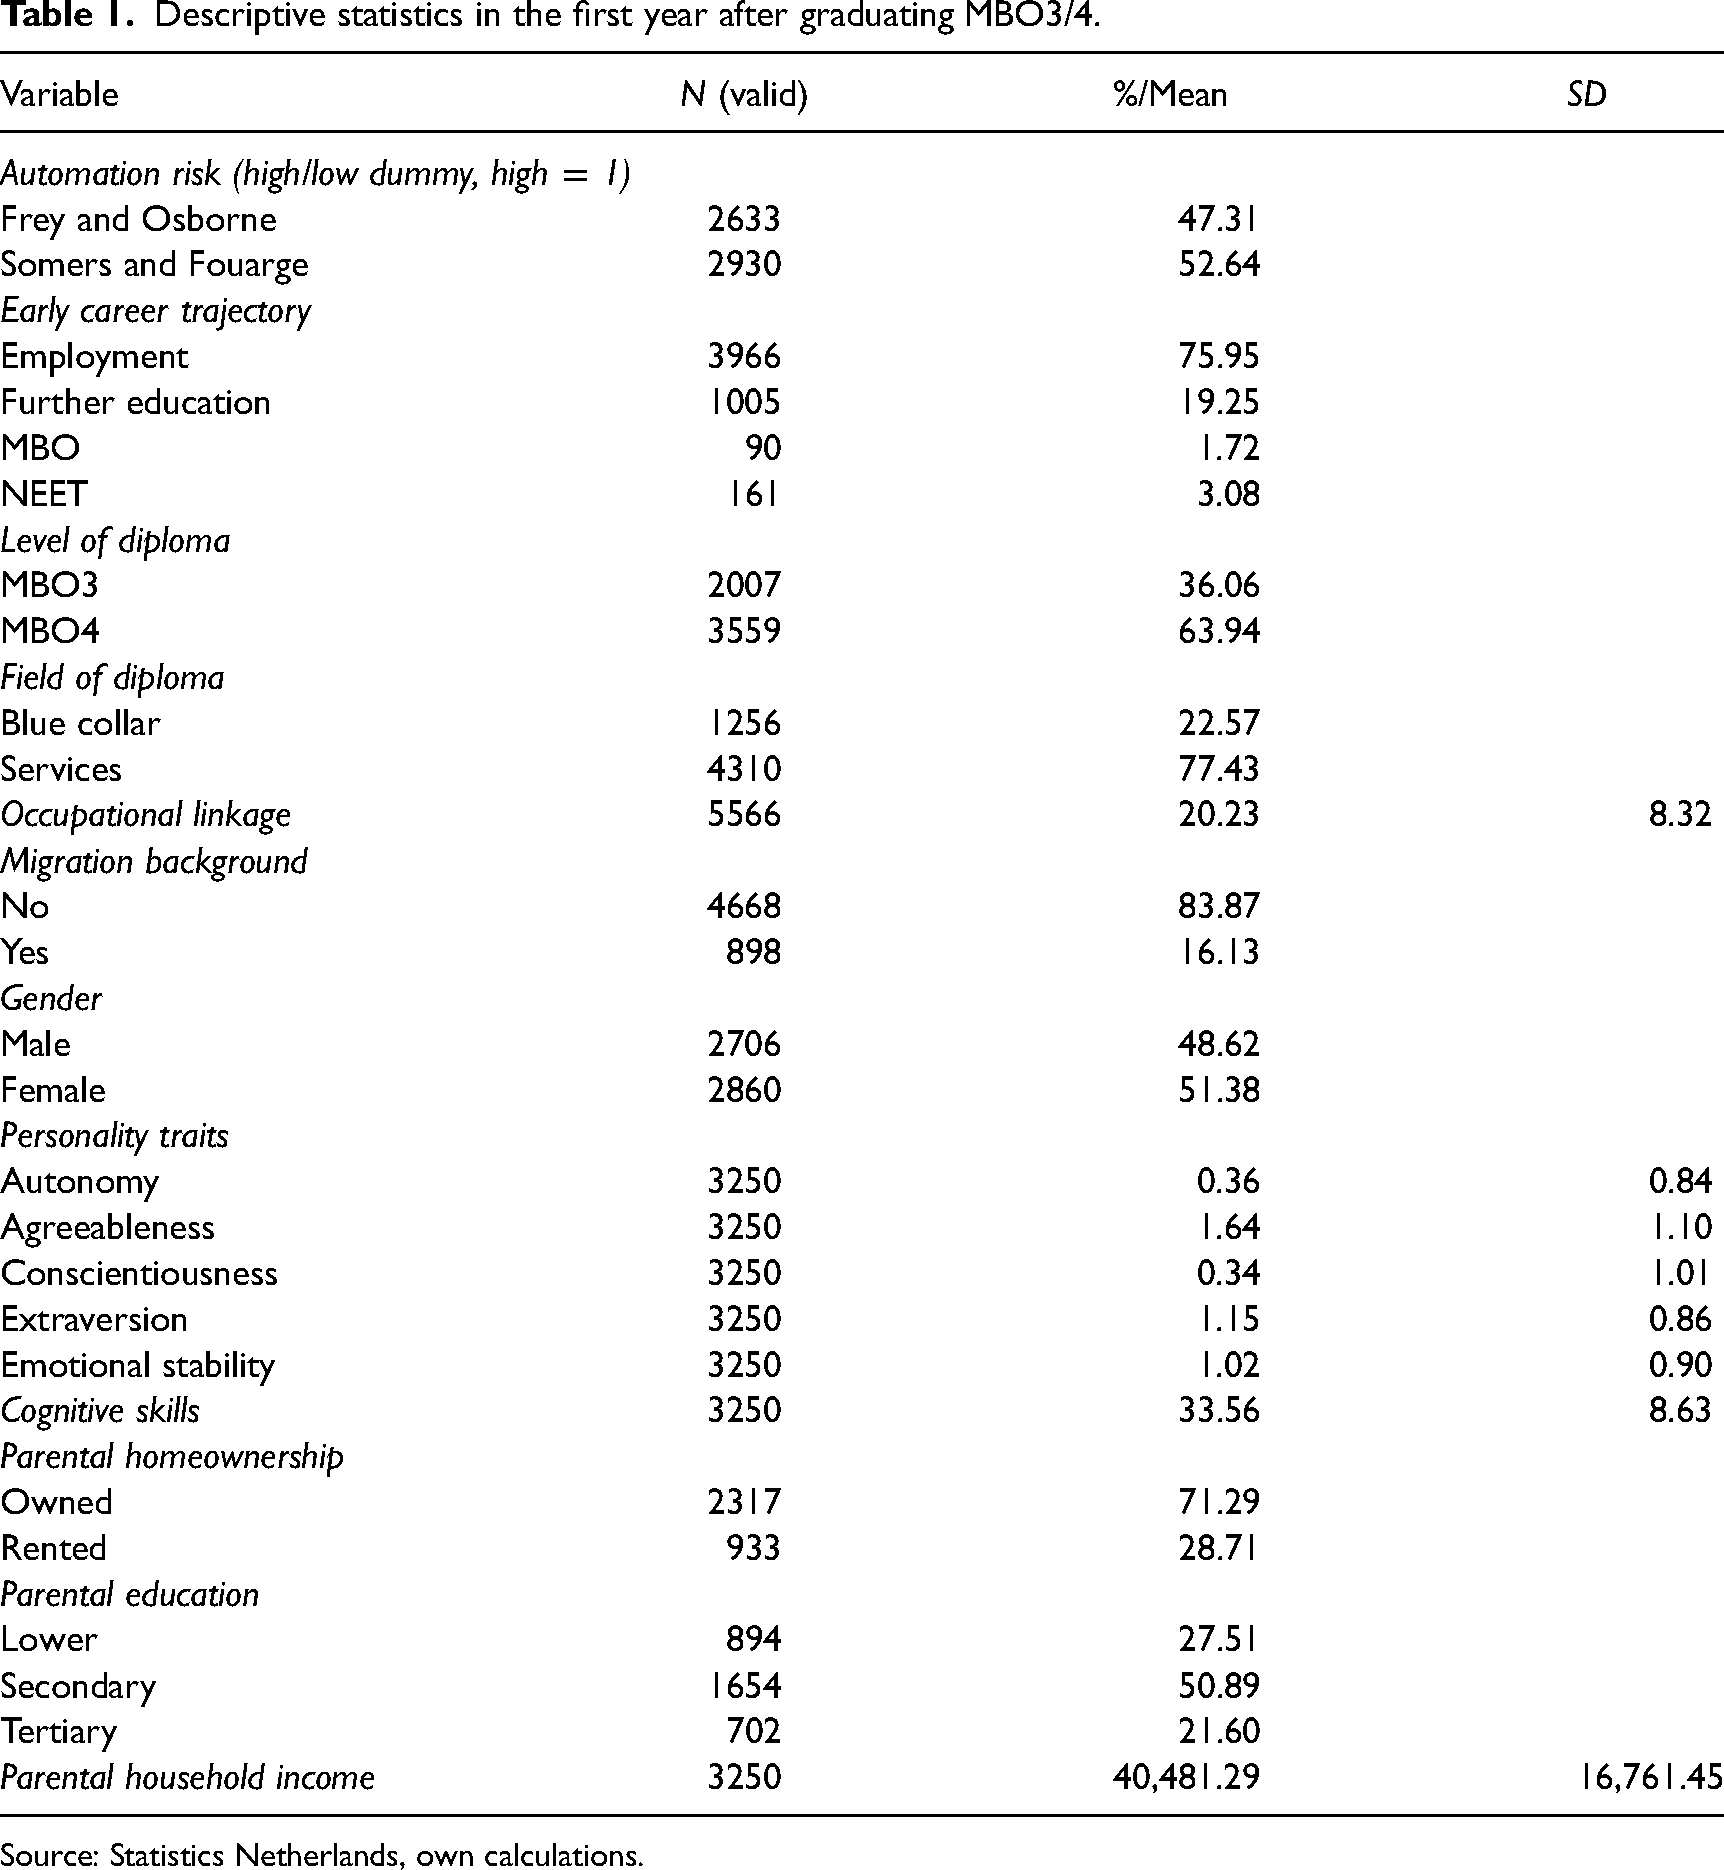
Source: Statistics Netherlands, own calculations.
Automation risk. We use two indicators of automation risks. The first, by Frey and Osborne (2017), was originally estimated using the Standard Occupational Classification (SOC) 6-digit codes. We use the crosswalk table provided by the US Bureau of Labor Statistics to merge these to the International Standard Classification of Occupations (ISCO) 4-digit codes. Using data from the Dutch labor force surveys pooled over the years 2006–2008 and calculate the weighted average of the automation risks of the most frequent 50% of ISCO 4-digit occupations within each VET level-field combination. The matching process is illustrated in Figure 1. The data by Frey and Osborne (2017), F&O for short, were first published in 2013 and aim to capture the extent to which automation, especially advances in machine learning, are expected to affect occupations soon. To do so, the authors, in cooperation with machine learning experts, hand-coded 70 occupations as automatable or not and combined their ratings with task data from O*NET to train a classifying algorithm.
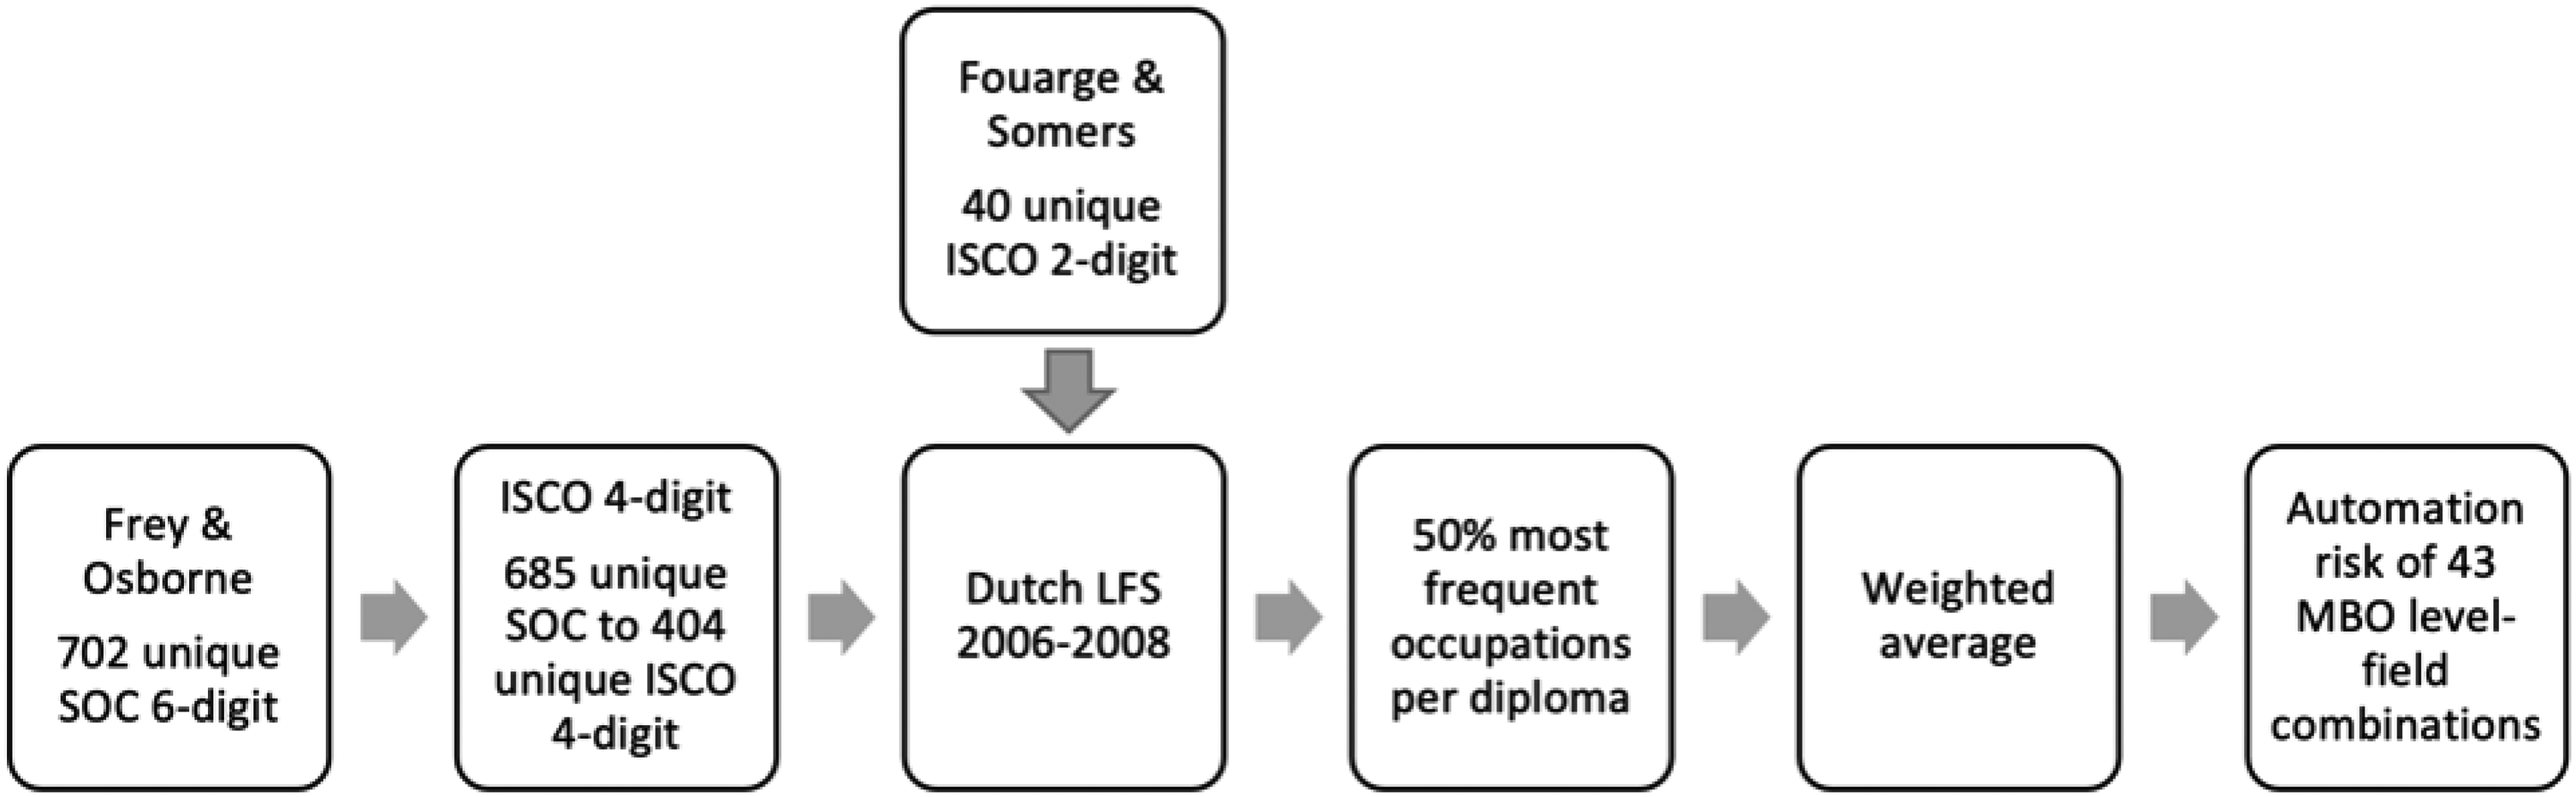
Matching logic of automation risk to VET programs.
As the data by Frey and Osborne are primarily informative for the American labor market, we supplement our analysis with data by Somers and Fouarge (2022), S&F for short, a survey of Dutch human resource professionals. In it, participants gave their opinion on the likelihood that employees will spend more or less time on certain tasks in the future. We use the share of tasks within each occupation on which employees are expected to spend less time as an indicator of automation risk.
The average automation risk for each level-field combination is shown in Figure 2. The lowest automation risk is found in health and care-related fields. In that, the two measures mostly agree. When matched on ISCO 2-digit level, their correlation is r(38) = .61, p < .001. One noteworthy outlier in the upper third is ICT-related fields, where S&F deviates from F&O. This might be due to idiosyncrasies of the Dutch labor market that F&O, based on an American occupational structure, is not picking up. The middle section is dominated by jobs with mostly manual tasks, such as construction, mechanical engineering, electrical installation, logistics, bakery, and horticulture and agriculture. Both F&O and S&F foresee a higher automation risk for these occupations. Lastly, the fields with the highest automation risk prepare for occupations with mostly routine cognitive tasks, like secretarial and administrative work. Both automation risk indicators have advantages and shortcomings. F&O is more precisely measured and more widely known, but older. S&F is more recent, but less precise. Still, it might provide a better assessment of the Dutch case, because it was collected in the Netherlands. Using both helps us in interpreting the results. If the results agree, we can be more confident, if they disagree, we should be cautious in drawing conclusions. For ease of interpretability, and to not overstate the precision of the merged automation risks, we present results using mean-split-dummies throughout the main analyses. See Appendix C for the correlation matrix between the indicators and for results using the different specifications.
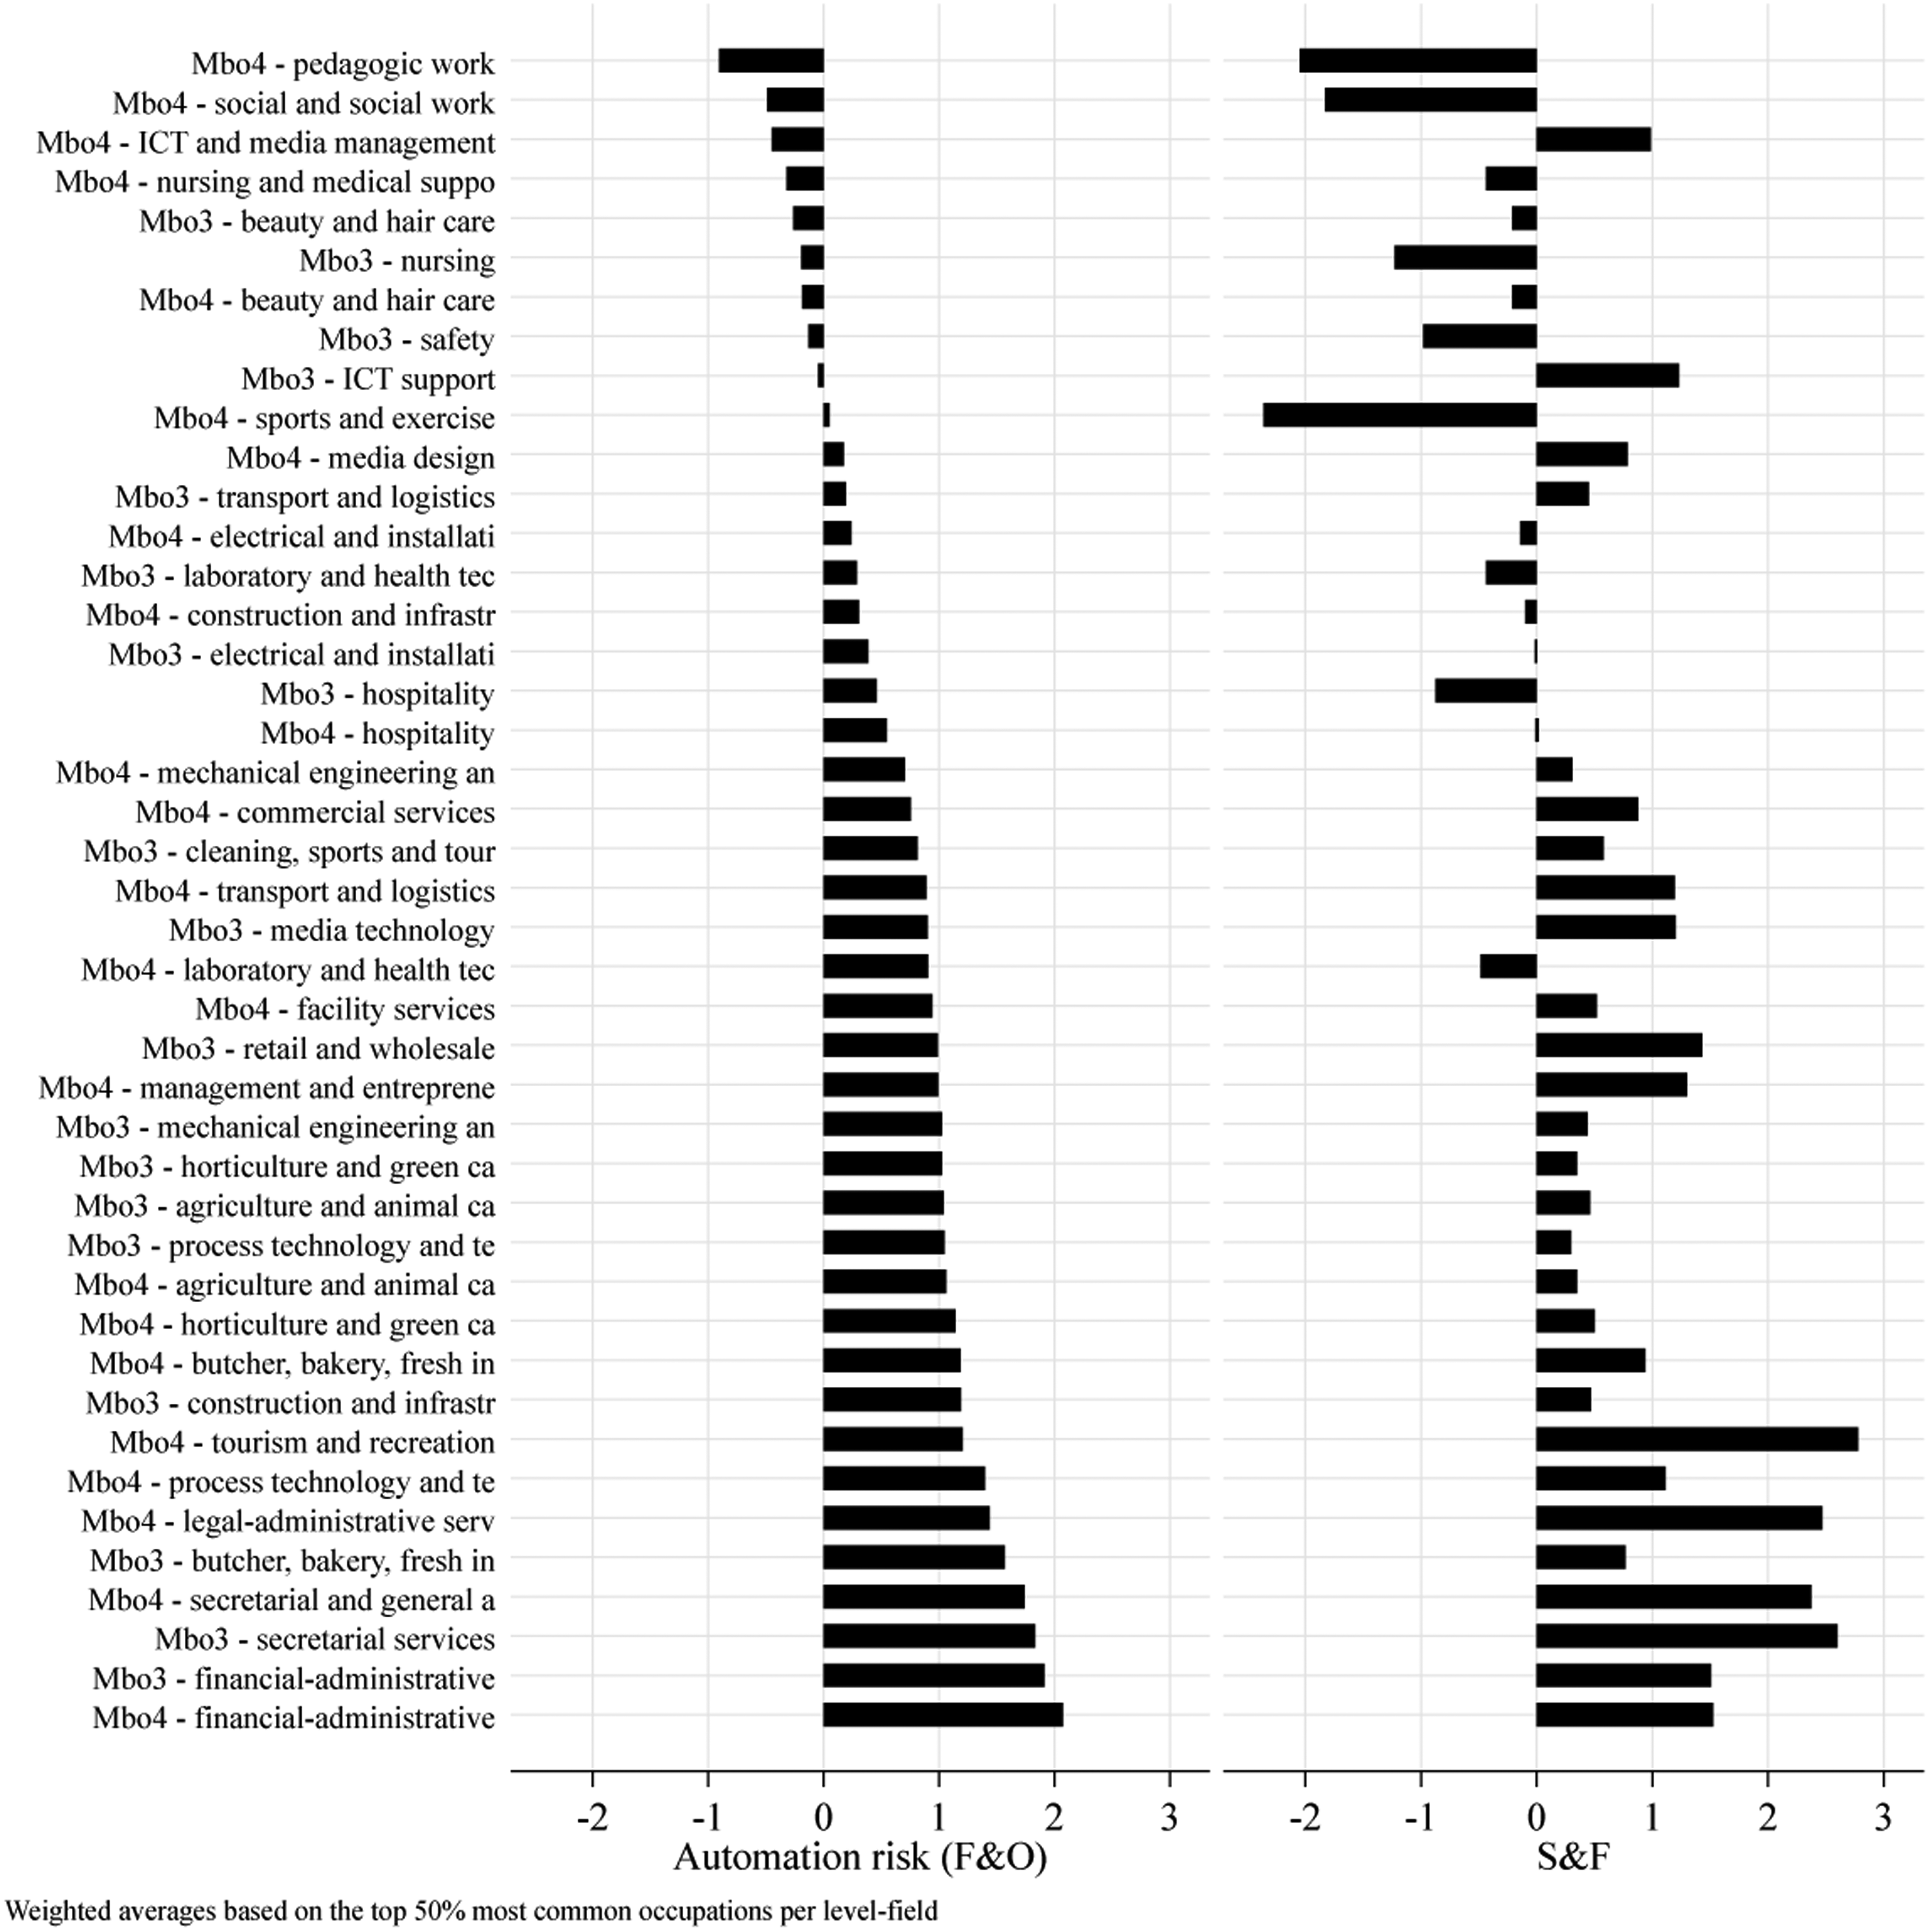
Automation risks of vocational education and training level-field combinations. Source: Own calculations based on Frey and Osborne (2017), Somers and Fouarge (2022).
Occupational linkage. For each VET level-field combination, we calculate the share of employees in the most common occupation–education combination from all possible combinations within one level-field combination. For example, in the MBO3 level-field ONR23213 horticulture and green care, 54% of graduates in 2006 and 2008 work in ISCO 2008-code 6113 Gardeners, horticultural and nursery growers. Hence, the occupational linkage of that program is 54%.
Monthly activity sequence. Monthly activity is obtained by merging two datasets from the Dutch register data (Bakker et al., 2014). The first includes data on 12 main economic activities based on the main source of income. We combine the states employee, director/major shareholder, self-employed, and other self-employed into working, the states recipient of unemployment insurance, recipient of welfare, recipient of other social benefits, recipient of illness and disability benefits, recipient of pension and other without income into NEET, and the states (not yet) pupil/student with income and (not yet) pupil/student without income, into Education. To capture employment changes, we separate Working into Working A and Working B. The first employment spell after leaving VET being Working A, the following employment being B, the third A, the fourth B, and so on. Without doing so, employment spells of multiple years would be indistinguishable from many different employment spells within the same time. The second dataset includes registrations in publicly funded education. We merge the datasets on main economic activity and educational registrations and create a new monthly activity variable, whereas education overwrites and is prioritized over other states. Primary education, practical education, and secondary education are grouped together as Secondary Education and below. The other states represent the three main types of further education in the Netherlands, upper secondary vocational education (MBO), university of applied science (HBO), and university (WO).
Log hourly wage. We calculate the hourly wage from the register data on wages and working hours of different contracts per month, sum up all contracts per person-month, divide the wage by 4 weeks and by working hours per week. Negative values, hourly wages below the minimum wage for 19-year-olds in 2006 (€3.86), and hourly wages three standard deviations above the mean are coded as missing. 1 We deflate nominal wages to real wages by dividing them by the corresponding yearly customer price index (2015 = 100). The resulting variable has a mode of €15.51 and a standard deviation of €4.95. We use the natural logarithm of that variable in our analysis.
Cognitive skills. The VOCL’99 study included a test of cognitive skills in three domains, math (Cronbach's
Personality traits. We make use of the Five Factor Personality Inventory from VOCL’99 based on 100 items to measure the factors Extraversion, Agreeableness, Conscientiousness, Emotional Stability, and Autonomy. Responses were collected on a scale from 1 (not at all applicable) to 5 (entirely applicable). Observations were excluded if less than 70% of items were answered, responses were corrected for positive answering bias (acquiescence; “yea-saying”), and missing values of single items 2 were imputed by Statistics Netherlands using the student's personal mean on the answered items per factor pole (Hendriks et al., 1999b). To aid interpretation we standardize the scores to the sample means.
Social class background. We measure social class background using several variables. First, we use the highest parental education from the VOCL’99 parent questionnaire. We distinguish tertiary, secondary, and lower education. In addition, we use the yearly household income from Dutch register data. We use the value from 2003 as it is the earliest available. Some observations have negative values that we replace with €1. We mean to center the variable to ease the interpretation of interaction terms. We also use information on the dwelling status of the parents from Dutch register data and distinguish between owned and rented housing.
MBO level. From the education registers, we distinguish MBO Level 3 from Level 4 and code them as a binary variable.
Field of education. We distinguish educational programs by service- and blue-collar orientation and consider the fields Education, Humanities and Arts, Social Sciences, Business and Law, Science, Mathematics and Computing, Health and Welfare, and Services as services and the remaining fields Agriculture and Veterinary and Engineering, Manufacturing and Construction, as blue-collar.
Gender. we use the variable provided in the register data to distinguish women (coded as 1) from men (coded as 0).
Immigration background. We distinguish pupils with two Dutch-born parents (coded as 0) from pupils who with at least one foreign-born parent or who themselves were not born in the Netherlands (coded as 1).
Analyses
As seen in Table 1, some variables from the VOCL survey have missing data, most of which stems from the personality and cognitive ability items, as well as the parental background questionnaire. We use multiple imputations to address this issue (see Appendix F for details).
Sequence analysis
We use sequence analysis to explore early career trajectories from the month of VET graduation until 10 years after. Sequence analyses allow a holistic perspective on the context of single NEET episodes. Trajectories that are considered successful STWT, meaning they lead to employment, might still include some episodes of NEET. The holistic perspective ensures distinguishing trajectories on a more fundamental basis.
We use optimal matching to calculate a pairwise measure of dissimilarity given a pre-defined cost structure with insertion/deletion costs set as 2 and substitution costs set as 1. This is equivalent to the Longest Common Subsequence 3 (Studer and Ritschard, 2016). As we are primarily concerned with the length of NEET spells, optimal matching is a reasonable choice (Studer and Ritschard, 2016). We use the TraMinerR package for data preparation and calculation of the distance matrix (Gabadinho et al., 2011) and the WeightedCluster package for steps related to clustering (Studer, 2013). We settle for the four-cluster partition using the complete linkage algorithm. To get an overview of how clusters partition with the hierarchical methods, cluster trees of Ward's algorithm and complete linkage are available in Appendix D.
Models
After selecting a cluster partition, we model the cluster membership using multinomial logistic regression. The basic specification can be written as follows, where the log odds of following trajectory k compared to the reference category K, depend on automation risk and a battery X of covariates:

Results
Automation risk and school-to-work typologies
Results of the sequence analysis are shown in Figure 3 which shows the selected four clusters and their states over time in a status proportion plot. The four clusters represent typical trajectories after VET graduation in the Netherlands. Cluster 1, which we call Employment (75.9%, N = 3971), consists of cases that are working for most of the time. On average, 5.6 out of 120 months are spent in NEET. After initial stints in education, most find employment quickly. Cluster 2 which we call Further Education (19.3%, N = 1010) represents a very common trajectory from MBO4 into HBO Bachelor programs. On average, 5.3 out of 120 months are spent in NEET. It clearly shows the pathway of 4-year Bachelor programs and then a transition into the labor market while others prolong their studies. Cluster 3 consists of 3% (N = 161) who follow a trajectory predominantly described by time spent in NEET. This cluster starts with a highly diverse set of states. While some cases in this cluster move in and out of employment states, most of the time in this cluster is spent as NEET. On average, 82.3 out of 120 months are spent in NEET. Lastly, Cluster 4 shows a small group of 1.7% (N = 91) of MBO graduates who at some point re-enroll in an MBO program. On average, 8.7 out of 120 months are spent in NEET. We conclude that most graduates from MBO programs have a successful school-to-work transition. Some continue with education, and only a few follow a long-term NEET trajectory.
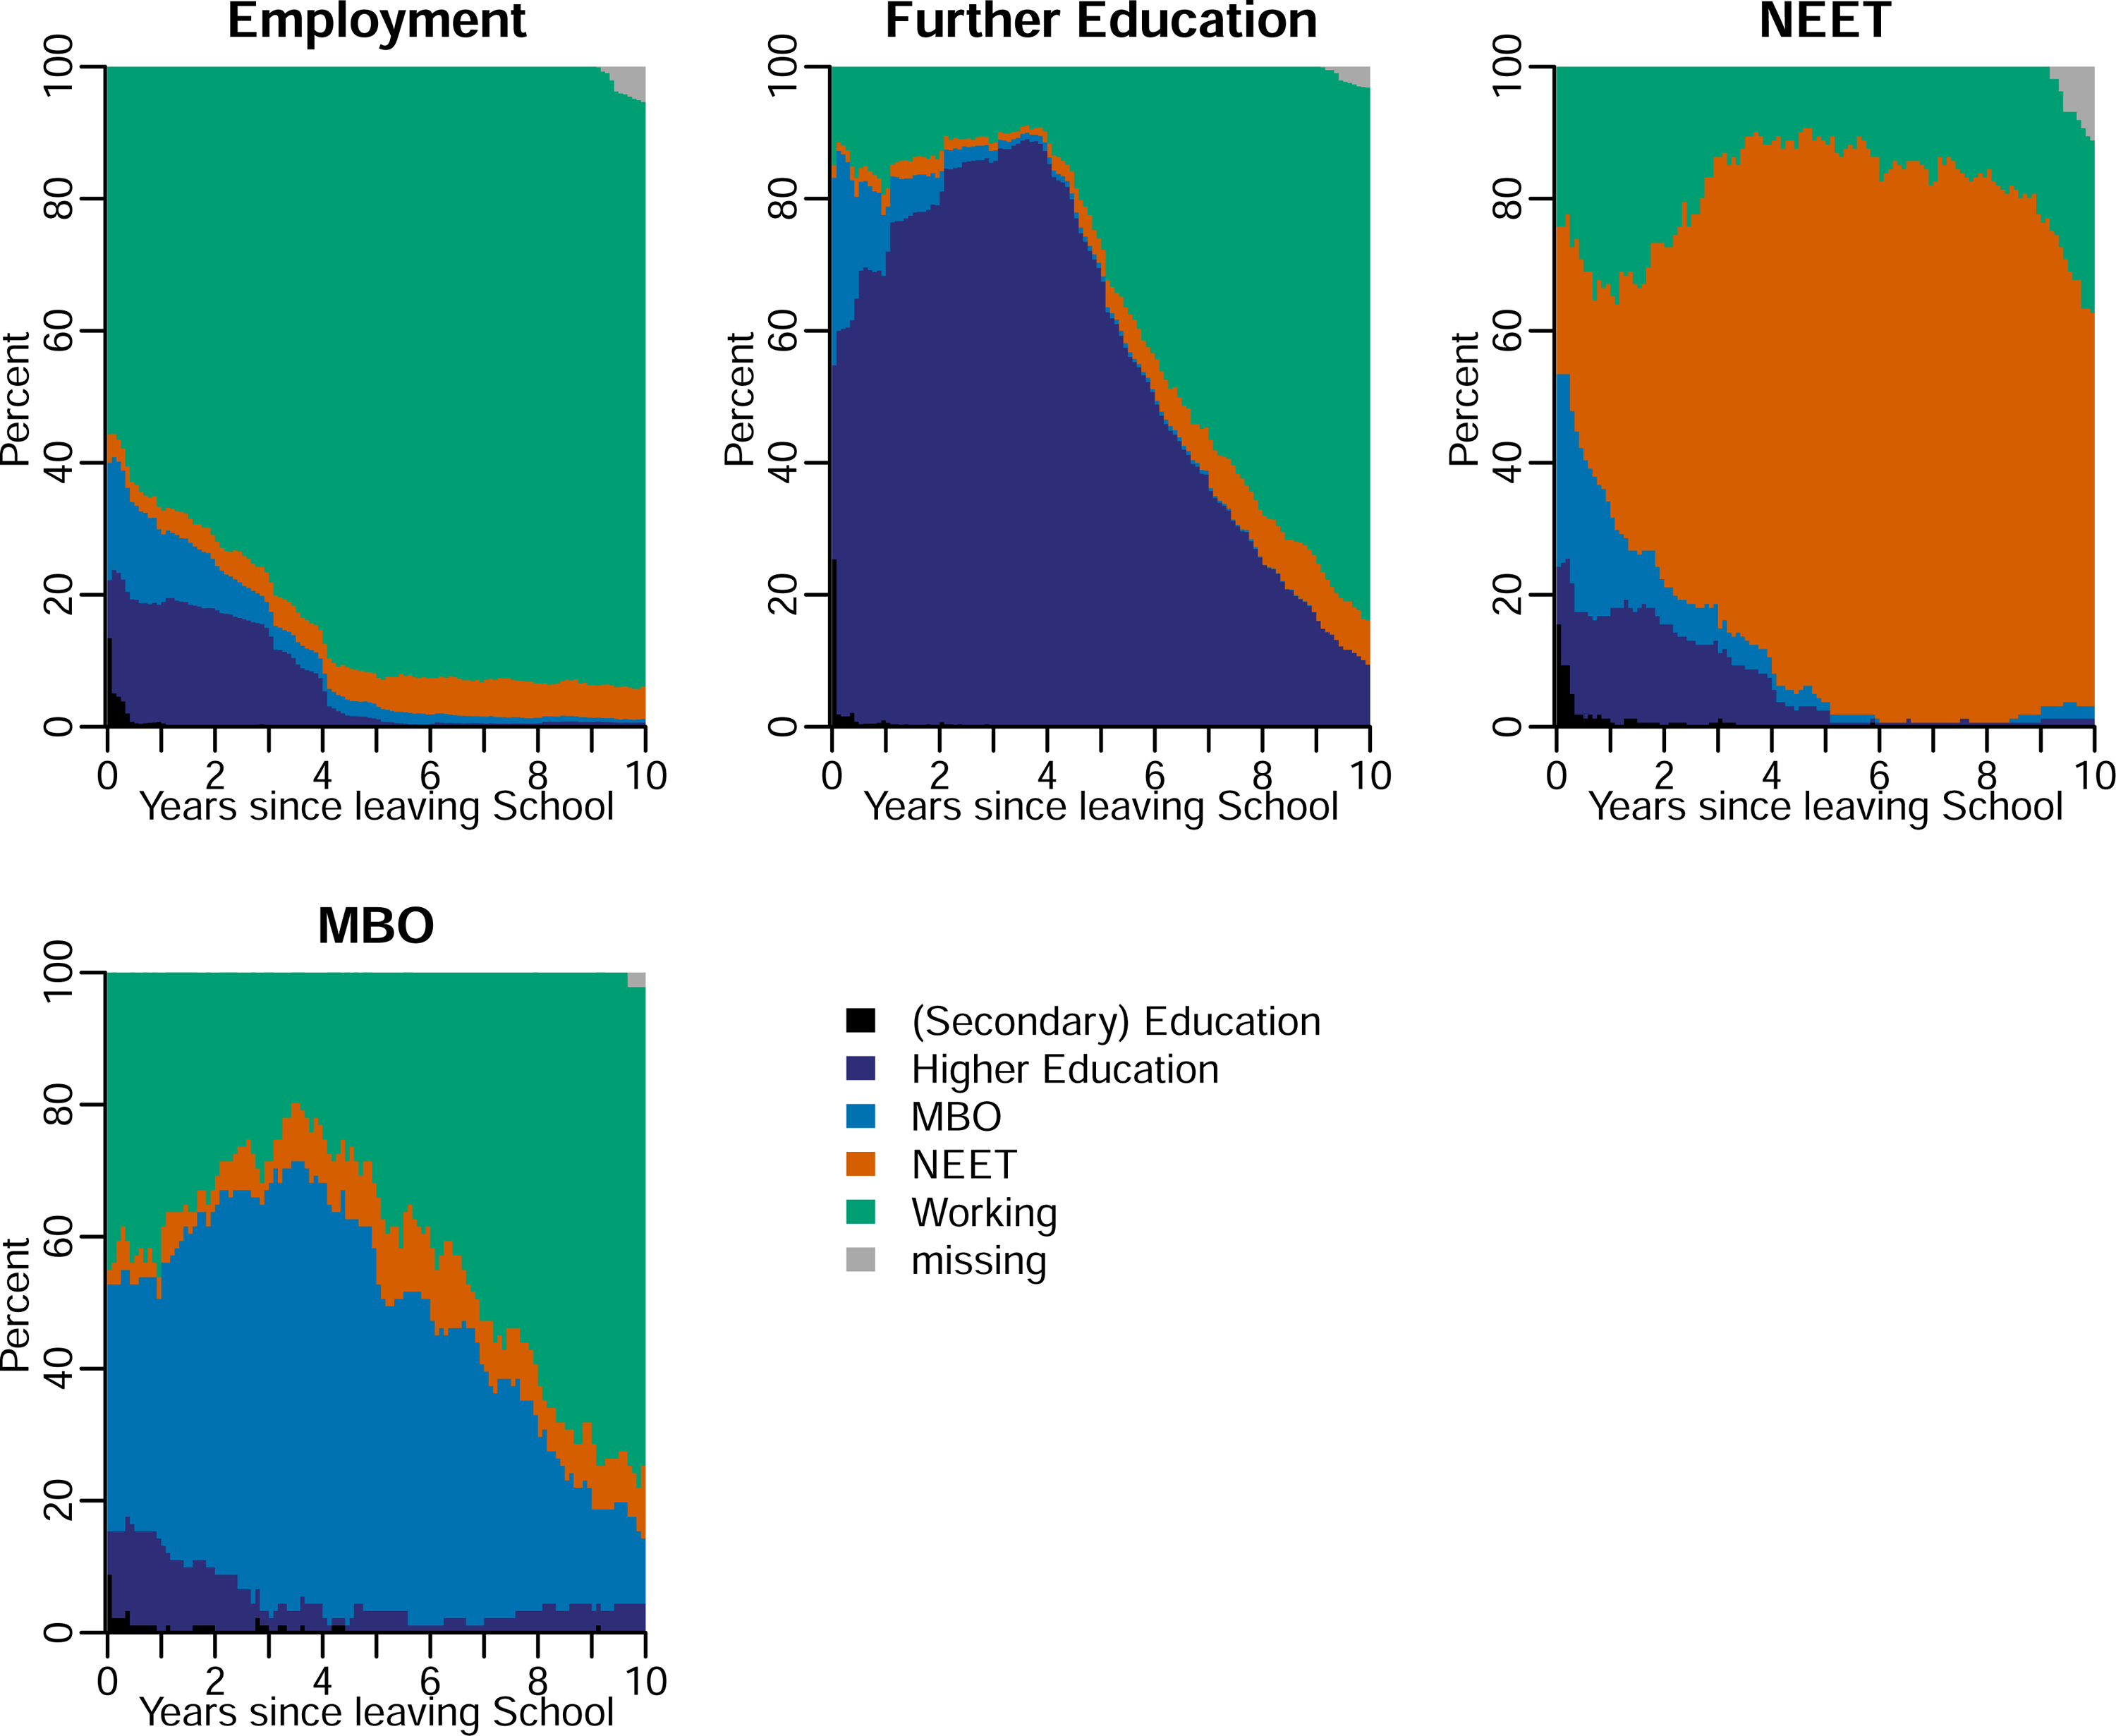
Status proportion plot of four typical post-VET trajectories. Source: Statistics Netherlands, own calculations.
Figure 4 shows the average marginal effects from the multinomial logistic regression of the probability to follow each trajectory. We do not find systematic evidence for associations between automation risk and post-VET trajectories. Depending on the specification and indicator of automation risk, the estimates lack statistical precision. 4 Using the S&F indicator, we do find a statistically significant increased risk to follow a long-term NEET trajectory of 1.4 percentage points after graduating from a high-automation-risk VET program compared to a lower-automation-risk VET program, however only after we include control variables. In hypothesis H1, we expected that a higher automation risk would be associated with an increase in the probability to follow a NEET trajectory. While the direction of the association aligns with our expectations, the evidence is not strong enough to fully support this. We also cannot confirm hypothesis H2, in which we expected that automation risks would increase the probability to follow further education.
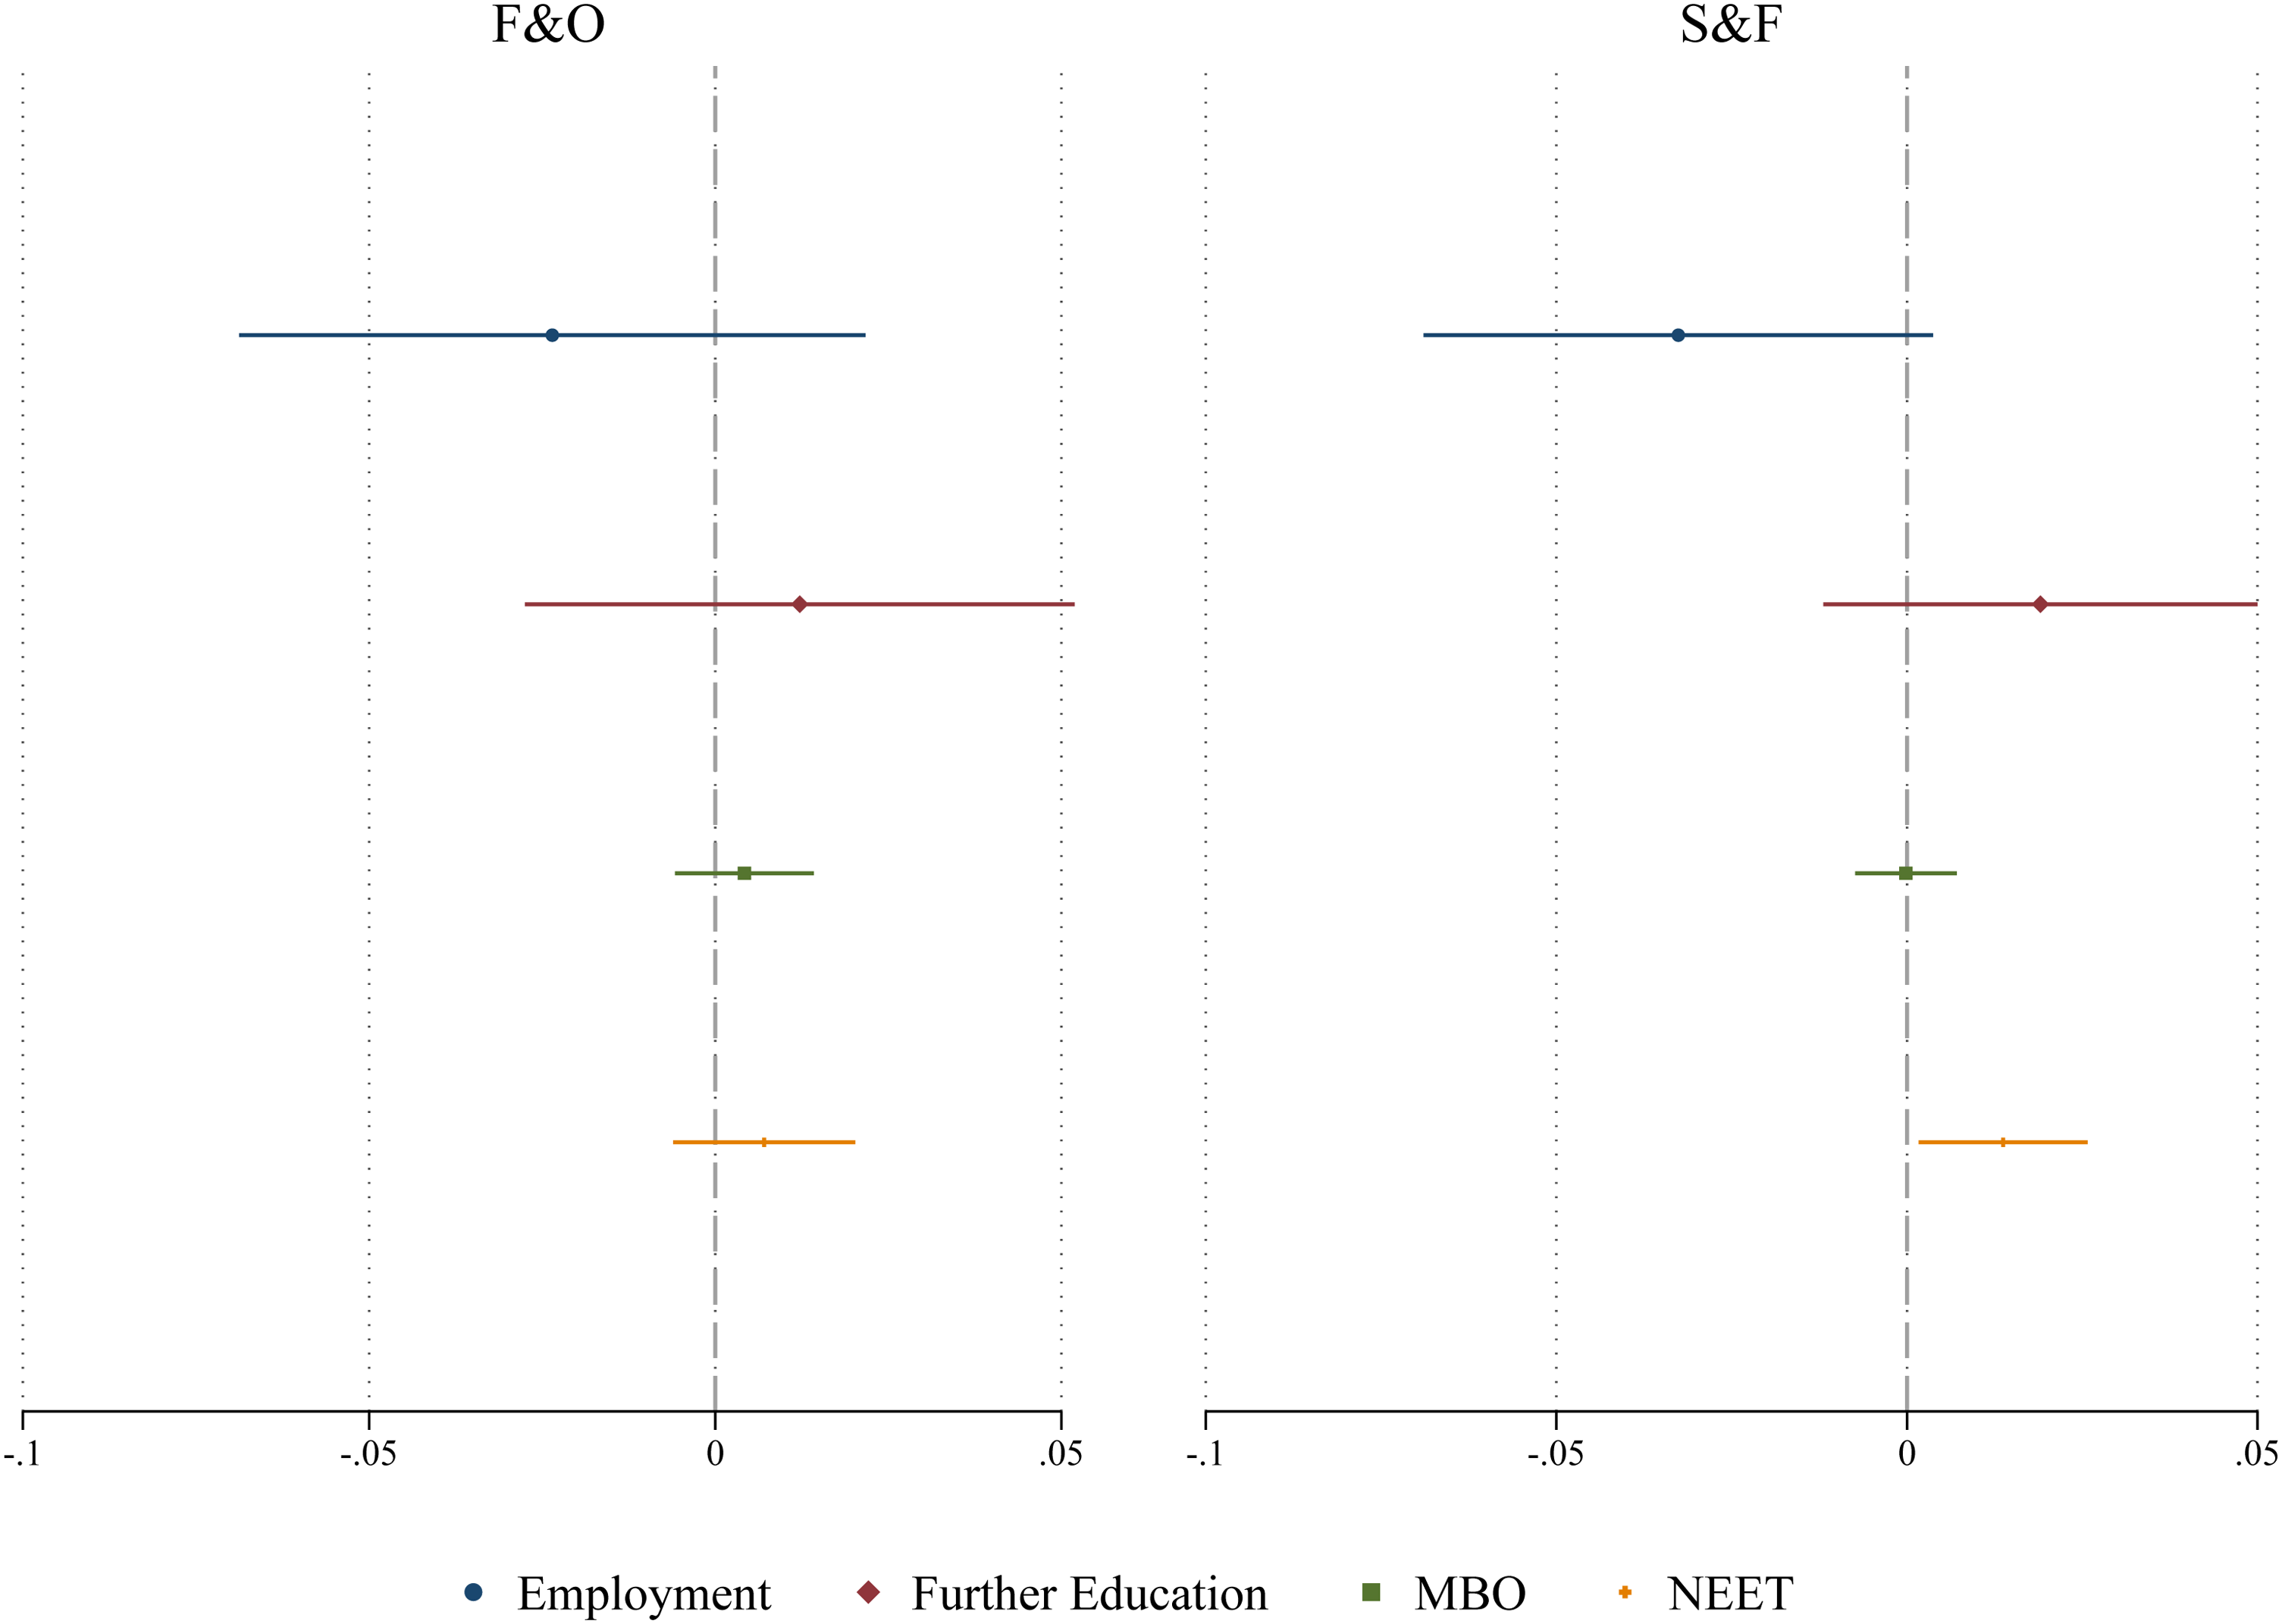
Average marginal effects to follow each early career trajectory by F&O and S&F automation risk measures of MBO programs. Controlled for occupational proportion, field, gender, migration background, MBO level, personality traits, parental education, parental household income. Source: Statistics Netherlands, own calculations.
We also expected that cognitive skills, personality, and social class would moderate the association between automation risk and post-VET trajectories. We find few statistically significant moderations, for example: a higher parental household income positively moderates the association of automation risk and following an MBO trajectory compared to the Employment trajectory. However, for graduates from MBO programs without a high automation risk, the association of parental household income and following the MBO trajectory rather than the Employment trajectory is negative. These moderations only hold with respect to the reference category (Employment) but not when considering overall predicted probabilities.
Automation risk and wage
Consistent with our expectations, graduates from an easier-to-automate VET program have lower starting wages than VET graduates from programs with a lower automation risk (Figure 5).
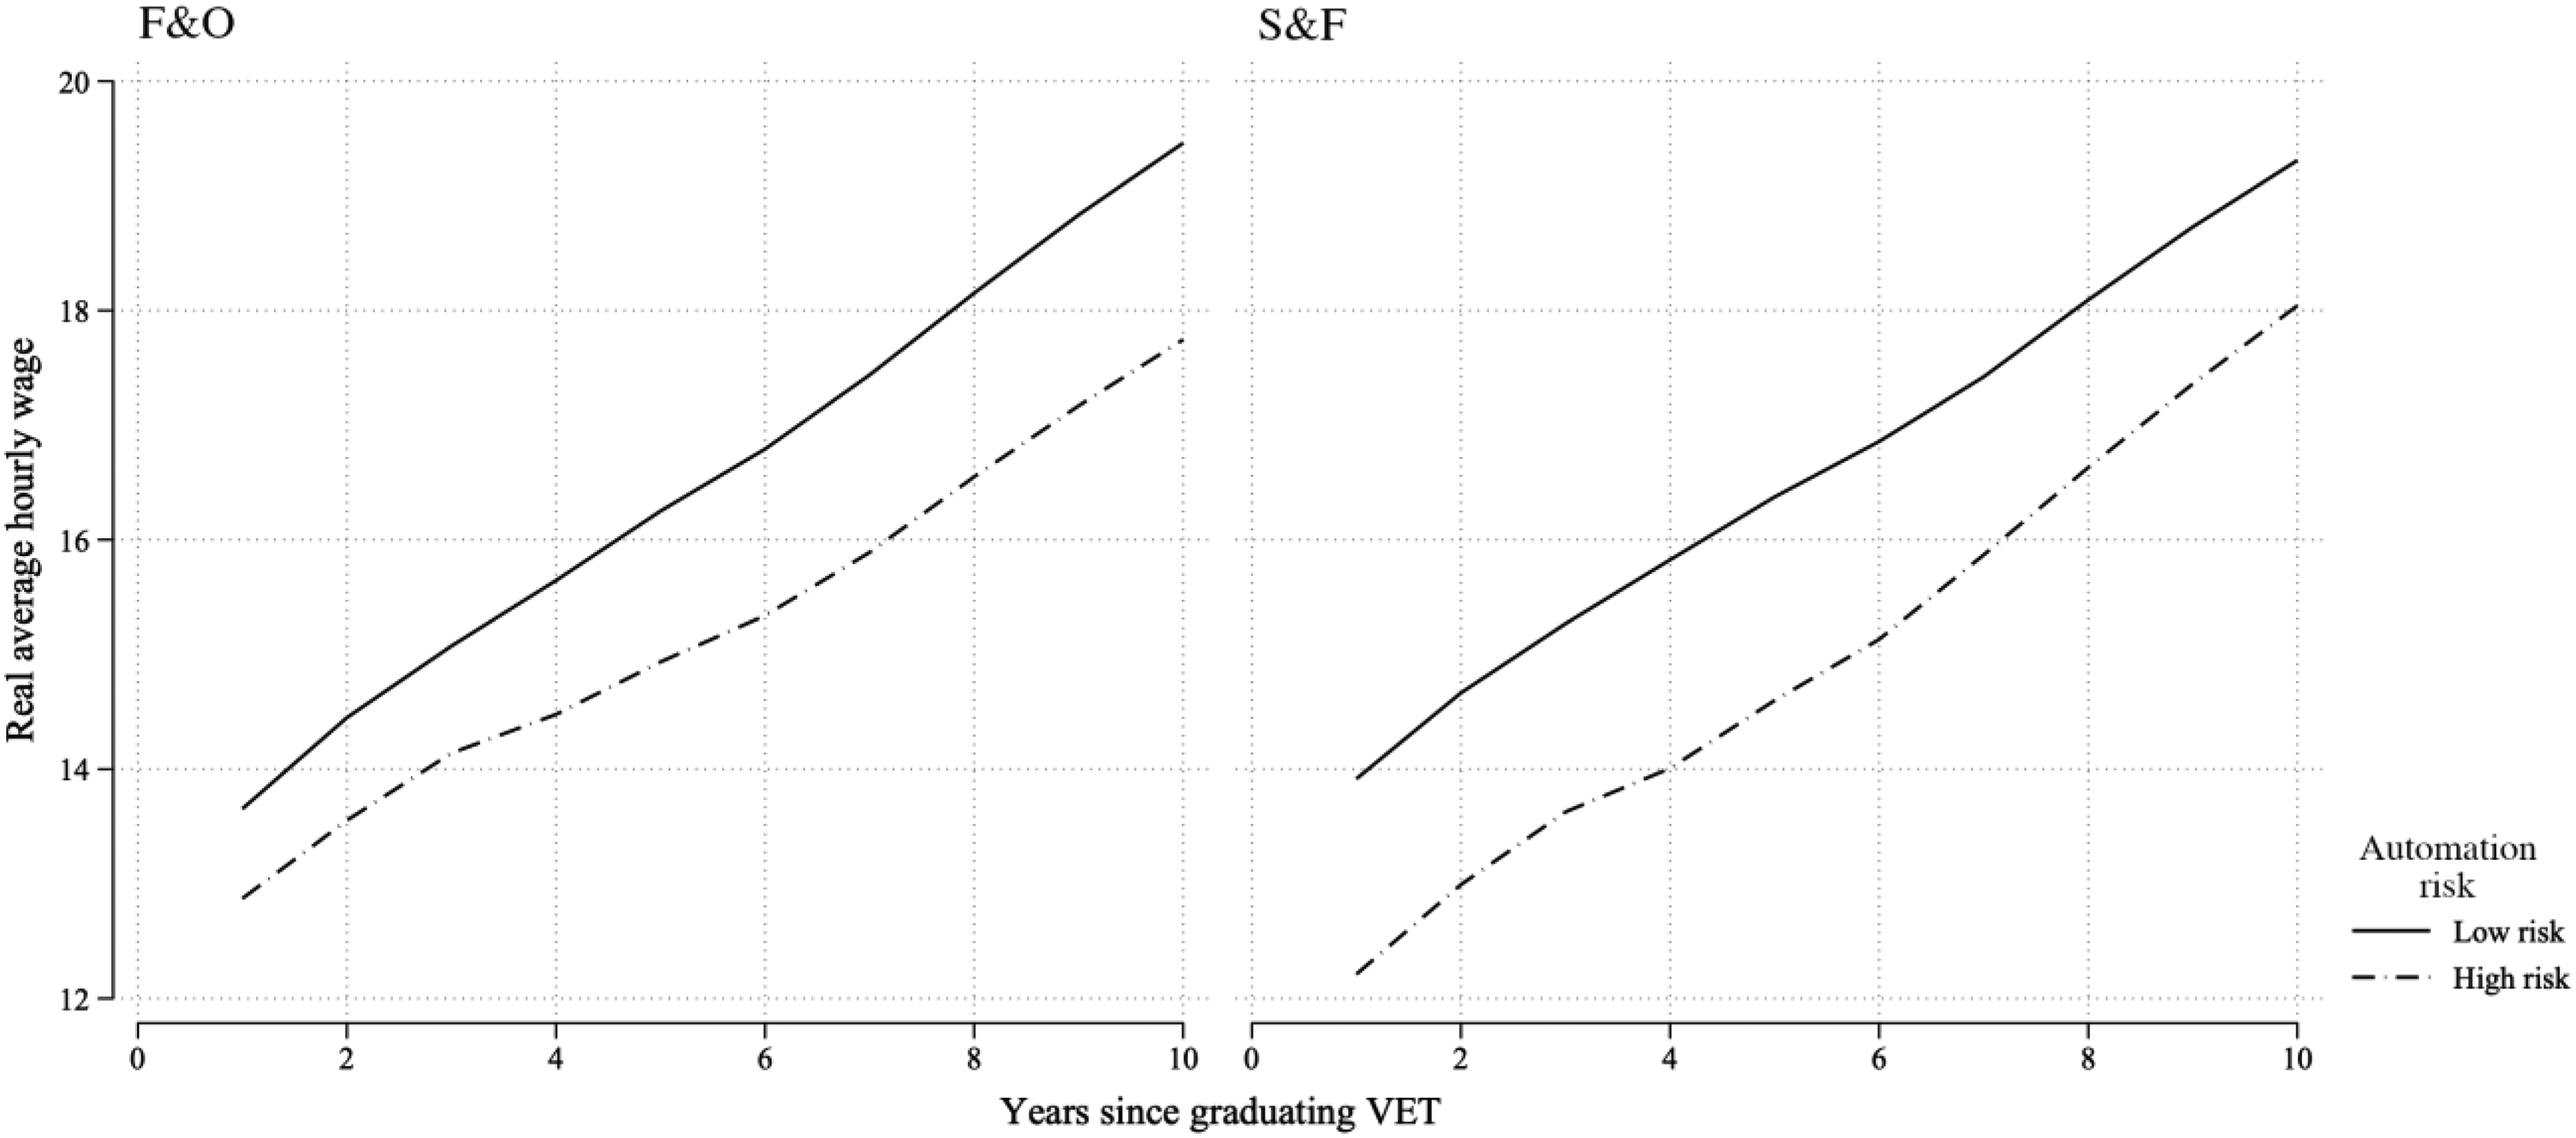
Average wage profiles of vocational education graduates by high and low risk of automation measured by two indicators (left: Frey and Osborne, F&O, right: Somers and Fouarge, S&F). Source: Statistics Netherlands, own calculations.
Model GC1 (see Table 2) includes the interaction of time (years since VET) and automation risk to test whether wage growth varies with automation risk. 5 The coefficient of automation risk now represents the association of automation risk with wages at 1 year since graduation (year since VET = 0. We can interpret this as a reduction in starting wages of 9.9 percentage points (S&F, p < .01) for high automation-risk programs compared to low automation-risk programs. However, using the F&O indicator we find a reduction of only 4.7 percentage points, which is not statistically significant. Based on this mixed evidence, we cannot fully accept hypothesis H3. Furthermore, we do not find that automation risk is negatively associated with wage growth. That might be partly explained by collective agreements made on the sectoral level in which wage increases are mainly determined by largely fixed wage scales.
Random-effects growth curve models of log hourly wages on automation risk of VET programs.
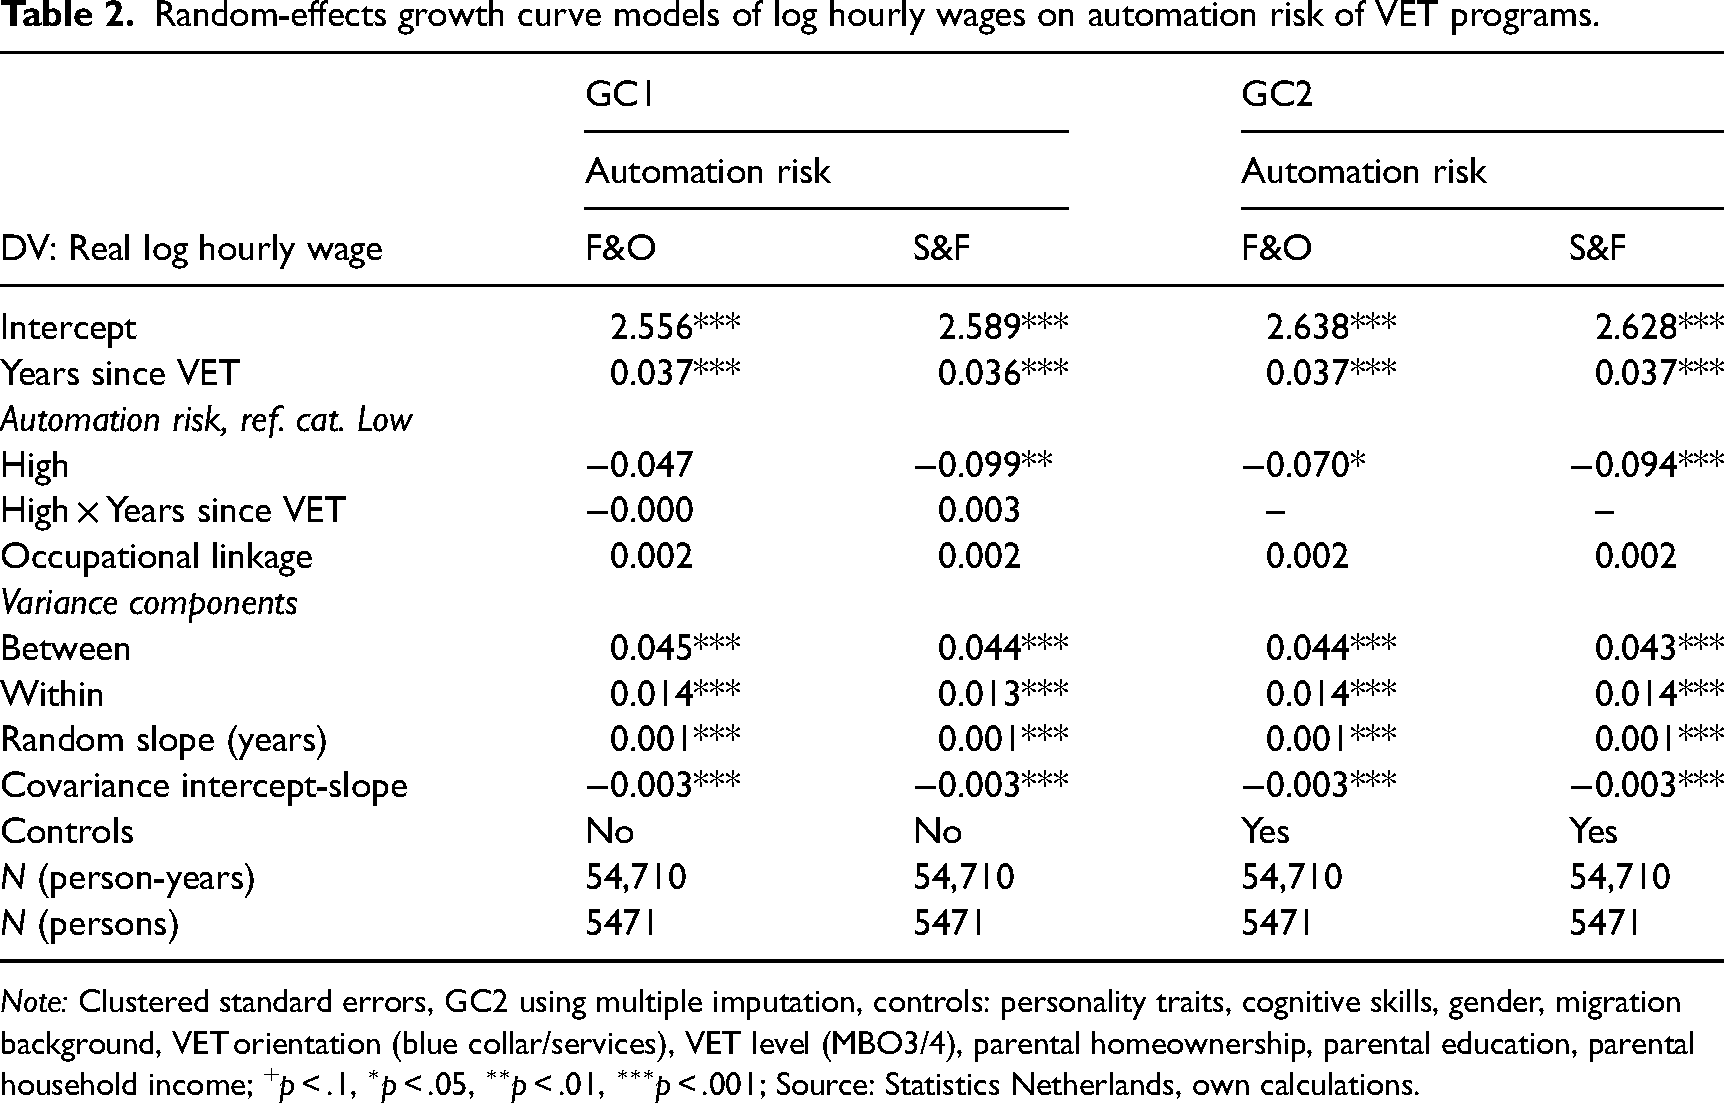
Note: Clustered standard errors, GC2 using multiple imputation, controls: personality traits, cognitive skills, gender, migration background, VET orientation (blue collar/services), VET level (MBO3/4), parental homeownership, parental education, parental household income; +p < .1, ∗p < .05, ∗∗p < .01, ∗∗∗p < .001; Source: Statistics Netherlands, own calculations.
Graduates from easier-to-automate VET programs are clearly being hired for lower-paying jobs. However, differences in growth are not (yet) appearing and our estimates are too imprecise to systematically show differences in starting wages. Overall, our results are in line with the results by Cnossen et al. (2021) who find differences in starting wage but not in growth for different sets of skills learned in VET. In the following models, we, therefore, focus on differences in overall hourly wages and leave out the interaction term of automation risk and time.
In Model GC2 we add additional control variables for the observable confounders, gender, socioeconomic, and immigration background. However, as there might still be unobserved confounders present, the models do not allow for causal interpretation. The S&F coefficient is largely stable to the inclusion of these variables. The F&O coefficient is now more pronounced (
Next, we investigate the moderation of automation risk by cognitive skills and personality. We find statistically significant interactions for emotional stability (positive for F&O), extraversion (negative for F&O, p < .01), agreeableness (negative for F&O, p < .01 and S&F, p < .10), and autonomy (positive for F&O, p < .01 and S&F, p < .05). 7 The results are shown in Table 3 and the interactions (for F&O) are presented in Figure 6(a). In all plots, we see that lower automation-risk VET programs (coded as 0, toward the left) are associated with higher average wages than high automation-risk VET programs (on the right). The different lines show how the association of automation risk and wage varies with different levels of cognitive skills and personality traits. For conscientiousness, we find no evidence of compensation (H7). For autonomy and emotional stability, we find results in line with the compensation mechanism in hypotheses H8 and H9. The results using the S&F indicator are largely in line with these, however of lower magnitude and less precision (see Figure 6(b)).
Selected coefficients from random-effects growth curve models of log hourly wages on automation risk of VET programs interacted with personality traits and cognitive skills.
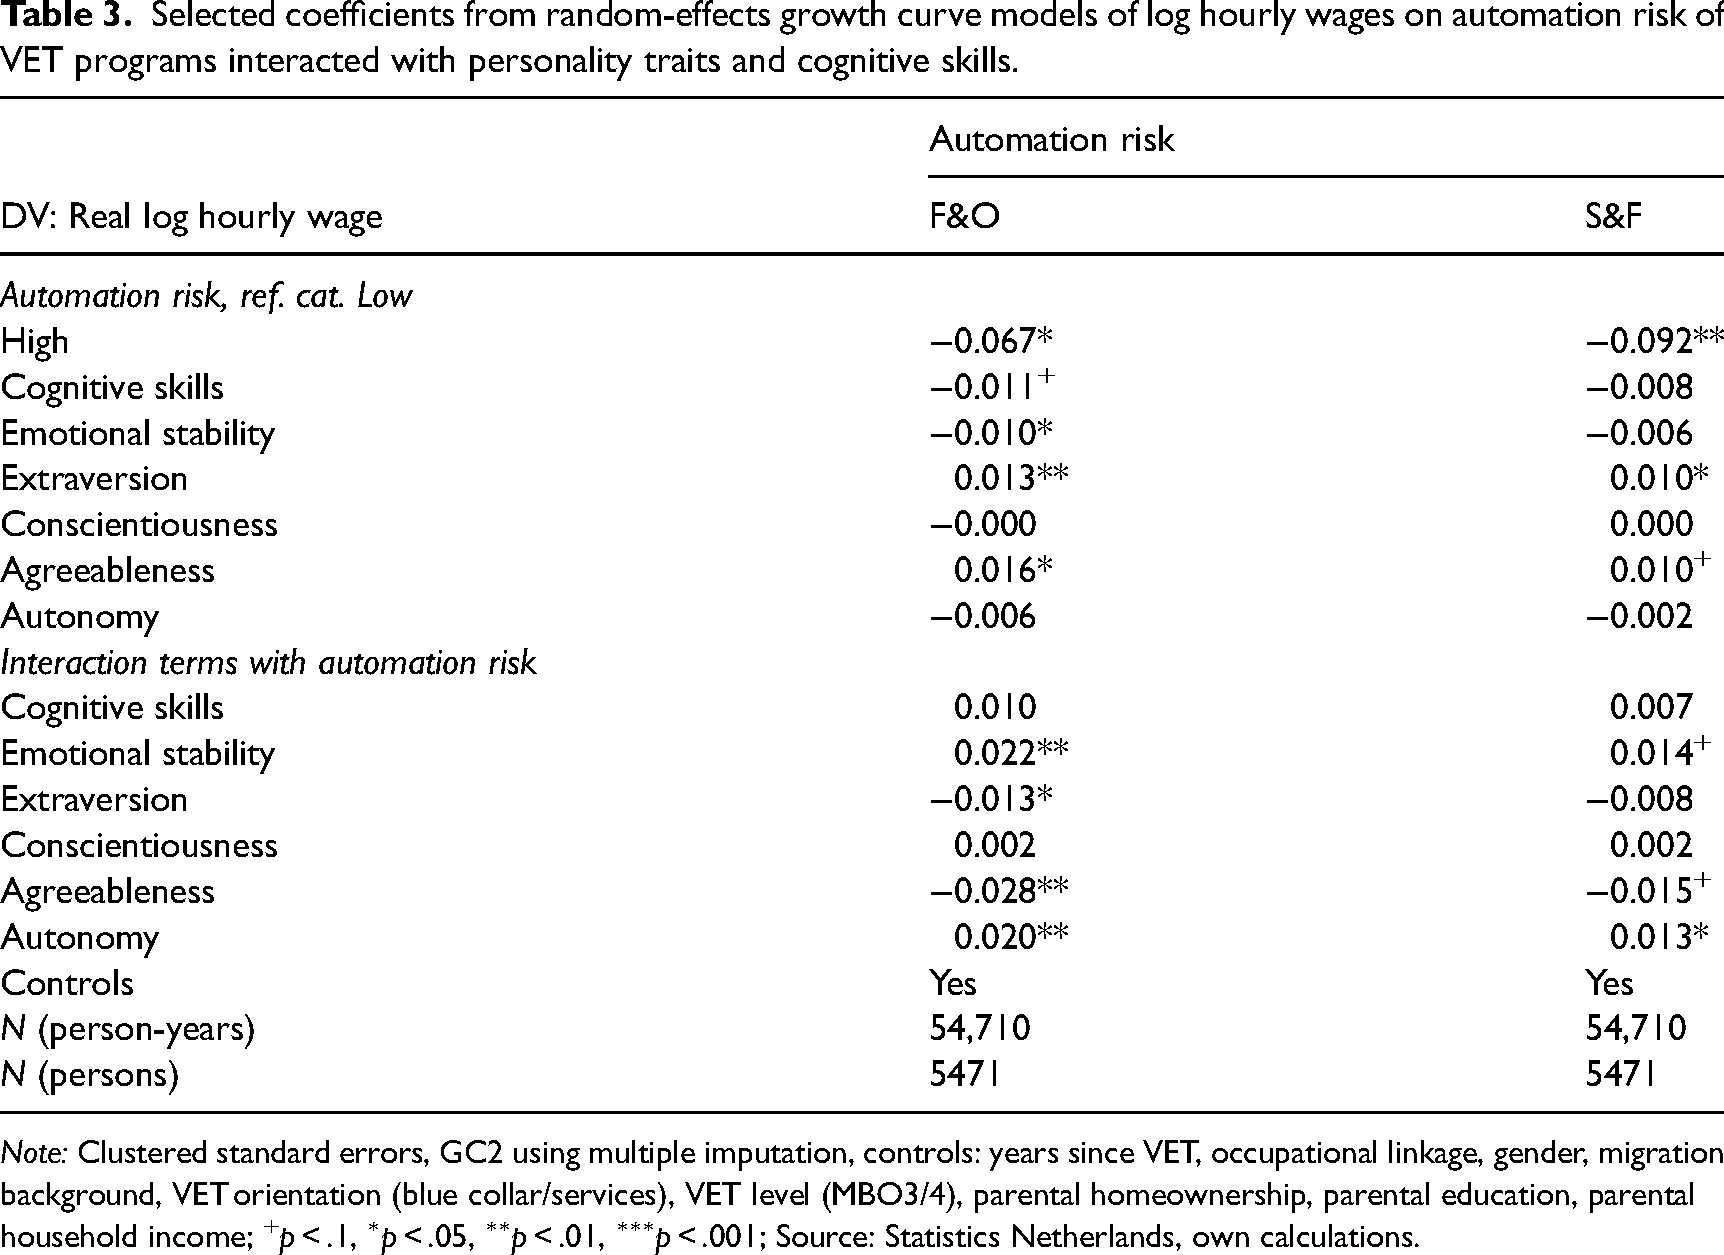
Note: Clustered standard errors, GC2 using multiple imputation, controls: years since VET, occupational linkage, gender, migration background, VET orientation (blue collar/services), VET level (MBO3/4), parental homeownership, parental education, parental household income; +p < .1, ∗p < .05, ∗∗p < .01, ∗∗∗p < .001; Source: Statistics Netherlands, own calculations.
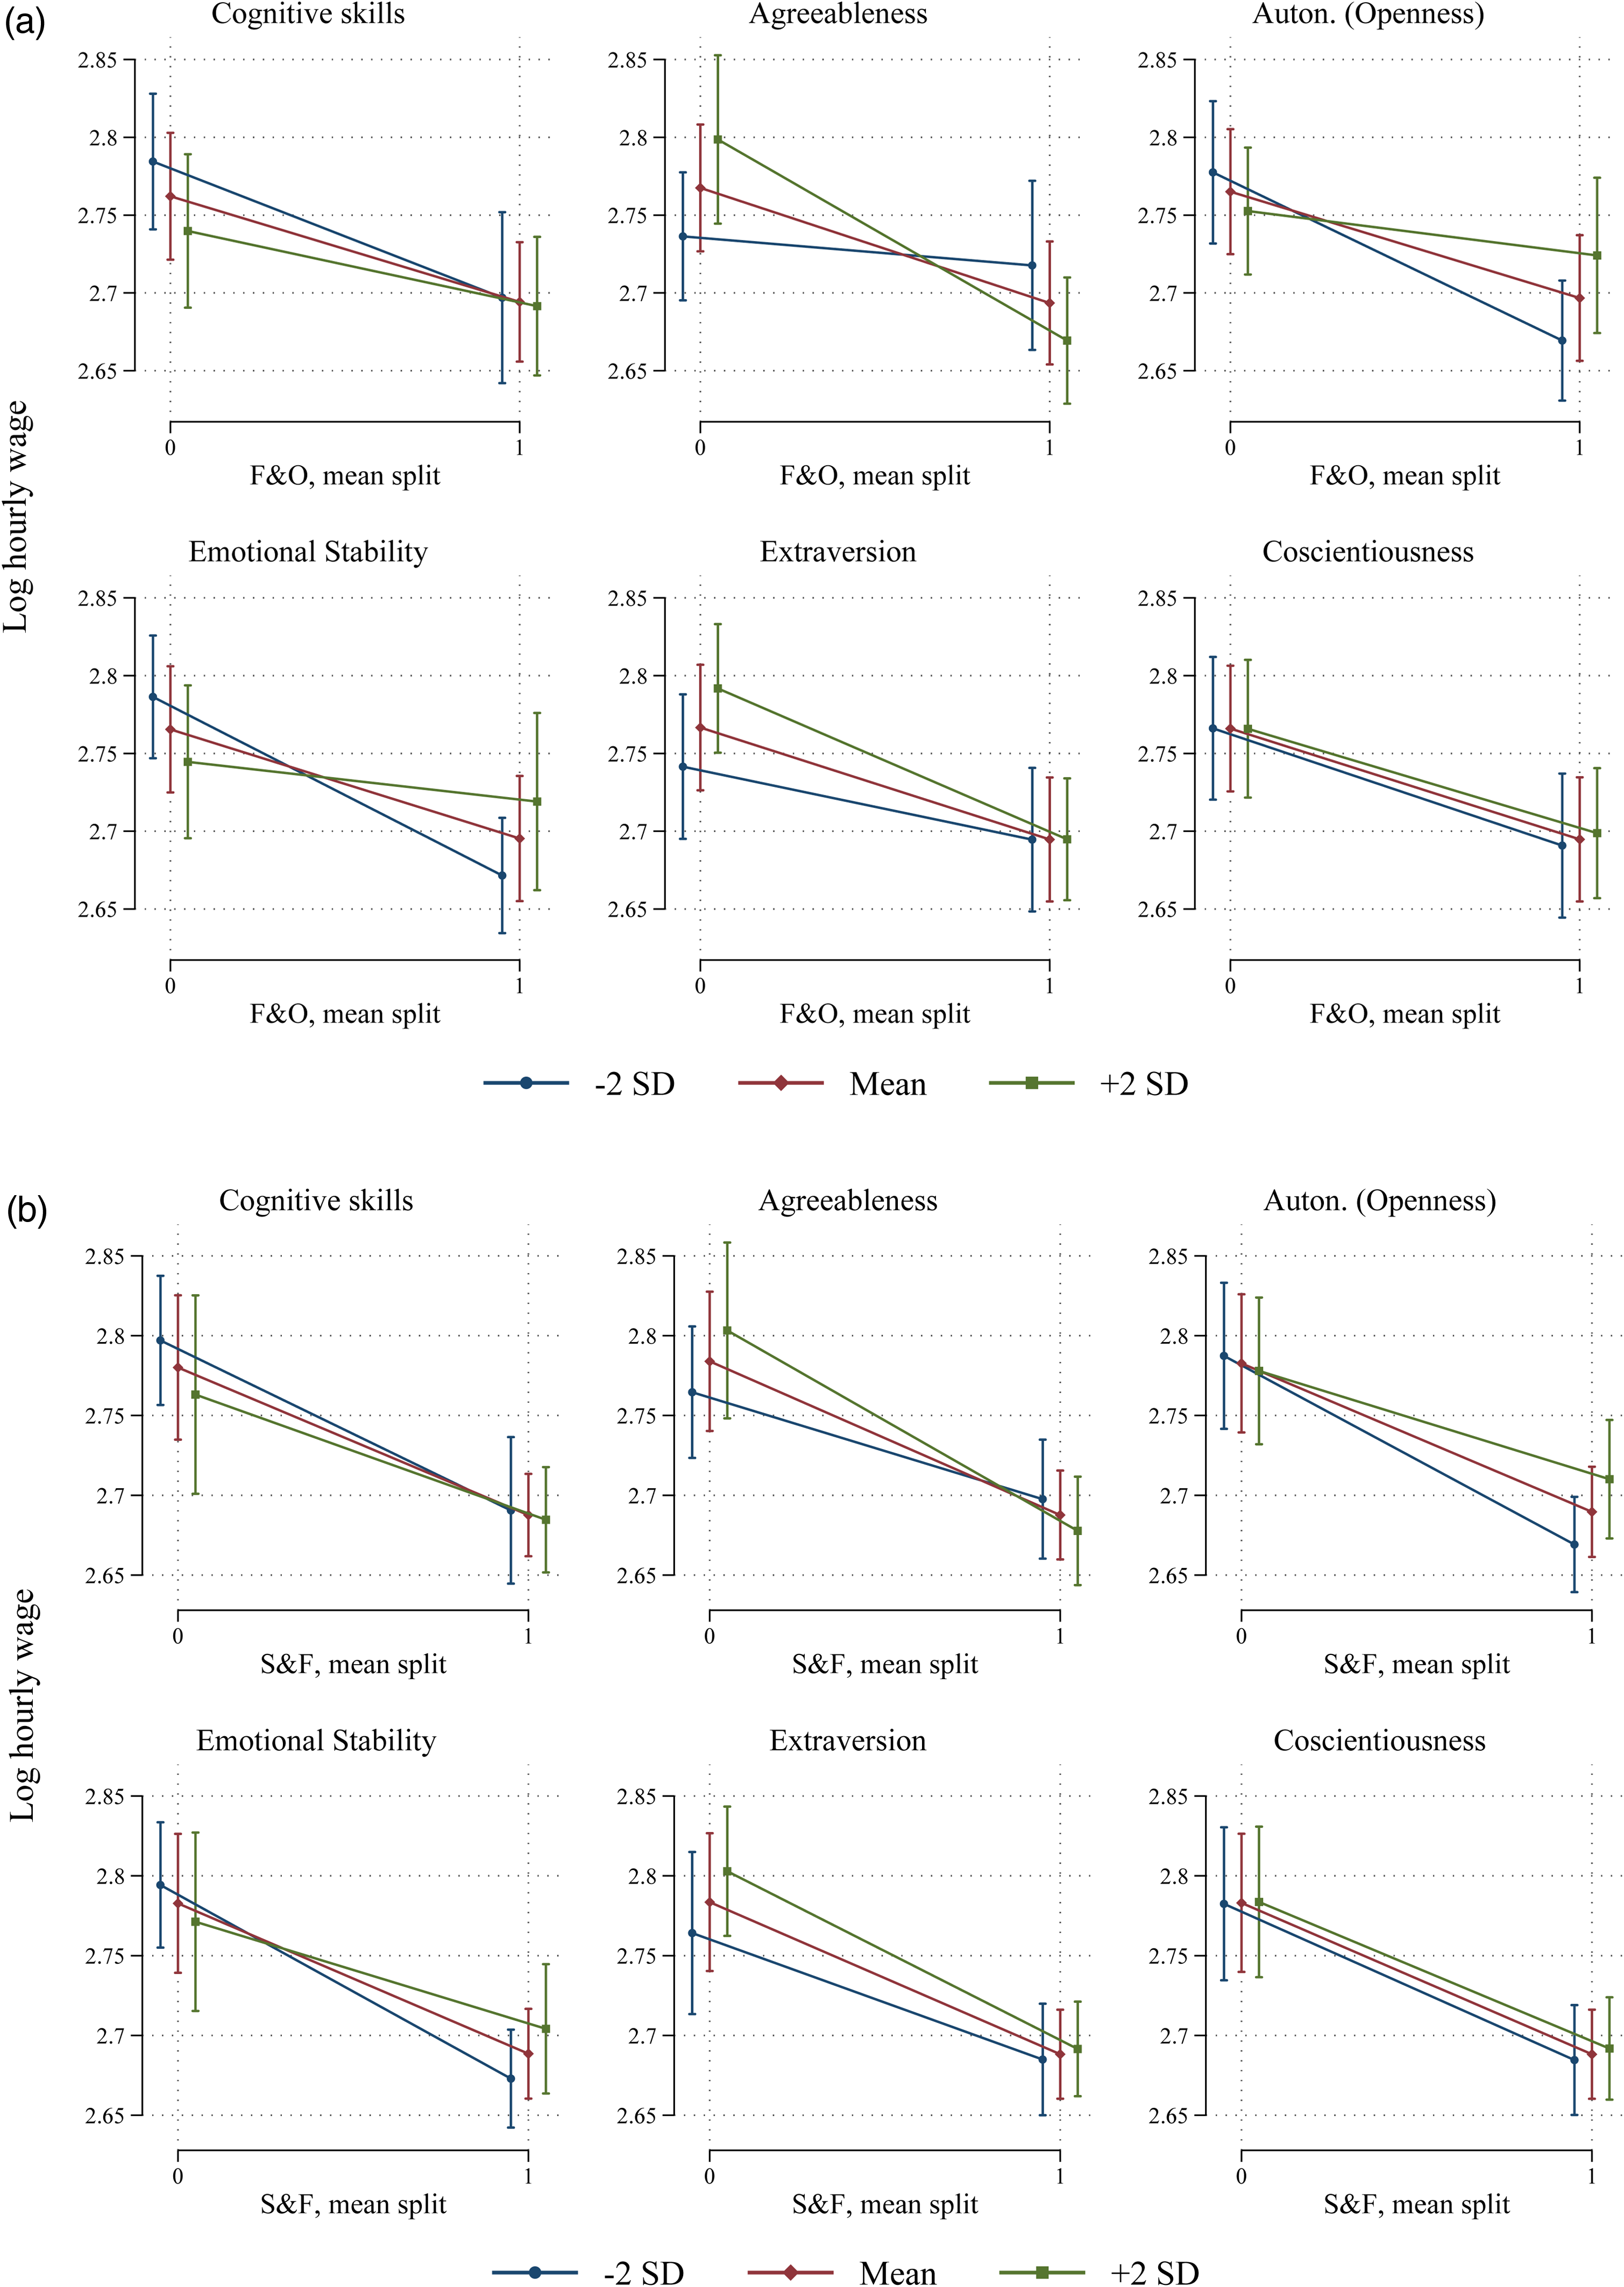
(a) Coefficient plots of predicted log hourly wage by levels of automation risk (F&O) interacted with cognitive skills and personality traits. (b) Coefficient plots of predicted log hourly wage by levels of automation risk (S&F) interacted with cognitive skills and personality traits. Source: Statistics Netherlands, own calculations.
Next, we move to the hypothesized moderation of automation risk by social class. While we do not find any evidence for compensation of automation risk by parental education or parental homeownership (results are shown in Appendix H) we find statistically significant interactions for parental household income (Table 4). For those who grew up in high-income families, graduating from an easier-to-automate VET program is less penalizing for their wages.
Selected coefficients from random-effects growth curve models of log hourly wages on automation risk of VET programs interacted with parental household income.
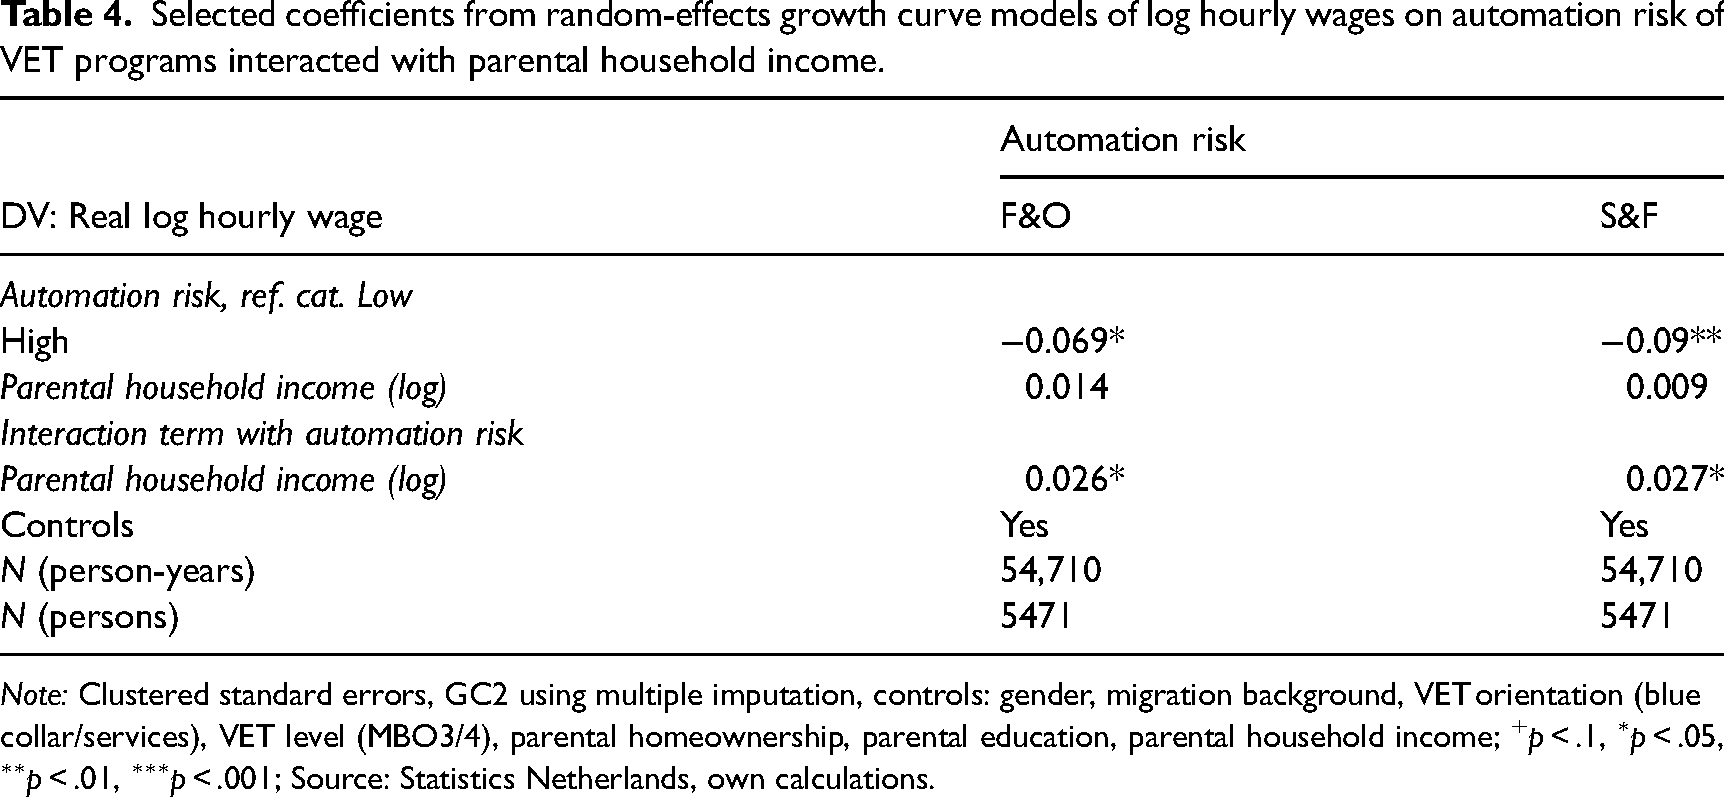
Note: Clustered standard errors, GC2 using multiple imputation, controls: gender, migration background, VET orientation (blue collar/services), VET level (MBO3/4), parental homeownership, parental education, parental household income; +p < .1, ∗p < .05, ∗∗p < .01, ∗∗∗p < .001; Source: Statistics Netherlands, own calculations.
Conclusion and discussion
We have provided the first analysis of the role of automation risk in the early career of VET graduates in the Netherlands, a country with very low unemployment rates which we contextualized as a least-likely case. We derived measures of automation risk of VET programs in the Netherlands using the weighted average of automation risk of the occupations that these programs prepare for. Here, we found considerable variation in the automation exposure of VET programs. The lowest automation risks were found in health and care-related fields, and the highest risks in secretarial and administrative VET programs. Next, we asked what this means for school-to-work transitions and early careers of VET graduates. Using sequence analysis, we found four post-VET trajectories. We hypothesized that automation risks would be associated with an increase in the probability to follow a NEET trajectory and that it would be associated with an increase in the probability of VET graduates to continue with education. However, we did not find systematic evidence to support this. Apparently, automation risks of VET programs are not (yet) driving young graduates out of employment. In fact, in the Netherlands, very few VET graduates follow a long-term NEET trajectory at all. In addition, we expected automation risk to be negatively associated with wages. We found lower average wages—but not lower wage growth—for graduates from easier-to-automate VET programs. As we only look at the first 10 years of the career, differences in wage growth trajectories might still become apparent at a later age. Moreover, in the Netherlands, wage growth is largely determined by collective agreements and wage scales on the sectoral level. Depending on the automation risk indicator used, the results largely show the same tendency. However, it is apparent that the way one assesses the risk of automation impacts the results, which might be an important question for future research.
This brings us to the limitations of our analyses. First, our measures of automation risk are indirect. Merging occupation codes to Dutch education programs is imperfect, and measurement error is inevitable. We tried to account for this by using two different measures of automation risk and by controlling for the occupational linkage, which is an indicator of matching quality. Still, we could only differentiate VET level-field combinations. Future studies should aim to differentiate VET programs instead and measure the automation risks of educational programs more directly. Second, as there are no occupations data available in the Dutch register data, we could not confirm that VET graduates work in the occupations they were trained for. Hence, we cannot control the occupation that graduates sort into, or their task content. It might be the case, that the task composition of jobs differs from the task composition of the vocational training, or that the task composition of the job is an unobserved confounder of our relationship of interest. Third, we only focused on MBO3/4. While we based this choice on the notion that these medium-educated graduates will be the most affected by automation risks and because vocational education is more standardized than tertiary education, future studies could still try to include a wider range of educational degrees. The tracked education system will lead to strong path dependence, which would likely necessitate separate analyses for students from vocational and general tracks regardless. Fourth, our results should not be interpreted as causal effects. While we did control for the most important observable confounders and did include individual random effects in the growth curve model, there are time-varying and unobservable confounders that we could not control for. Most importantly, we lack measurements of the actual skills learned in the different VET programs and the use of such skills and tasks at work. Still, our results provide the first descriptive, longitudinal evidence to the debate of automation risk and vocational training. Lastly, future research could investigate whether the proposed compensation of automation risk by different factors is indeed additive.
Young people are often thought to be the most vulnerable in economically uncertain times. Surely, automation will be a challenge to workers in the future and new social inequalities might emerge. Policymakers should remain vigilant of the disruptive nature of labor automation and scrutinize and future-proof the skills that are taught in vocational education.
Supplemental Material
sj-docx-1-asj-10.1177_00016993241250277 - Supplemental material for Automation risks of vocational training programs and early careers in the Netherlands
Supplemental material, sj-docx-1-asj-10.1177_00016993241250277 for Automation risks of vocational training programs and early careers in the Netherlands by Alexander Dicks, Annemarie Künn-Nelen, Mark Levels and Raymond Montizaan in Acta Sociologica
Footnotes
Acknowledgments
We would like to thank the participants of the TECHNEQUALITY project for their helpful comments during various meetings. We would also like to thank Sander Dijksman and Didier Fouarge for their help with the matching of occupation and education codes.
Funding
The author(s) disclosed receipt of the following financial support for the research, authorship, and/or publication of this article: This article has received funding from the European Union's Horizon 2020 research and innovation program under Grant Agreement No. 822330 “TECHNEQUALITY. Technological inequality—understanding the relation between recent technological innovations and social inequalities” and the NWO's Research program Open Research Area Plus under the file number 464-15-186 “Understanding NEETS. Individual and institutional determinants of youth inactivity in France, Germany, Japan, the Netherlands, and the UK.”
Supplemental material
Supplemental material for this article is available online.
Notes
Author biographies
References
Supplementary Material
Please find the following supplemental material available below.
For Open Access articles published under a Creative Commons License, all supplemental material carries the same license as the article it is associated with.
For non-Open Access articles published, all supplemental material carries a non-exclusive license, and permission requests for re-use of supplemental material or any part of supplemental material shall be sent directly to the copyright owner as specified in the copyright notice associated with the article.