
Abstract
In this research note, we analyze the impact of the COVID-19 pandemic on cultural participation. We use rich survey data from Denmark to construct pooled time-series cross-sectional data for each month of the years 2019–2021 and report three findings. First, participation in physical cultural activities (e.g. attending a concert or a museum) plummeted during two lockdowns and did not return to its pre-pandemic level by the end of 2021. Second, participation in digital activities (e.g. reading a digital book or following a museum on social media) did not change much during the pandemic. Overall, we find little evidence of substitution from physical to digital cultural participation during the COVID-19 lockdown in Denmark. Third, socioeconomic gradients in cultural participation decreased during the pandemic for physical cultural participation, but did not change for digital cultural participation. We end by discussing what we can learn from our results about how social disruptions affect patterns of cultural participation and inequality.
Introduction
The COVID-19 pandemic had a profound impact across societal domains such as public health (Marin et al., 2020), the economy (Brodeur et al., 2021), inequality (Wachtler et al., 2020), and children's schooling (Betthäuser et al., 2023).
How did the pandemic affect cultural participation, and what can we learn from the pandemic about the role of institutions in shaping cultural inequality? While research has addressed the consequences of the pandemic for cultural producers (Comunian and England, 2020; Eikhof, 2020) and institutions (Davies, 2020; Weed, 2020), we know little about how the pandemic affected (inequality in) individuals’ cultural participation. The lockdown and reopening of cultural institutions represent an interesting case for studying how cultural inequality depends on the supply of cultural offerings and not only reflects socioeconomic gradients in individuals’ cultural tastes. Furthermore, it is an ideal case for studying if disruptions in the supply of cultural offerings caused a shift toward digital cultural participation, as suggested by the OECD (2020) and UNESCO (2021, 2022). Feder et al. (2022) report no clear changes in inequality in participation in out-of-home cultural participation in England. Codagnone et al. (2021) find little change in cultural participation in Spain, the United Kingdom, and Italy compared to normal (i.e. pre-pandemic). Other research finds that many individuals took up new “at-home” activities during the first lockdown or refined those in which they already engaged (e.g. reading, cooking, and arts and crafts; Bone et al., 2022; Choi et al., 2020; Roberts, 2020). Consequently, the limited evidence we have provides no clear picture of how the pandemic affected inequality in cultural participation, but suggests that there was “consumption displacement” (Hall et al., 2021) from out-of-home to at-home and online activities.
In this research note, we use rich survey data from Denmark
1
to analyze trends and inequality in physical and digital cultural participation before (2019) and during the first (spring and summer of 2020) and second (early 2021) COVID-19 lockdowns. We use survey data with representative samples of the adult Danish population (sampled every quarter and collected evenly throughout 2019, 2020, and 2021). Unlike existing research, our data enable us to construct monthly time series based on representative samples that cover three full calendar years (2019–2021). Moreover, we link survey data on respondents’ cultural participation with high-quality data from administrative registers on respondents’ socio-demographic characteristics. This enables us to analyze if socioeconomic gradients in physical and digital cultural participation, as captured by differences in respondents’ education and income, changed during the COVID-19 pandemic. Our data include indicators of respondents’ physical attendance in the last 3 months at a live concert, museum, cinema, library, amusement park, performing arts, and sport event. They also include indicators of respondents’ digital participation, including reading via digital devices, using online library services, following museums on social media, and watching sport or performing arts events (TV/internet/app). We address three research questions (RQs): How did cultural participation, physical and digital, change over the period 1 January 2019 to 31 December 2021?
To what extent did digital cultural participation replace physical participation during the first (13 March – 18 May 2020) and second (16 December 2020–21 April 2021) lockdown?
Did socioeconomic gradients in cultural participation change during the two lockdowns, compared to their pre-pandemic level?
The main results from our empirical analyses are as follows. First, physical cultural participation plummeted during the first and second lockdown, but rebounded to some extent in the interim period. However, it did not recover to its pre-pandemic level by the end of 2021. Second, digital cultural participation did not replace physical cultural participation to any appreciable extent. Generally, we see little change in digital participation during the two lockdowns (and in the period 2019–2021 in general). Third, socioeconomic gradients in physical (but not in digital) cultural participation, as measured by education and income, decreased during the two lockdowns.
COVID-19 in Denmark
Below, we outline briefly how Danish authorities handled COVID-19 and define the six phases of the COVID-19 pandemic that we use in the empirical analyses.
The public policy response to the COVID-19 pandemic in Denmark (e.g. lockdowns, mandatory use of facemasks, travel bans, and rollout of vaccinations) was similar to that in most other Western, industrialized countries. For example, Denmark scores similarly to most other countries on the Oxford COVID-19 Stringency Index (Hale et al., 2021). The Danish Prime Minister announced a complete lockdown of Denmark on the evening of 11 March 2020, with effect from 13 March. Denmark was more or less completely locked down until 8 May (i.e. for eight weeks), when some parts of the public and private sectors began reopening. During this first lockdown, practically all cultural institutions closed. However, public libraries continued to offer digital services, notably digital books. Cultural institutions gradually reopened from 18 May onward and, from late June 2020, restrictions regarding social distancing were gradually relaxed. Throughout the summer and autumn of 2020, most cultural institutions were open even though they faced restrictions on the number of attendees. This made it difficult for some institutions (in particular, those offering performing arts and musical concerts) to remain fully open. By the fall of 2020, infection rates increased again, and the government announced a second lockdown that lasted from 16 December 2020 to 16 April 2021. During the second lockdown, most cultural institutions closed once more. Beginning 6 May 2021, the government lifted restrictions, which enabled cultural institutions to attract larger crowds (while still facing some restrictions). Throughout the summer of 2021, more restrictions gradually disappeared, with the last restrictions being lifted on 1 September 2021. Infection rates increased again toward the end of 2021, which led the government to reintroduce some restrictions, for example, face masks in public transport and the COVID pass. Most cultural institutions (except libraries) closed again on 18 December 2021.
Based on this timeline, we define six phases of the COVID-19 pandemic in Denmark: (a) pre-pandemic (1 January 2019–12 March 2020), (b) first lockdown (13 March 2020–18 May 2020), (c) first interim period (19 May 2020–15 December 2020), (d) second lockdown (16 December 2020–16 April 2021), (e) second interim period (17 April 2021–17 December 2021), and (f) third lockdown (18–31 December 2021). With the exception of the pre-pandemic period, all phases include some restrictions on individuals and cultural institutions. Consequently, restrictions were not entirely removed in the interim phases between lockdowns; instead, they were somewhat less stringent in these phases.
Data and variables
We analyze survey data on cultural participation collected by Statistics Denmark (SD) on behalf of the Ministry of Culture Denmark. SD fielded surveys with nationally representative samples of the adult Danish population every quarter during 2019–2021. As SD collected data throughout each quarter, we can calculate aggregate rates of participation in physical and digital activities on a monthly basis (we have approximately 1000 respondents per month). SD provides survey weights to correct for sample selection, which we use in all analyses. As far as we are aware, these data provide the most comprehensive and the only time-series data available for mapping cultural participation during several COVID-19 lockdown and interim periods. In addition to the survey data, we merge data from administrative registers. From the registers, we add information on respondents’ education, income, and socio-demographic characteristics (age, sex, immigrant status, and whether the respondent lives in a densely populated area).
The surveys include questions on respondents’ participation in cultural activities within the past 3 months (described below). This time window—3 months—means that we cannot map respondents’ cultural participation exactly onto the different phases of COVID-19 defined above. To address time lag (i.e. respondents reporting retrospectively on what they did in the previous 3 months), we define the two lockdown phases operationally as starting in the calendar month after each lockdown began and lasting until 2 months after each lockdown ended. 2 This approach entails that the 3-month lag we observe in the survey data capture at least 1 month of actual lockdown and at most 2 months without lockdown. Consequently, in the empirical analysis, we define the pre-pandemic period as lasting from 1 January 2019 to 31 March 2020; the first lockdown from April to July 2020; the first interim period from August to December 2020; the second lockdown from January to June 2021; and the second interim period from July to December 2021. As we do not use data from 2022, we do not measure the impact of the December 2021 lockdown. In the Online Appendix, we present results from additional analyses in which we use either a narrower (Online Appendix Table A1) or wider (Online Appendix Table A2) definition of each lockdown phase. Results from these analyses are substantively identical to the ones we present below.
The surveys include information on whether or not respondents participated in a range of physical cultural activities in the past 3 months: (a) concerts, (b) museums, (c) cinema, (d) library, (e) amusement park, (f) performing arts, and (g) sport event. They also include information on whether respondents participated in digital activities: (a) reading digital fiction books (i.e. E-books, audiobooks, or podcasts), (b) using online library services, (c) following museums on social media, (d) watching sport events via TV/internet/social media/radio, and (e) watching performing arts via TV/internet/app. The questions on watching a sport event or performing arts did not include a specific time window, which means these questions capture whether, at the time of the interview, the respondent engaged in these activities.
To capture socioeconomic gradients in cultural participation, we use data from the administrative registers to create two binary indicators of socioeconomic position. The first indicator is education, which we capture via a dummy variable for having completed a college degree (defined as any type of higher education at a university college or university). The second indicator is income, which we capture via a dummy variable for having a total disposable income above (vs. below) the median in the sample. We measure income as a binary variable as this makes it simpler to interpret results from regression models with interaction terms. Supplementary analyses in which we use continuous measures of income (percentile rank) and education (years of education) lead to identical results (see Online Appendix Tables A3 and A4).
Results
We present our main empirical results in Figures 1 and 2. In addition to visual representations in Figures 1 and 2, below we present results from regressions of cultural participation that control for the COVID-19 phase, respondents’ socioeconomic position and socio-demographic characteristics, and month-fixed effects. The month-fixed effects control for seasonal trends in cultural participation, for example, some activities being more frequent than others during the summer or winter period.
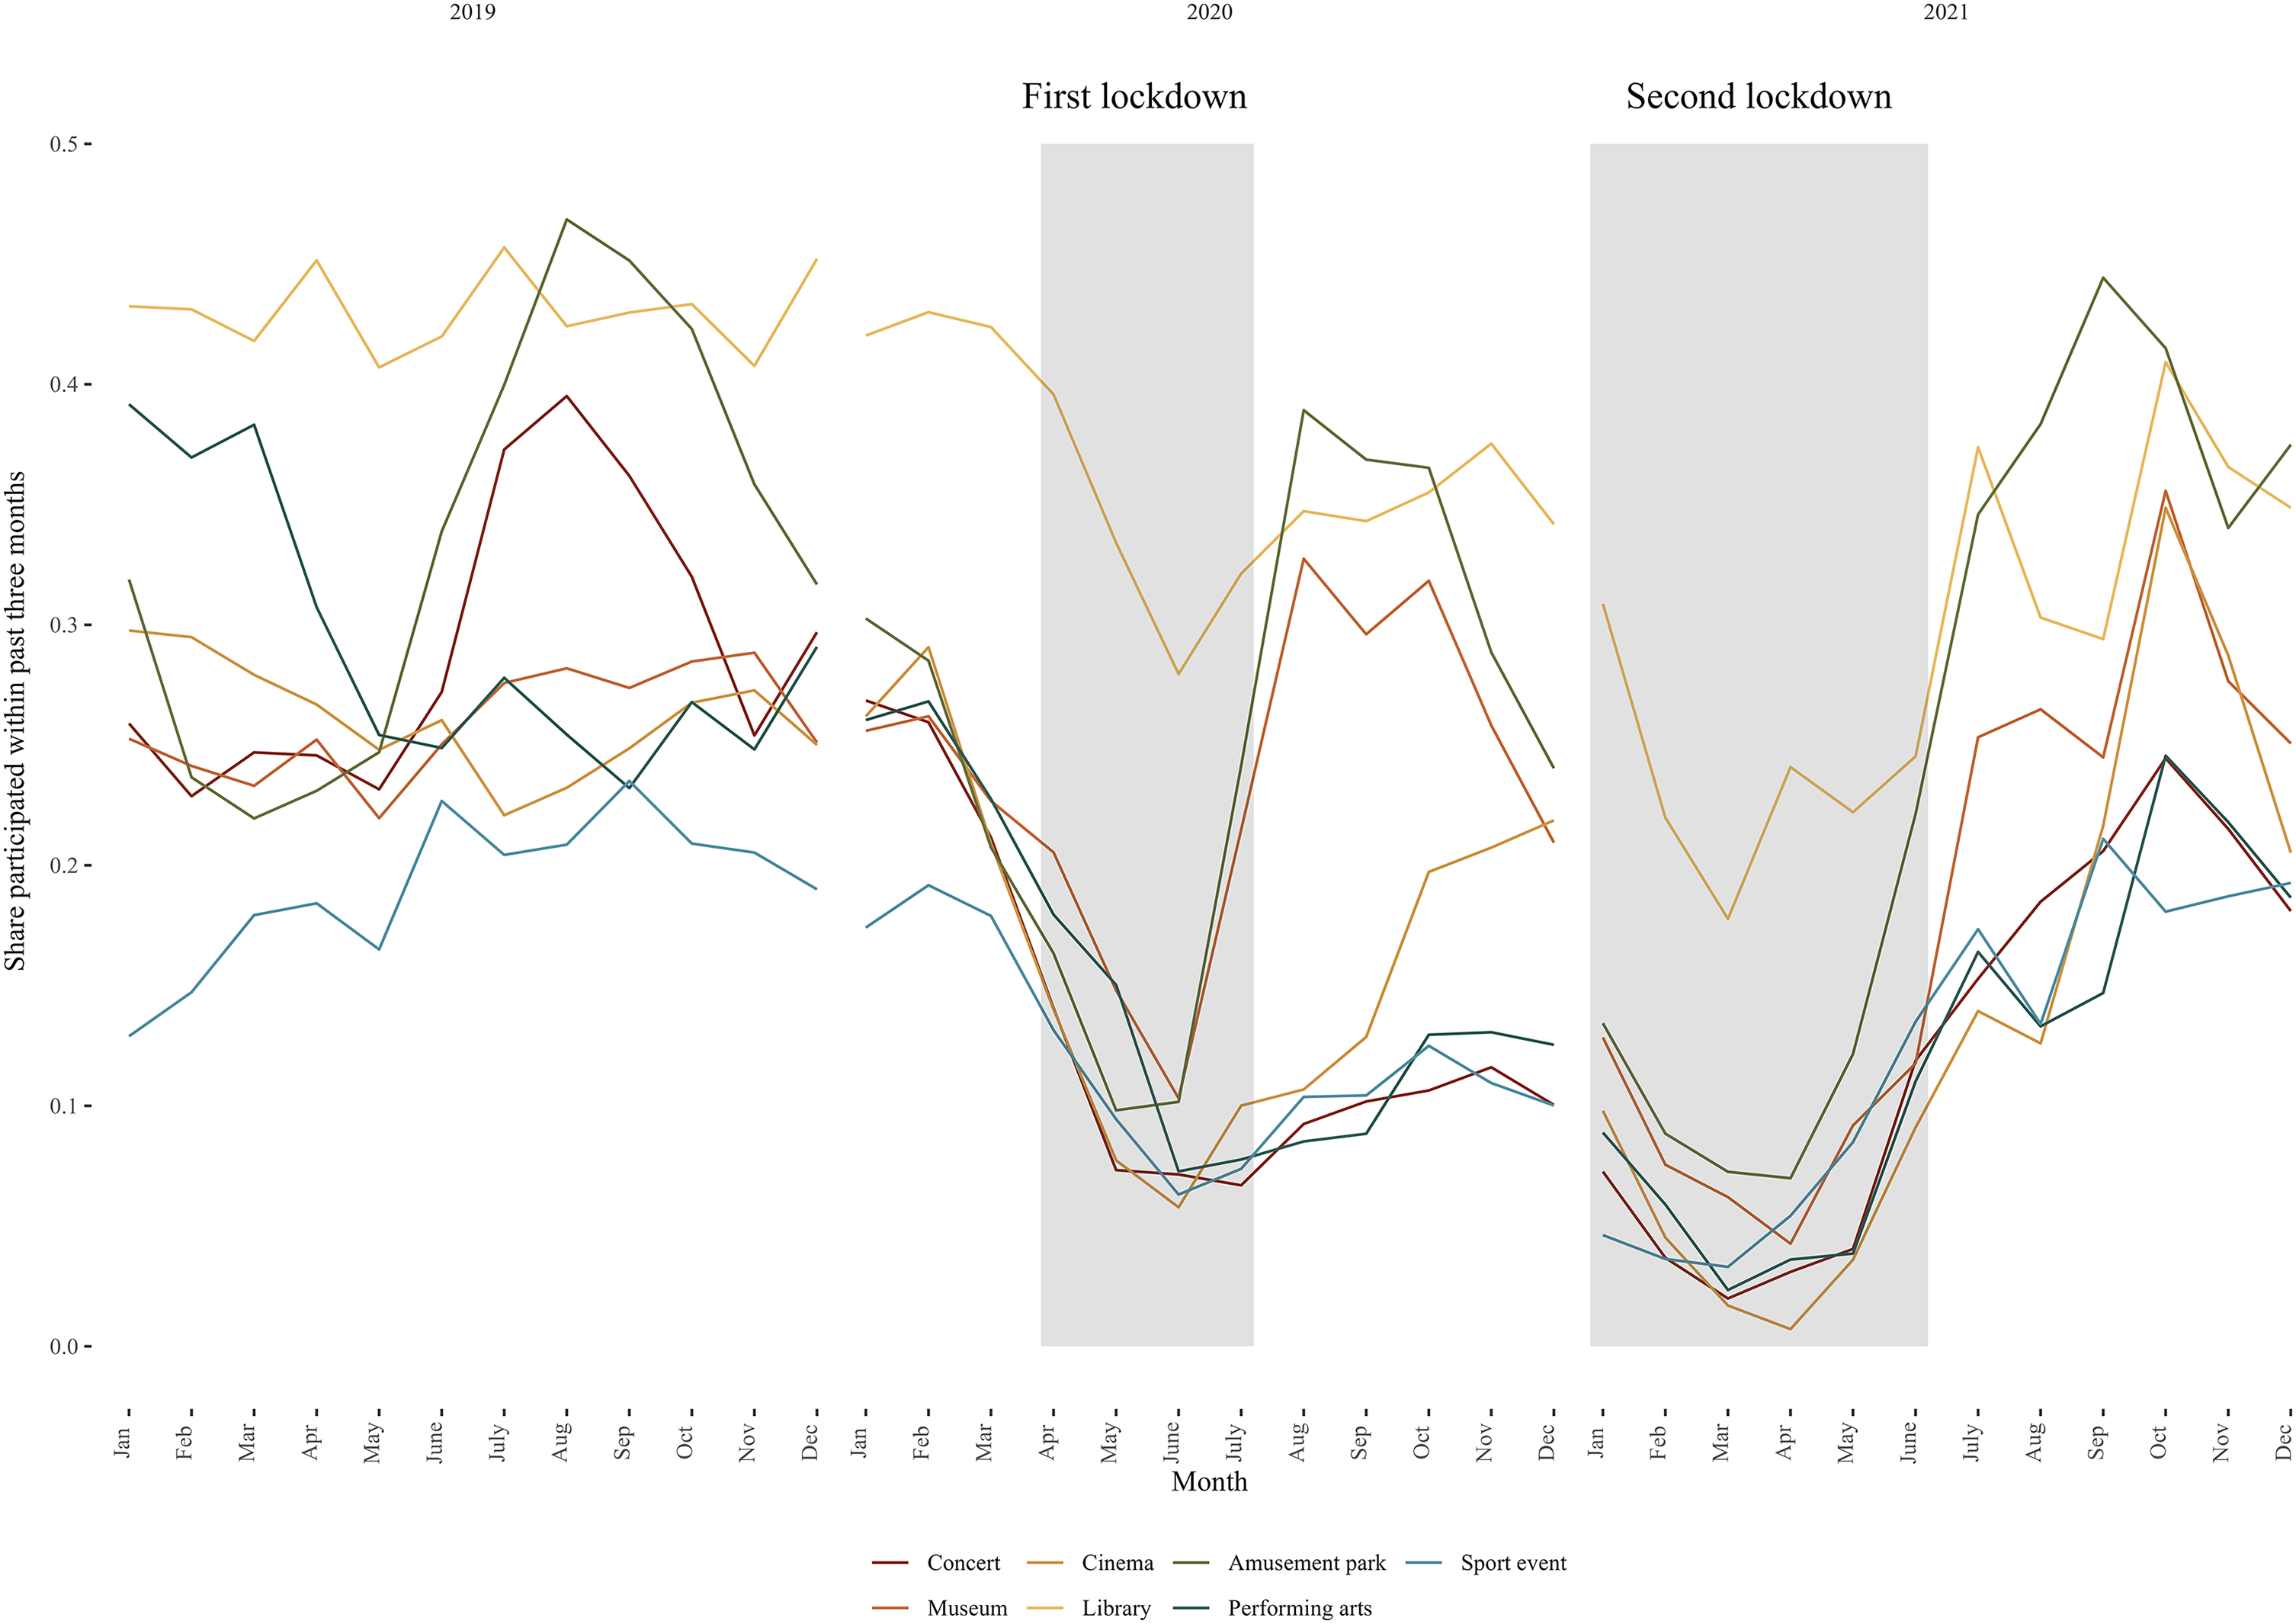
Trends in physical cultural participation, 2019–2021.
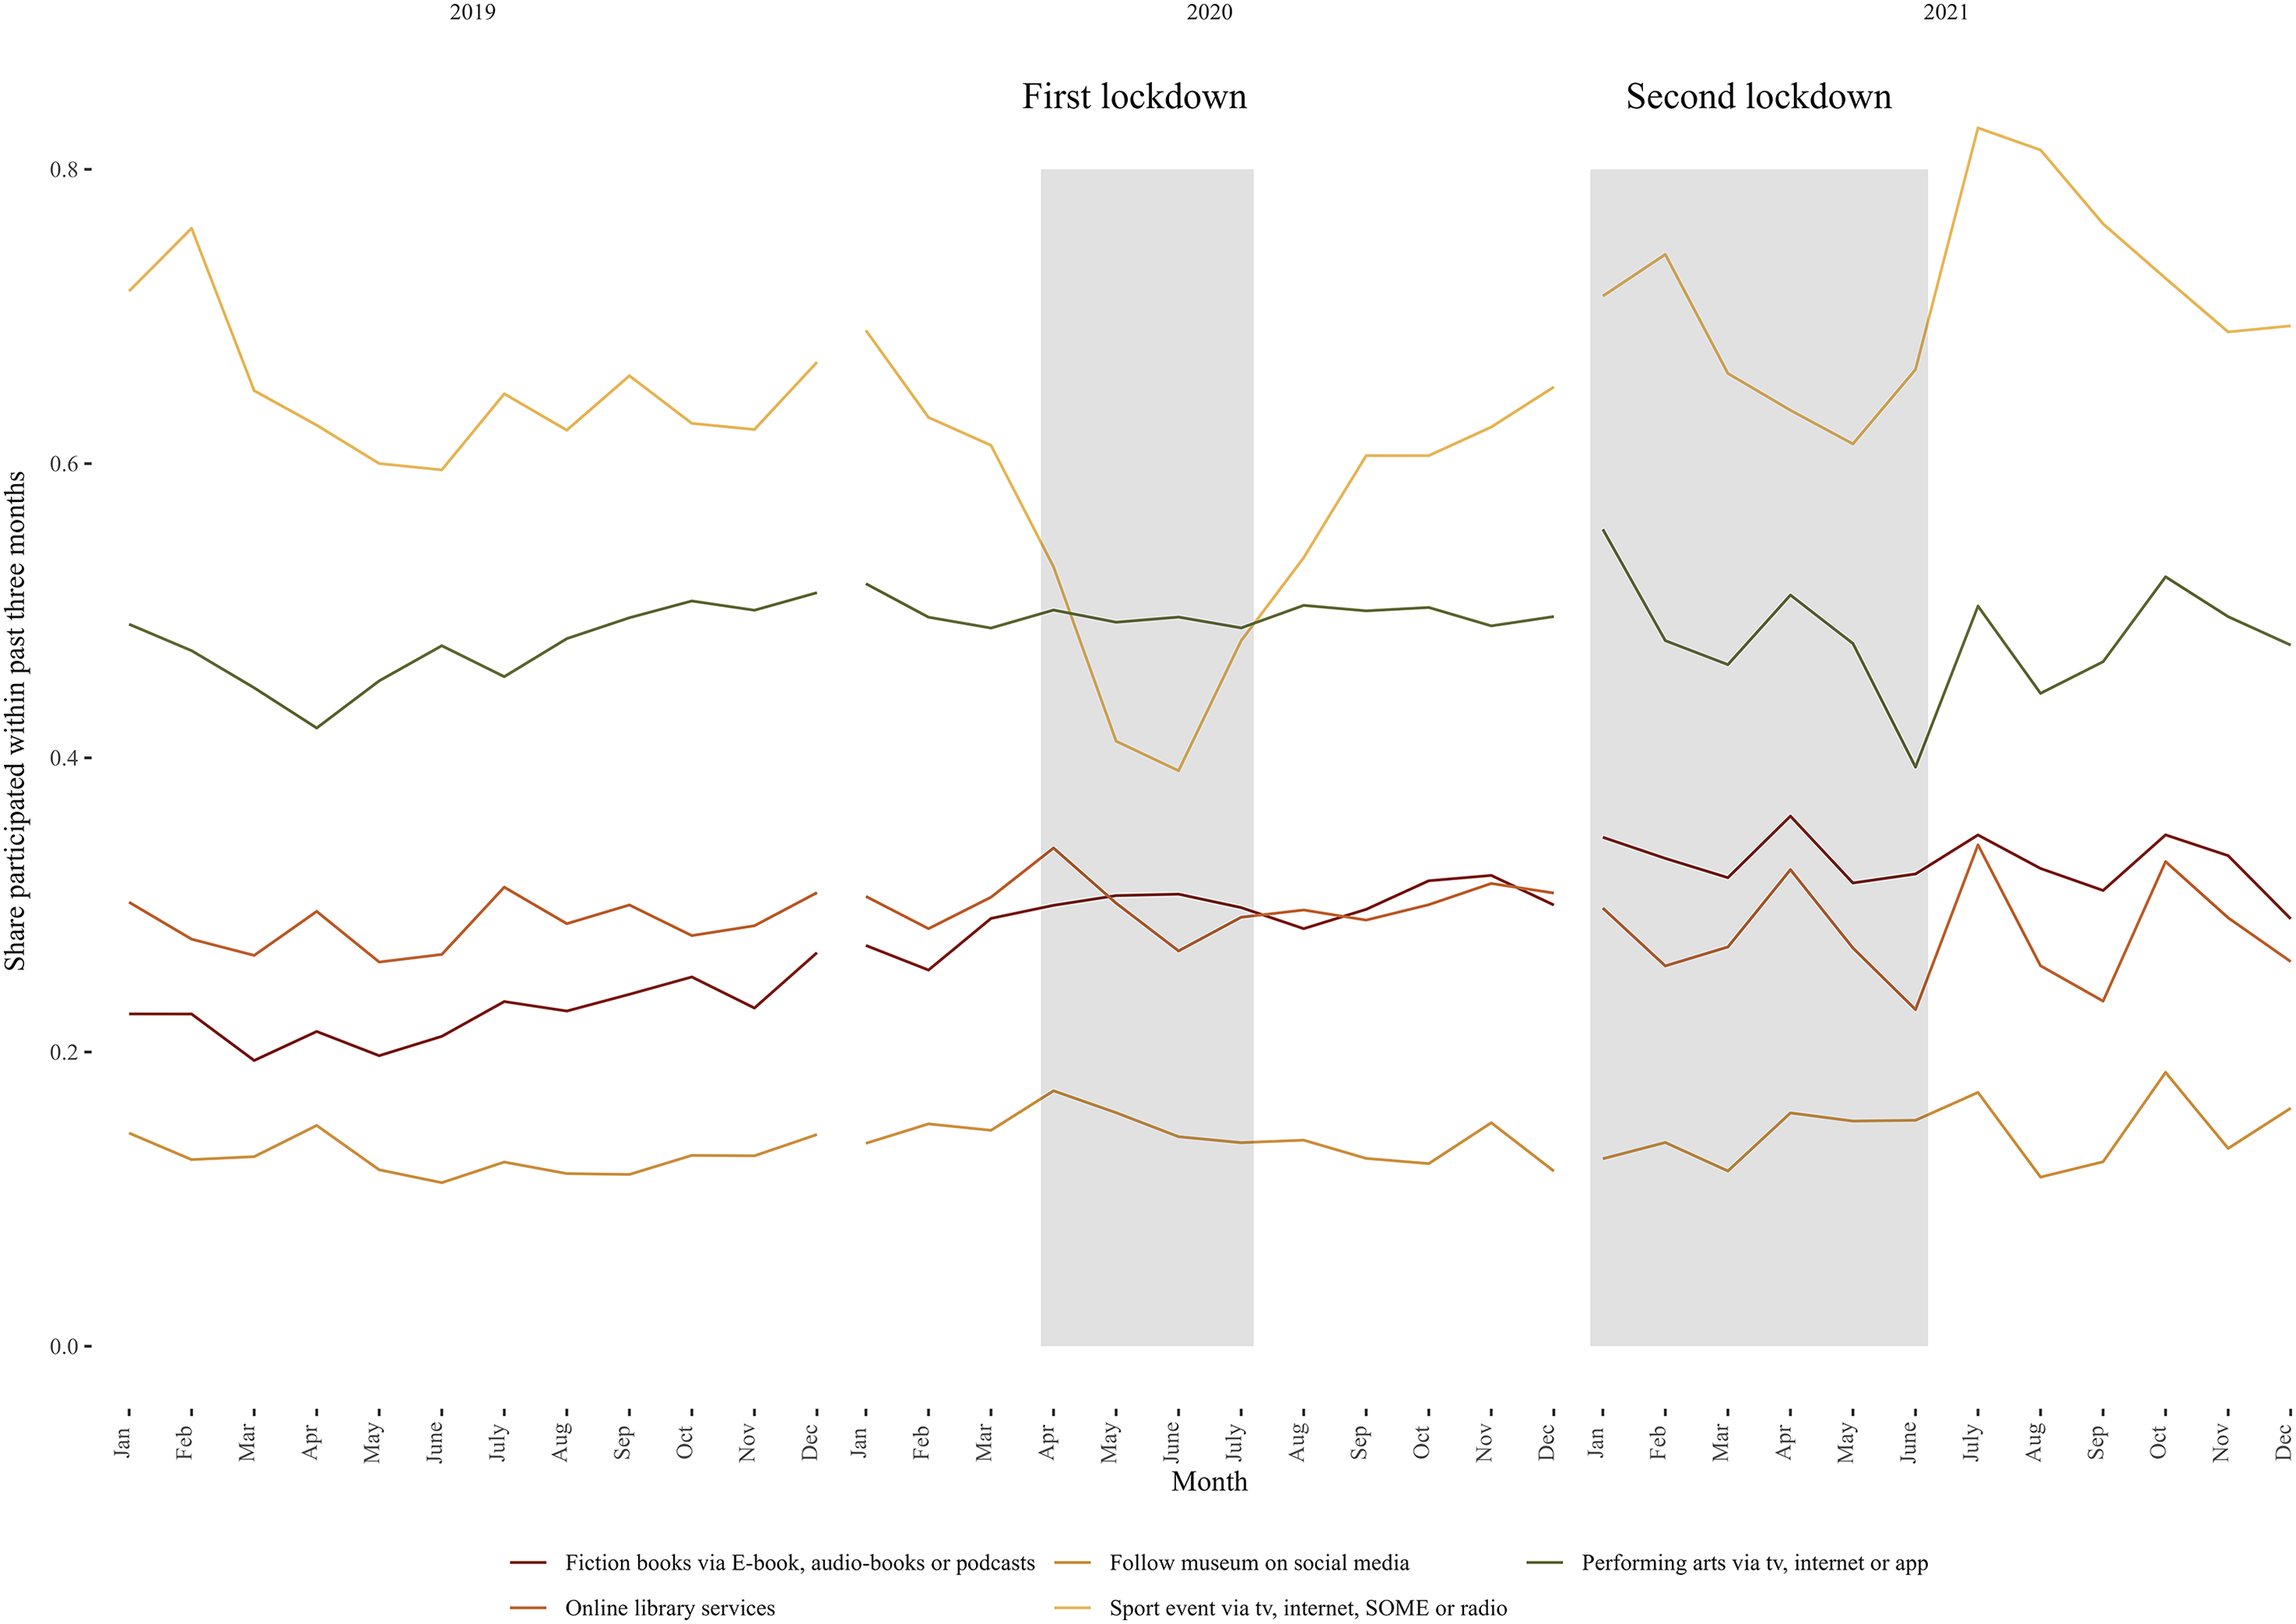
Trends in digital cultural participation and Reading, 2019–2021.
Trends in physical cultural participation
Figure 1 shows participation rates for each of the seven physical activities for each month of 2019–2021. The months in the figure refer to the calendar month of the survey interview, which means that there is a time lag because respondents report on their cultural participation in the previous three months. Figure 1 shows that, compared to the pre-pandemic period, attendance at all seven physical activities decreased dramatically during the first lockdown. This trend is unsurprising given that cultural institutions closed during the first lockdown. Figure 1 also shows that attendance at some activities (museum, library, amusement park, and sport events) increased in the interim period after the first lockdown, while attendance at other activities (concerts, performing arts, and, to some extent, cinema) stayed low. This likely reflects that social distancing regulations in the first interim period made it difficult to organize music and performing arts events. During the second lockdown phase, attendance at all seven physical activities plummeted again, in most cases to levels below the first lockdown. Similar to after the first lockdown, attendance increased dramatically in the second interim period, especially for amusement parks and museums. Yet, physical attendance at most cultural activities remained below their pre-pandemic level in the second half of 2021. This result suggests that, at least in the time window we consider, the pandemic had a scarring effect on physical cultural participation.
Trends in digital cultural participation
Figure 2 shows participation rates for each of the five digital activities for each month of 2019–2021. The main takeaway from Figure 2 is that COVID-19 had little impact on digital cultural participation. The only activity for which we see an increase is reading fiction books. However, as this increase started before the first lockdown and persisted throughout the intermediate periods, it is likely (at least partially) due to a general trend toward more digital reading in Denmark. The only activity for which we see a decline during the first lockdown is watching a digital sport event. This decline is not surprising, as many sports events were canceled due to COVID-19 and, consequently, there was little to watch online.
In summary, with regard to RQ1, we find large declines in physical cultural participation during the first and second lockdown and that physical participation did not return to its pre-pandemic level at the end of 2021. With regard to RQ2, we find no evidence that digital cultural participation replaced physical participation during the two lockdowns. Consequently, there was no “consumption displacement” from physical to digital participation (Hall et al., 2021). Our interpretations rely on visual inspection of Figures 1 and 2. In the Online Appendix (Tables A5 and A6), we use regression models to estimate changes in physical and digital cultural participation during the two lockdowns and the two interim periods (relative to the pre-pandemic period). In these models, we compare cultural participation during lockdown periods to cultural participation in the same months of the pre-pandemic period (we also adjust for a few instances of repeated observations of the same respondents in the data). 3 The main conclusions are identical to those we present above based on visual inspection of Figures 1 and 2.
Changing socioeconomic gradients in cultural participation
The last part of our analysis addresses RQ3: Did socioeconomic gradients in cultural participation change during COVID-19? Again, we use regression models to estimate overall changes in each of the cultural activities (physical and digital) during each COVID-19 phase. In addition to the main effects of each COVID-19 phase, and the main effects of respondents’ education and income, the models include interaction terms between the COVID-19 phase and the variables capturing respondents’ education and income. The interaction terms capture the extent to which, for each COVID-19 phase, high-educated/high-income respondents differ from low-educated/low-income respondents in terms of cultural participation. As stated above, all substantive results are identical when we use continuous measures of respondents’ education and income.
Table 1 shows estimates for the interaction terms between the lockdown phase (with the pre-pandemic phase being the reference category) and the indicators of respondents’ education and income. Figure 3 plots coefficients on the same interaction terms. The figure shows that, with few exceptions (sport event and library use), socioeconomic gradients by education and income decreased during the first and second lockdown. The negative coefficients in Figure 3 imply that when compared to respondents with low education/income, respondents with high education/income were less likely to engage in physical cultural activities during the two lockdowns than during the pre-pandemic period. We also see that the decrease in socioeconomic gradients is particularly strong for respondents’ education. Consequently, socioeconomic gradients decreased during both lockdowns, most likely because individuals with high education/income were unable to continue their high(er) pre-pandemic levels of cultural participation (Katz-Gerro, 2017; Lizardo, 2018).
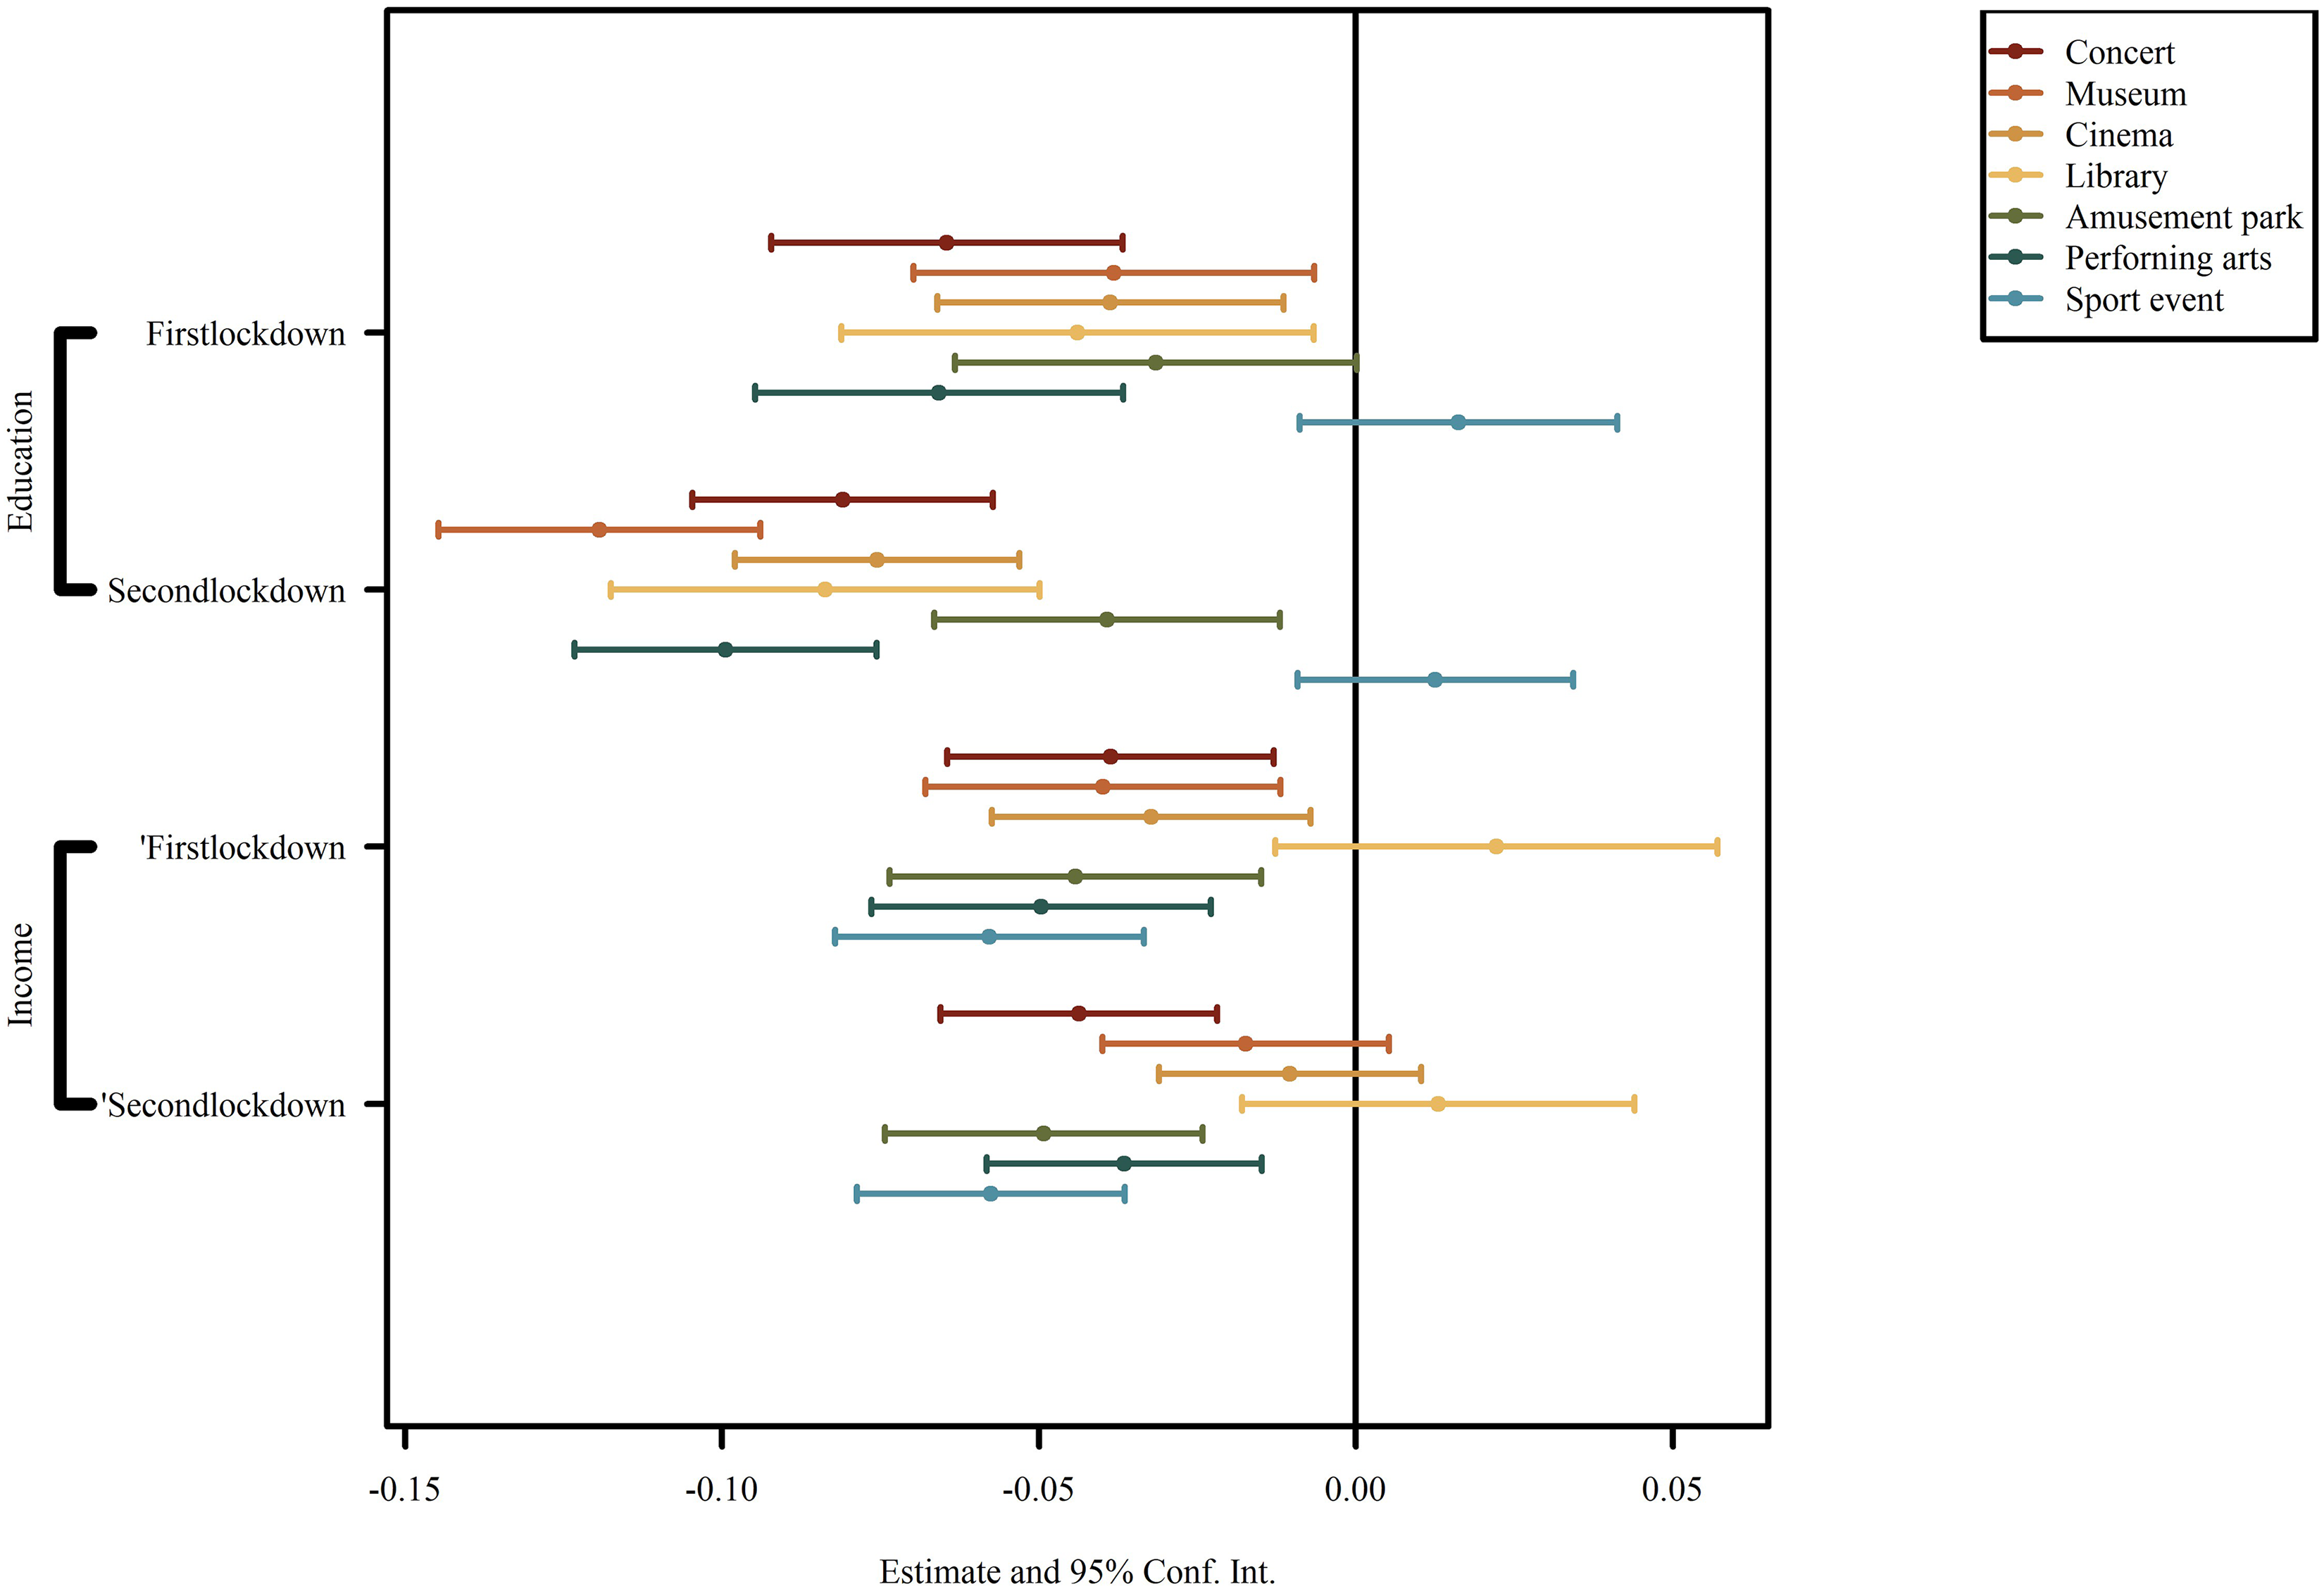
Changes in socioeconomic gradients in physical cultural participation.
Regressions of physical cultural participation with interaction terms.
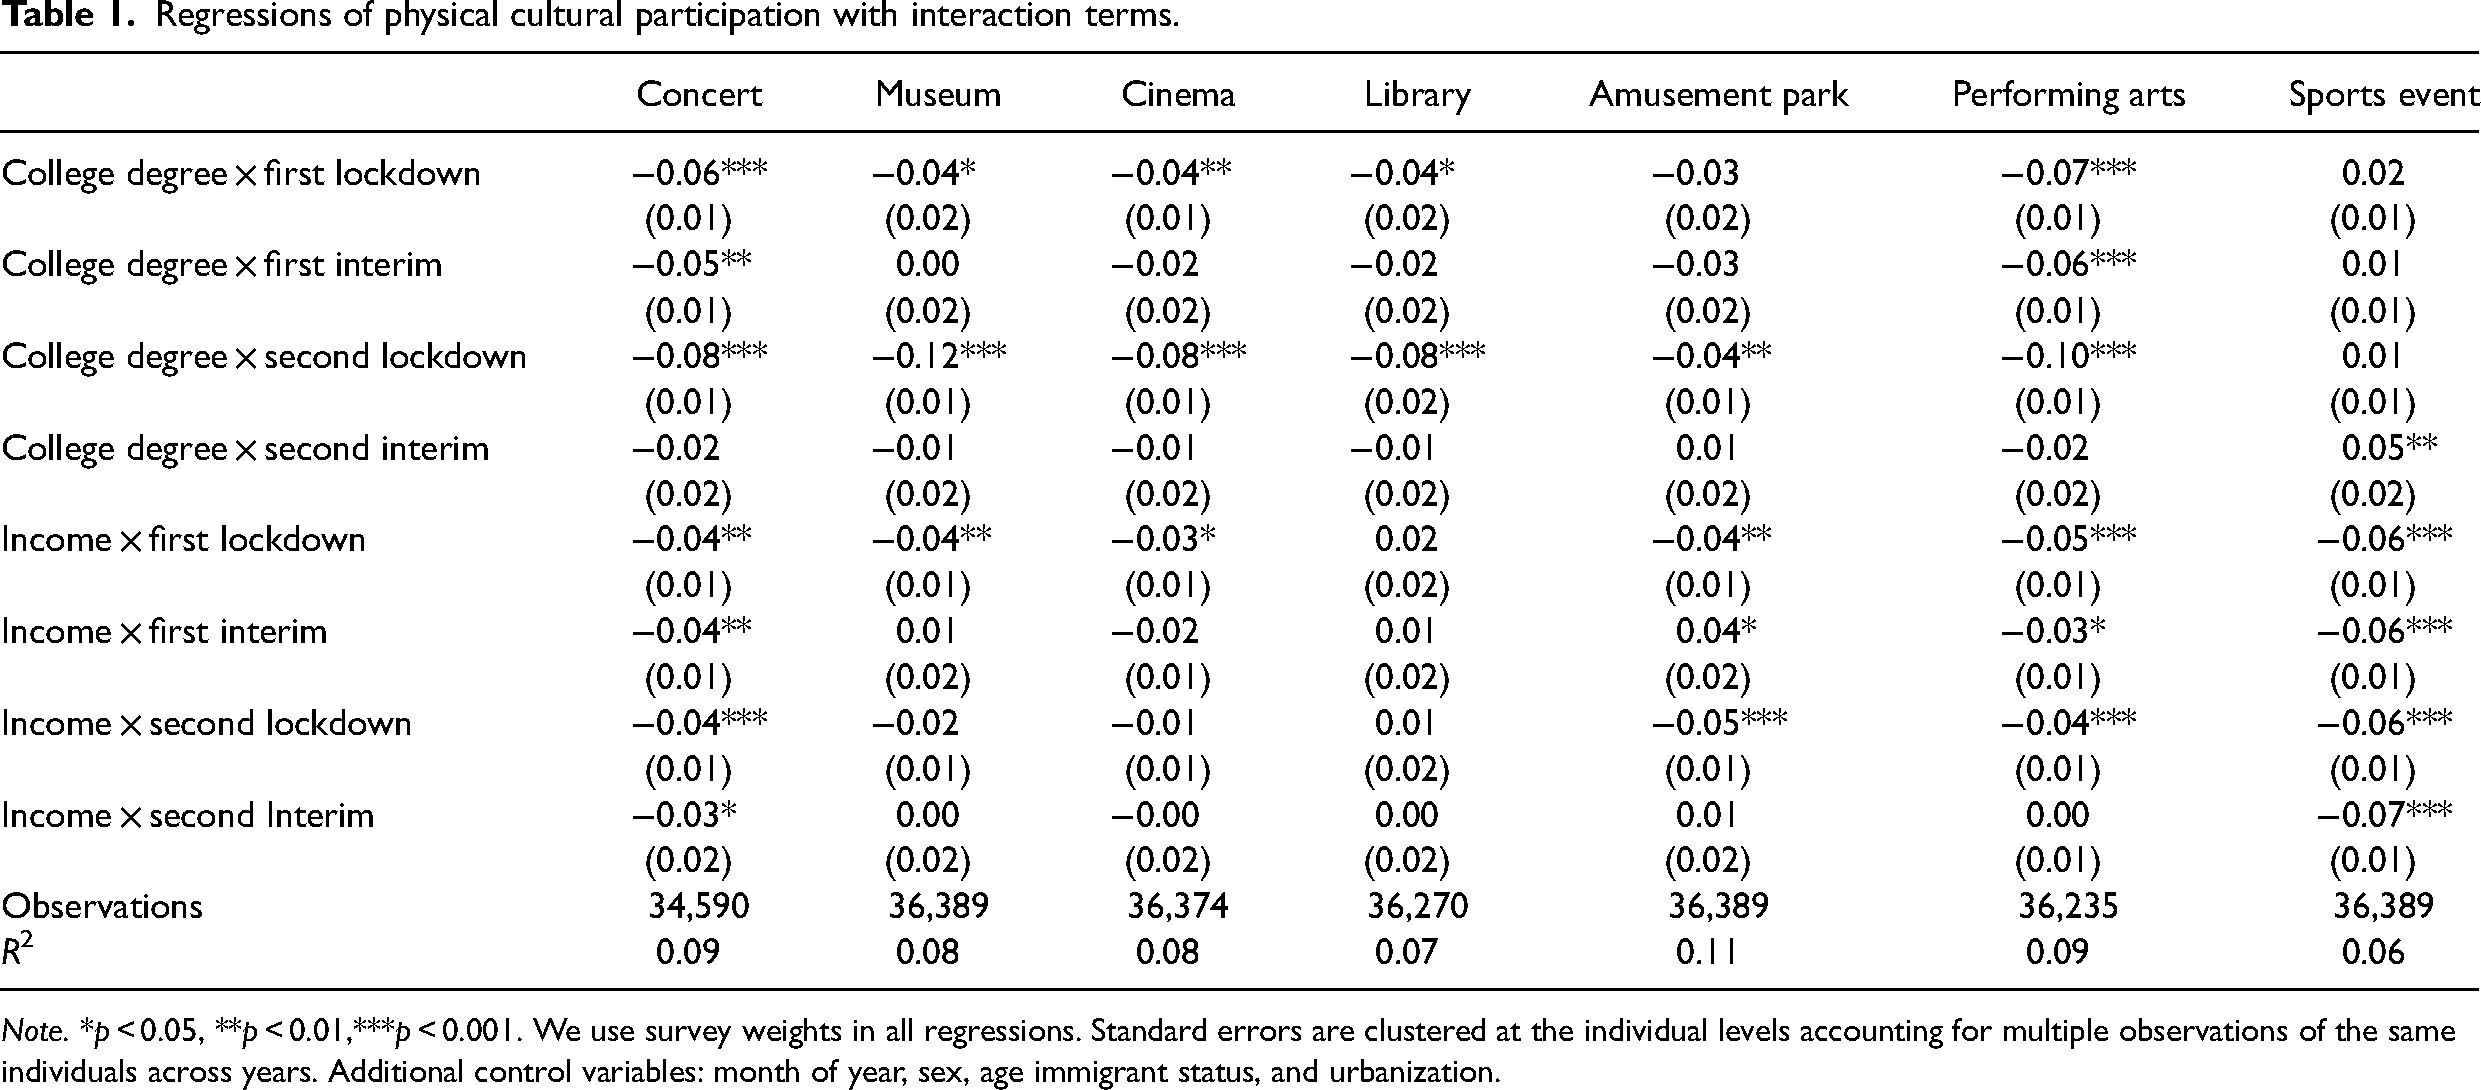
Note. *p < 0.05, **p < 0.01,***p < 0.001. We use survey weights in all regressions. Standard errors are clustered at the individual levels accounting for multiple observations of the same individuals across years. Additional control variables: month of year, sex, age immigrant status, and urbanization.
We have also run regression models with interaction effects to assess changing socioeconomic gradients in respondents’ digital cultural participation (cf. Online Appendix Table A7). Here, we do not find any consistent patterns of interaction terms between respondents’ education/income and the dummy variables for each lockdown (and interim) period. These results imply that, unlike physical cultural participation, socioeconomic gradients in digital cultural participation did not change appreciably during the COVID-19 pandemic (Feder et al., 2022). Importantly, this result means that high-income or college-educated individuals did not substitute their lower physical cultural participation during lockdown with higher digital cultural participation. We discuss the substantive implications of this result in the next section.
Discussion
In this research note, we use high-quality pooled time-series cross-sectional data to map trends and changing socioeconomic gradients in physical and digital cultural participation during the COVID-19 pandemic. We find that (a) physical cultural participation decreased significantly in Denmark during the two COVID-19 lockdowns in 2020 and 2021; (b) physical participation did not return to its pre-pandemic level by the end of 2021; (c) individuals did not substitute physical cultural participation with digital cultural participation; and (d) socioeconomic gradients decreased with regard to physical (but not digital) cultural participation. Our results contribute to a small literature on the impact of the COVID-19 pandemic on cultural participation (Bone et al., 2022; Choi et al., 2020; Codagnone et al., 2021; Feder et al., 2022; Hall et al., 2021; Roberts, 2020) by including time-series data, a longer time window, physical as well as digital participation, and changes in socioeconomic gradients. We end by discussing what we might learn from our results about how social disruptions such as COVID-19 affect cultural participation.
First, our analysis suggests that social disruptions have both immediate and long-term impacts. It is not the case that, once the government began lifting restrictions, people immediately reverted to their previous patterns of physical cultural participation. Although many restrictions were still in place during the two interim periods, by the late spring and summer of 2021 only a few restrictions on physical cultural activities remained. Consequently, our results suggest that it takes time for people and institutions to get back to normal.
Second, we see some evidence of “pandemic fatigue” with regard to physical cultural participation. Although restrictions were arguably more severe during the first than during the second lockdown, we find that physical cultural participation was lower during the second lockdown than during the first lockdown (see Online Appendix Table A5). The difference between the first and the second lockdown might be attributable to people feeling stressed due to prolonged exposure to the pandemic, which led to pandemic fatigue and cultural disengagement. This result might also reflect that the second lockdown was longer than the first lockdown and, thus, more of the 3-month time window covered in the survey questions capture cultural participation during lockdown.
Third, even though we have only a small set of indicators, we find that digital cultural participation remains relatively stable during both lockdowns and interim periods. Consequently, digital cultural consumption was largely “business as usual.” This result might suggest that, at least in the digital domain, there was no pandemic fatigue. It also suggests that (socioeconomically advantaged) individuals did not substitute physical cultural participation with digital cultural participation, as we might expect. This result is in contrast with evidence that music consumption via Spotify decreased and that live performances increasingly took a digital turn (Hylland, 2022; Sim et al., 2021). Differences in results might also be due to differences in empirical measures. While culturally active individuals might have increased or decreased the amount of digital culture they consume, there is little change in the share of the population that uses digital culture (which is what we study).
Finally, the smaller socioeconomic gradients in physical cultural participation suggest that a lower supply of culture disproportionally used by advantaged groups reduces inequality. This result is interesting because it suggests that macro-level and institutional factors contribute directly to creating and maintaining socioeconomic gradients in cultural participation (DiMaggio, 1991; Fishman and Lizardo, 2013). This finding also contributes to research on the general impact of COVID-19 on inequality, where the prevailing narrative suggests increased inequality (Betthäuser et al., 2023, Wachtler et al., 2020). Our findings highlight that COVID-19 specifically, and larger societal disruptions more generally, can increase inequality in some domains while decreasing it in others depending on how relevant institutions and individuals are affected. While fascinating, we need more research to tease out the mechanisms through which institutions and “natural experiments” such as the COVID-19 pandemic disrupt cultural participation and, in doing so, potentially create new patterns of inequality.
Supplemental Material
sj-docx-1-asj-10.1177_00016993231203077 - Supplemental material for No substitute for the real thing? Physical and digital cultural participation in Denmark during the COVID-19 pandemic
Supplemental material, sj-docx-1-asj-10.1177_00016993231203077 for No substitute for the real thing? Physical and digital cultural participation in Denmark during the COVID-19 pandemic by Ea H Blaabæk and Mads M Jæger in Acta Sociologica
Footnotes
Acknowledgments
We thank Statistics Denmark for making the survey data available and the Ministry of Culture Denmark for funding the collection of survey data. We also thank Claus Werner Andersen and Agnes Tassy, both from Statistics Denmark, for their helpful comments and assistance.
Funding
The authors disclosed receipt of the following financial support for the research, authorship, and/or publication of this article: This work was supported by the Velux Fonden, (grant number 00017000).
Supplemental material
Supplemental material for this article is available online.
Notes
Author biographies
References
Supplementary Material
Please find the following supplemental material available below.
For Open Access articles published under a Creative Commons License, all supplemental material carries the same license as the article it is associated with.
For non-Open Access articles published, all supplemental material carries a non-exclusive license, and permission requests for re-use of supplemental material or any part of supplemental material shall be sent directly to the copyright owner as specified in the copyright notice associated with the article.