
Abstract
This paper investigates the link between residential context, perceptions and attitudes toward immigrants by linking data from the British Election Study with Census statistics on composition of electoral constituencies in 2001 and 2011. I consider which type of local diversity is most salient for natives’ attitudes by combining information on ethnicity, religion and skills. Second, I look at whether base levels of and changes in local diversity affect anti-immigration attitudes in the same way. I find that immigration is more salient when defined by ethnic criteria, rather than criteria that combine ethnicity and religion or skills. Anti-immigrant attitudes are more likely to be expressed by natives who live in constituencies where there has been a large change in diversity between 2001 and 2011, but these responses depend on initial diversity levels. For non-whites and skilled ethnic minorities higher residential segregation is associated with more negative attitudes toward immigrants among natives.
Keywords
Introduction
Over the last couple of decades, immigration has reshaped Western European societies. With increasing diversity, more people are now living in areas with larger numbers of ethnic and religious minorities. British society is a good example of the magnitudes of such changes. Fifty years ago, the British population consisted of just over 1% non-white population (Rose, 1969); by 2011 this figure had increased to 13%. With the increase in diversity, the reaction of natives to the new minority groups became an increasingly urgent matter. Since the early 2000s, the British public has consistently identified immigration as one of the top issues facing the country ahead of education, the National Health Service and the economy (Blinder and Allen, 2016) while anti-immigration sentiments have been linked to the rise of the UK Independence Party and the outcome of the 2016 referendum on European Union membership (Evans and Mellon, 2019; Hobolt, 2016). How does diversity at a local level contribute to attitudes toward immigration? Two predominant sociological theories – contact and ethnic threat – give diverging answers. On one hand, exposure to diversity is a primary condition for inter-group contact, which reduces prejudice. On the other hand, increasing diversity can also lead to increased competition and a feeling of threat in either economic or symbolic domains. Recent studies examining contextual effects of diversity on attitudes toward immigrants show that increasing diversity is associated with more prejudice, but levels are not (Kaufmann, 2017; Newman, 2013; Van Heerden and Ruedin, 2019).
In this study, I examine data from the British Election Study in England and Wales and look at the role local diversity plays in shaping natives’ views on immigration. Individual-level information on attitudes, demographics and self-reported economic prospects is linked to contextual information from 573 constituencies in England and Wales. 1 I contribute to the existing literature in three ways. First, I show how different types of local diversity relate to anti-immigration attitudes in the British context. My data allow for directly looking at attitudinal questions rather than a preference for immigration reduction as used by Kaufmann (2017). Second to study how attitudes toward immigrants are related to natives’ perceptions of the local population, I test whether levels and changes apply in equal measures to local composition with regard to ethnicity, religion and skills. I test this by measuring the composition of ethnic minorities (i.e. those who did not identify as white British on the Census) in terms of the proportion of those who are non-white, Muslim and unskilled. My analysis suggests that ethnicity remains the most salient dimension. Next, I provide evidence for different effects of levels and changes while controlling for residential segregation. Researchers have looked at levels, changes or segregation, but to my knowledge, no other study has simultaneously considered all three indicators. Third, I observe an interaction effect between levels and changes in the proportion of non-white residents in the opposite direction from what has been previously reported by Newman (2013). While residents in areas with a high initial proportion of non-whites are generally more positive toward immigrants, further increases are associated with steeper declines in pro-immigration attitudes.
Theories and hypotheses
The two dominant theoretical frameworks linking attitudes with local context are the power threat hypothesis and contact theory. The power threat hypothesis conceptualizes group hostility between dominant and subordinate groups. The main idea is that with sufficient numbers of newcomers, the hegemonic position of the dominant group is undermined, thus generating competition over resources such as employment, access to social housing or political influence (Blalock, 1967). Yet, under certain conditions, diversity can also be associated with reduction in prejudice. Research published in the wake of the Second World War showed a major decrease in racial prejudice among white military personnel if they served together with African American soldiers. Allport (1954) is credited for drawing attention to the role of interaction in attitude formation. Importantly, the presence of minority groups is not a sufficient condition to facilitate a reduction in negative attitudes. The type of contact that is meaningful in terms of prejudice reduction is characterized by small distance in terms of social status between groups, an environment that encourages cooperation and a broader framework of support from authorities, law and customs. In contrast, superficial contact refers to conditions when groups are heavily segregated or when one group profits from the hardship of another; both are examples of environments less conducive to prejudice reduction (Pettigrew, 1998).
What is the evidence in support of these hypotheses? Below I discuss the findings with respect to geographical scales at which threat and contact operate, conceptualization of immigrant populations, residential segregation and the role of diversity levels and changes.
The role of scale
First, it seems that threat operates at a larger scale and contact at smaller scales that are conducive to the formation of social ties. People are more likely to meaningfully interact with others living in the same area but have little contact with those living on the other side of the country. Consequently, studies based on larger scales capture effects akin to threat and those based on smaller geographical scales often find support for contact theory (Van Gent et al., 2014; Rink et al., 2009). 2
Earlier studies often looked at national scales and provided support for the notion that the size of the immigrant population was positively associated with perceived threat, exclusionary preferences and anti-foreigner attitudes (Quillian, 1995; Scheepers et al., 2002; Schneider, 2008; Semyonov et al., 2006, 2008). 3 In later years, researchers examined whether this finding holds for smaller geographical scales. Studies that look at the subnational context prove to be less conclusive; a possible mechanism is that at smaller scales, the effect of contact overshadows threat and much depends on the size of the subnational units. Researchers sought to distinguish between smaller and larger scales to show that threat and contact operate together but at different scales (Ha, 2010; Oliver and Wong, 2003). For example, Ha (2010: 35) investigated how attitudes are linked to context in both small neighbourhoods and larger metropolitan areas and reported that ‘attitudes toward immigrants vary across geographic areas […] anti-immigrant sentiments tend to be greater in the metropolitan areas, and pro-immigrant sentiments are relatively larger in the neighbourhoods’. Yet, studies of subnational contexts showed mixed results and reported that the concentration of immigrants may have a negative effect on attitudes toward immigrants (Quillian, 1996; Schlueter and Scheepers, 2010), have no or positive effect (Dustmann and Preston, 2001; Evans and Need, 2002; Fox, 2004; Hjerm, 2009; Semyonov, et al., 2004; Wagner et al., 2003), different effects depending on which immigrant groups are considered (Dixon and Rosenbaum, 2004; Ha, 2010; Taylor, 1998), or have effects which depend on regional labour market conditions (Markaki and Longhi, 2013).
Conceptualization of immigrant populations
In a meta-analysis of studies on contextual effects on attitudes toward immigrants, Pottie-Sherman and Wilkes (2017) argue that contextual effects of diversity on attitudes toward immigrants depend on the criteria taken to define the immigrant population as well as establishing which groups respondents have in mind when answering surveys (Pottie-Sherman and Wilkes, 2017). When studying how context affects attitudes toward immigrants, researchers have used a number of ways to define immigrant populations. These measures might have been detached from respondents’ own perceptions of who counts as an immigrant. Blinder emphasizes this issue, observing that the term ‘immigrant’ is inherently vague and one cannot be sure of respondents’ views on immigration because it is not known whom respondents regard as immigrants (Blinder 2015). Even if respondents are provided with clarification, they might hold different views about different groups – for instance, they might be more welcoming toward highly skilled foreign workers but hostile toward refugees (Card et al., 2005; Gorodzeisky, 2011).
Ethnic criteria
When answering questions about immigration, respondents often associate immigration with ethnicity. The condition for threat reaction is that the minority group is visible. Hjerm (2009) finds that in Swedish municipalities, a higher portion of immigrants from outside Western Europe, USA, Canada, Australia and New Zealand is associated with stronger anti-immigrant attitudes and concluded that with higher visibility comes higher feeling of threat. This is similar to the concept of ethnic hierarchies used by Ford (2011) who showed that British respondents are more hostile toward immigrants from Southeast Asia and the West Indies (i.e. non-whites) and more positive toward European and Australian immigrants. The author argues that ethnic hierarchies are a key dimension distinguishing ‘acceptable’ and ‘unacceptable’ immigrants.
Skills as criteria
Alternatively, researchers have argued that anti-immigrant attitudes are driven by concerns over economic well-being or cultural homogeneity. Two economic theories have been particularly prominent: labour market competition, where influx of immigrants threatens natives’ wages and employment prospects, and fiscal burden, where more negative attitudes toward low-skilled immigrants are explained by the expected burden they put on public services (Hainmueller and Hopkins, 2014). Researchers have observed a preference against low-skilled immigrants; for instance, Hainmueller and Hiscox (2010) used an experimental survey design to show that American opposition to the arrival of more immigrants depends on whether the description of immigrants portrayed them as highly skilled or low-skilled. Interestingly, both highly skilled and low-skilled respondents had a strong preference for highly skilled immigrants. These results suggest that attitudes toward immigrants are not necessarily rooted in economic self-interest but beliefs about the impact of immigration on a wider society. Markaki (2014) notes a similar pattern in her study of regional determinants of public support for restriction to immigration in the United Kingdom. Her findings suggest that support for limiting immigration is associated more with who the immigrants are rather than characteristics and conditions of natives in the region. Additionally, it is reasonable to expect that this distinction between high- and low-skilled immigrants may be of particular importance in Britain in recent years. While Britain has policies aimed at limiting low-skilled migration from outside the EU there were no similar restrictions to the inflow of low-skilled EU migrants, which led to a large increase in the low-skilled immigrant population after 2004. The vast majority of this increase can be attributed to Eastern European migration from new EU countries.
Cultural and symbolic criteria
Another line of research highlights the primacy of cultural or symbolic concerns. In a meta-analysis of 55 studies of contextual effects on attitudes toward immigrants carried out by Pottie-Sherman and Wilkes (2017), the authors found that studies that use symbolic threats tend to find larger effect sizes than those reported for economic or political factors. McLaren (2003) argues that in Western Europe, the preference to expel immigrants is driven to a lesser extent by self-interest or economic concerns and more by the perception of a cultural and religious threat. Religious minorities, particularly Muslims, are mentioned as a potential source of symbolic threat (McLaren and Johnson, 2007). Survey research has confirmed that respondents are generally hostile toward religious diversity. For instance, back in 2003, 47% thought that British Muslims could never be truly committed to Britain, and a further 62% declared that British Muslims were more loyal to other Muslims around the world than they were to other people in Britain (McLaren, 2003). Similarly, Card and colleagues (2012) examined attitudes toward immigrants in 21 European countries and showed that cultural concerns (including a preference for religious homogeneity) were two to five times more important in shaping attitudes toward immigrants than economic concerns about wages and taxes.
Following from this discussion on different criteria used to define salient immigrant populations, I expect that: Hypothesis 1a: Higher base levels of non-white ethnic minority residents are associated with more negative attitudes toward immigrants. Hypothesis 1b: Higher base levels of low-skilled ethnic minority residents are associated with more negative attitudes toward immigrants. Hypothesis 1c: Higher base levels of Muslim ethnic minority residents are associated with more negative attitudes toward immigrants.
Residential segregation
Next to scale, another important geographical factor is residential segregation. Areas that are similar in terms of diversity may present different environments for intergroup interaction depending on how segregated these groups are from one another (Pettigrew, 1998). Having immigrant friends, acquaintances or colleagues diminishes threat responses (Dixon and Rosenbaum, 2004; Ellison et al., 2011; Schneider, 2008) while segregation inhibits opportunities for creation of social ties and affects inter-group attitudes. Rocha and Espino (2009) found that among Anglo-Americans, a preference to make English the official language depends not only on changes in the fraction of Spanish-speaking Latinos in the area but also on the level of segregation. Recently, Laurence and colleagues (2019) showed that community segregation moderates the effect of diversity on prejudice, affecting inter-group contact as well as perceived threat. The authors found that in the UK, communities that are becoming more diverse while also becoming more segregated at the same time experience an increase in prejudice. In contrast, communities that become more integrated see prejudice at stable or even declining levels. Hypothesis 2: Segregated areas have higher levels of negative attitudes towards immigrants, even when controlling for immigrant population shares.
Levels or changes?
When examining how the presence of immigrants relates to attitudes, researchers often use a static framework to understand a dynamic process. Although immigrants’ arrival might attract media attention and mobilize people to express opposition, over time residents with ethnic minority backgrounds are less likely to be seen as belonging to the immigrant group. While it is plausible that natives react adversely to changes, once they have time to get used to the new environment, they might re-evaluate their initial assessment. Advancements in studying the effect of contextual factors have come from studies that, rather than focusing exclusively on levels, looked at the impact of changes (Hopkins, 2010) and the interplay between base levels and changes (Green et al. 1998; Newman, 2013). Importantly, while some studies conceptualize change as merely a replacement of levels, others have shown that considering levels and change jointly can provide a fuller understanding of the relation between diversity and attitude formation.
One such perspective, rooted in a classical interpretation of the power threat hypothesis, holds that members of the majority group exhibit more hostile views toward minority groups when immigration challenges the interests of the majority group. This focus on the balance of power is a prominent theme in work on ethnic competition. For instance, Olzak (1992) argues that conflict is more likely to erupt when the ethnic and racial hegemony of the dominant group is challenged and the racial order begins to break down. Consequently, there is a higher rate of collective action against ethnic minorities, not only because of the higher levels of the minority groups but also as a reaction to the rapid changes that further increase hostility. Although some researchers predict that hostility toward immigrants would be higher in areas with substantial immigrant populations, other studies suggest that anti-immigration attitudes are more common when immigrants constitute a smaller share of the population. The latter view is in line with prejudice reduction mechanisms; when there are no opportunities for contact, natives’ ideas about minority groups are based on stereotypes, which are often negative.
How can population levels interact with change in shaping attitudes? An alternative to ethnic competition as presented by Olzak is found in the ‘defended neighbourhood hypothesis’ introduced in a paper by Green et al. (1998). The authors predict that hostility toward members of the out-group would be strongest in homogeneous areas experiencing rapid growth of the out-group population. The emphasis on demographic changes suggests that the feeling of threat is not simply a function of the minority population but also depends on prior expectations about the local environment. Green and colleagues found support for the defended neighbourhood hypothesis when studying incidences of hate crimes against ethnic minorities in New York City. Such crimes were more common in neighbourhoods previously described as white strongholds, which experienced an influx of non-white residents in recent years, and less common if these minority groups had resided in the area in significant numbers for a long time. Shifting from action to attitudes, Newman (2013) provided evidence that white Americans’ responses to local demographic changes also depend on the prior demographic balance in the area. In counties where there were few Hispanics, an influx of Hispanics increased threat response and fostered anti-immigration attitudes. Similar to predictions given by the defended neighbourhood hypothesis, Newman says that rapid growth of the immigrant population seems to be threatening to those living in areas with small pre-existing immigrant populations and less threatening to those residing in areas where immigrants are more established. The author draws attention to the process of acculturation – natives react adversely to growth in the immigrant population at first; however, the same rate of growth is associated with less negative reactions in areas where residents have had a chance to interact with immigrants over a longer period.
The ethnic competition and defended neighbourhood perspectives agree on the effect of growth but disagree on the impact of population levels. From the ethnic competition perspective, higher levels of the minority group population are a source of competition and threat, whereas the defended neighbourhood hypothesis focuses on the acculturation process that is a consequence of contact and higher levels of diversity. Moreover, these theories make a similar prediction regarding the impact of increasing diversity (i.e. change is associated with higher levels of hostility) but differ with regard to the mechanism; the ethnic competition perspective treats growth of the immigrant population as a challenge to the hegemony of the dominant majority group, whereas the defended neighbourhood perspective treats it as a catalyst for action among those who seek to preserve homogeneity. Hypothesis 3a: Higher base levels of immigrant populations are associated with more positive attitudes toward immigrants. Hypothesis 3b: Growth of immigrant populations is associated with less positive attitudes toward immigrants. Hypothesis 3c: Growth of immigrant populations is associated with less positive views about immigrants in areas with low base levels of immigrant populations (interaction effect).
Data and methods
This analysis distinguishes two levels of analysis: the individual and the contextual measured in the Westminster constituency. Individual data come from the British Election Study (BES). The focus of the BES is political participation, but respondents also answer questions about their views on immigration. Here, I use Wave 4 from the latest study, which was conducted in March 2015 on a sample of over 30,000 respondents in England, Scotland and Wales.
In their review of existing research on attitudes toward immigrants, Hainmueller and Hopkins (2014) remarked that attitudes on immigration are about ‘groups of people and about challenges to group boundaries’ with prior research emphasizing two types of groups – those based on nationality and ethnicity. Because I want to examine the perceptions and attitudes of those whose non-immigration status is rarely questioned, I focus on a subsample of white British respondents. What makes BES data suitable for my purpose is that I can match residents to their constituencies. Although these units are larger than neighbourhoods, in a way they are the natural unit of analysis for competition over political influence. Ideally, I would prefer to use a finer scale; however, this is the smallest level of aggregation available in a survey that asks questions about respondents’ views on immigration. Still, it should be emphasized that this level is smaller than the regional distinctions found in other subnational studies.
My dependent variable measures attitudes toward immigrants. To construct this variable, I use the following three questions: (1) ‘Do you think immigration is good or bad for Britain’s economy?’ (2) ‘Do you think that immigration undermines or enriches Britain’s cultural life?’ and (3) a rating of the statement, ‘Immigrants are a burden on the welfare state’. The first two questions are measured on a scale from 1 to 7. For economic impact (1), the scale ranges from ‘Bad for economy’ to ‘Good for economy’. For cultural impact (2), the scale ranges from ‘Undermines cultural life’ to ‘Enriches cultural life’. The third variable is measured on a scale from 0 – ‘Strongly agree’ to 5 – ‘Strongly disagree’. The variables are highly correlated (Cronbach’s alpha = .89), and I follow a common practice of using principal factor analysis to construct an index of attitudes (Hjerm, 2007; Semyonov et al., 2006; Sides and Citrin, 2007). Higher values indicate more positive attitudes toward immigrants. The peak at the minimum value is for people who have the most negative assessment of immigrants on all three measures (13% of those who replied to all three questions). Other variables at the individual level are sex, age and lack of educational qualifications. I also used two variables that measure subjective economic prospects: self-assessed risk of unemployment and risk of poverty. Both are measures on a scale from 1 (Very unlikely) to 5 (Very likely), but I recoded it into a binary variable equal to 1 if a respondent said that they are likely or very likely to find themselves in unemployment or poverty. While sex, age and lack of qualifications are classic control variables (because temporally they are located before the association I investigate – the presence of immigrants in the area cannot influence the respondents’ sex, for example), the remaining variables might not be antecedents to the variables I investigated. In particular, this might apply to subjective views about one’s employment prospects; it is plausible that the presence of immigrants could influence individual evaluation of the chances for employment, which in turn affects attitudes toward immigrants (here subjective perception of employment prospects is an intermediate variable that mediates the impact of context on attitudes). On the other hand, not including individual-level variables would weaken my analysis because while I know that sex, age and educational qualification are strong predictors of anti-immigration sentiments, so are variables capturing economic deprivation (Lancee and Pardos-Prado, 2013).
All explanatory variables used to test hypotheses are contextual. To construct them I use small area (Output Area) statistics from the 2001 and 2011 censuses and aggregate them to 2011 Westminster constituencies. I assume that peoples’ expectations about the present are based on experiences from the past; hence, for base levels, I use the share of immigrants measured in 2001. Regarding changes in immigrant population, one can think of the change simply as the influx of people. However, this would overlook the fact that constituencies have different numbers of residents. Hence, I denominate the increase by the number of people in the constituency in 2001, creating what amounts to a measure of growth of immigrant populations.
To test Hypotheses 1a, 1b and 1c I distinguish between different minority groups. In my models, I look at levels and changes with regard to ethnicity, religion and skills to see their role in the subsequent attitudes of white Britons toward immigrants. The construction of minority groups used in the study is described in Figure 1. For each constituency, I first subtracted the number of white British from all residents; the remaining population was then divided according to ethnicity (white and non-white), religion (Muslim and non-Muslim) and skills 4 (unskilled and skilled). For testing hypotheses 2 and 3 I calculated levels and changes and segregation indexes at constituency level. For segregation, I used an index of dissimilarity, calculated over 8546 wards and electoral divisions and 573 English and Welsh constituencies. The common interpretation of the dissimilarity index that it measures the share of the group’s population that would have to move for each smaller unit to have the same share of that group as the larger unit. Values range from 0, which indicate no segregation to 1, which means complete segregation. For each immigrant population the segregation index measures the extent to which it is segregated from the majority white British group.
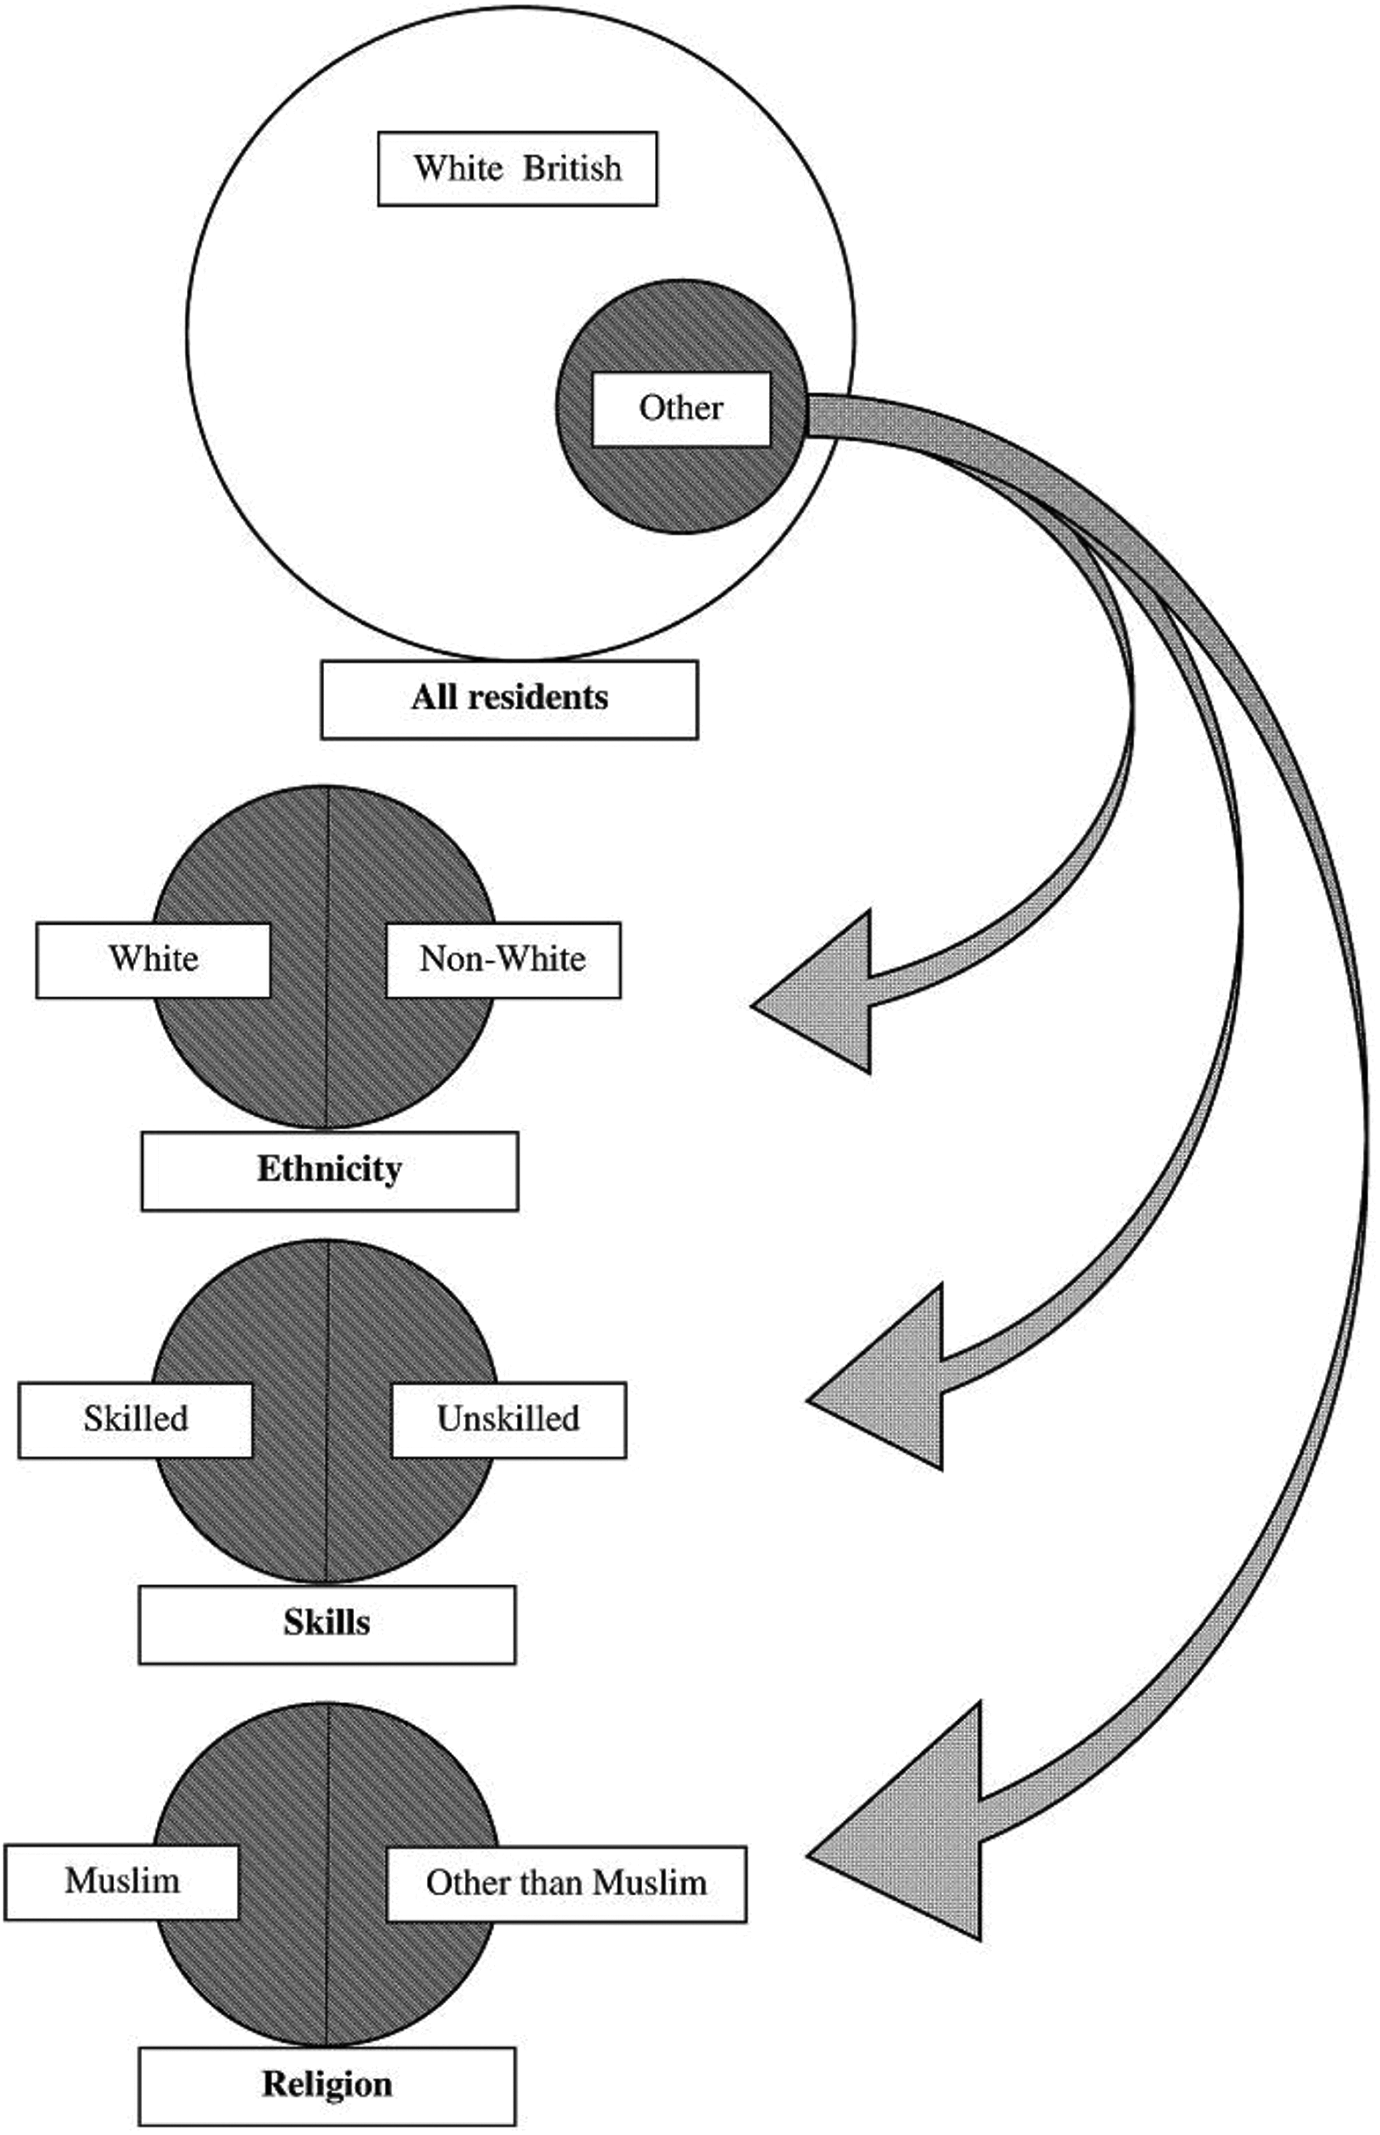
Measuring diversity according to different criteria: ethnic, combined ethnic and religion, combined ethnic and skills.
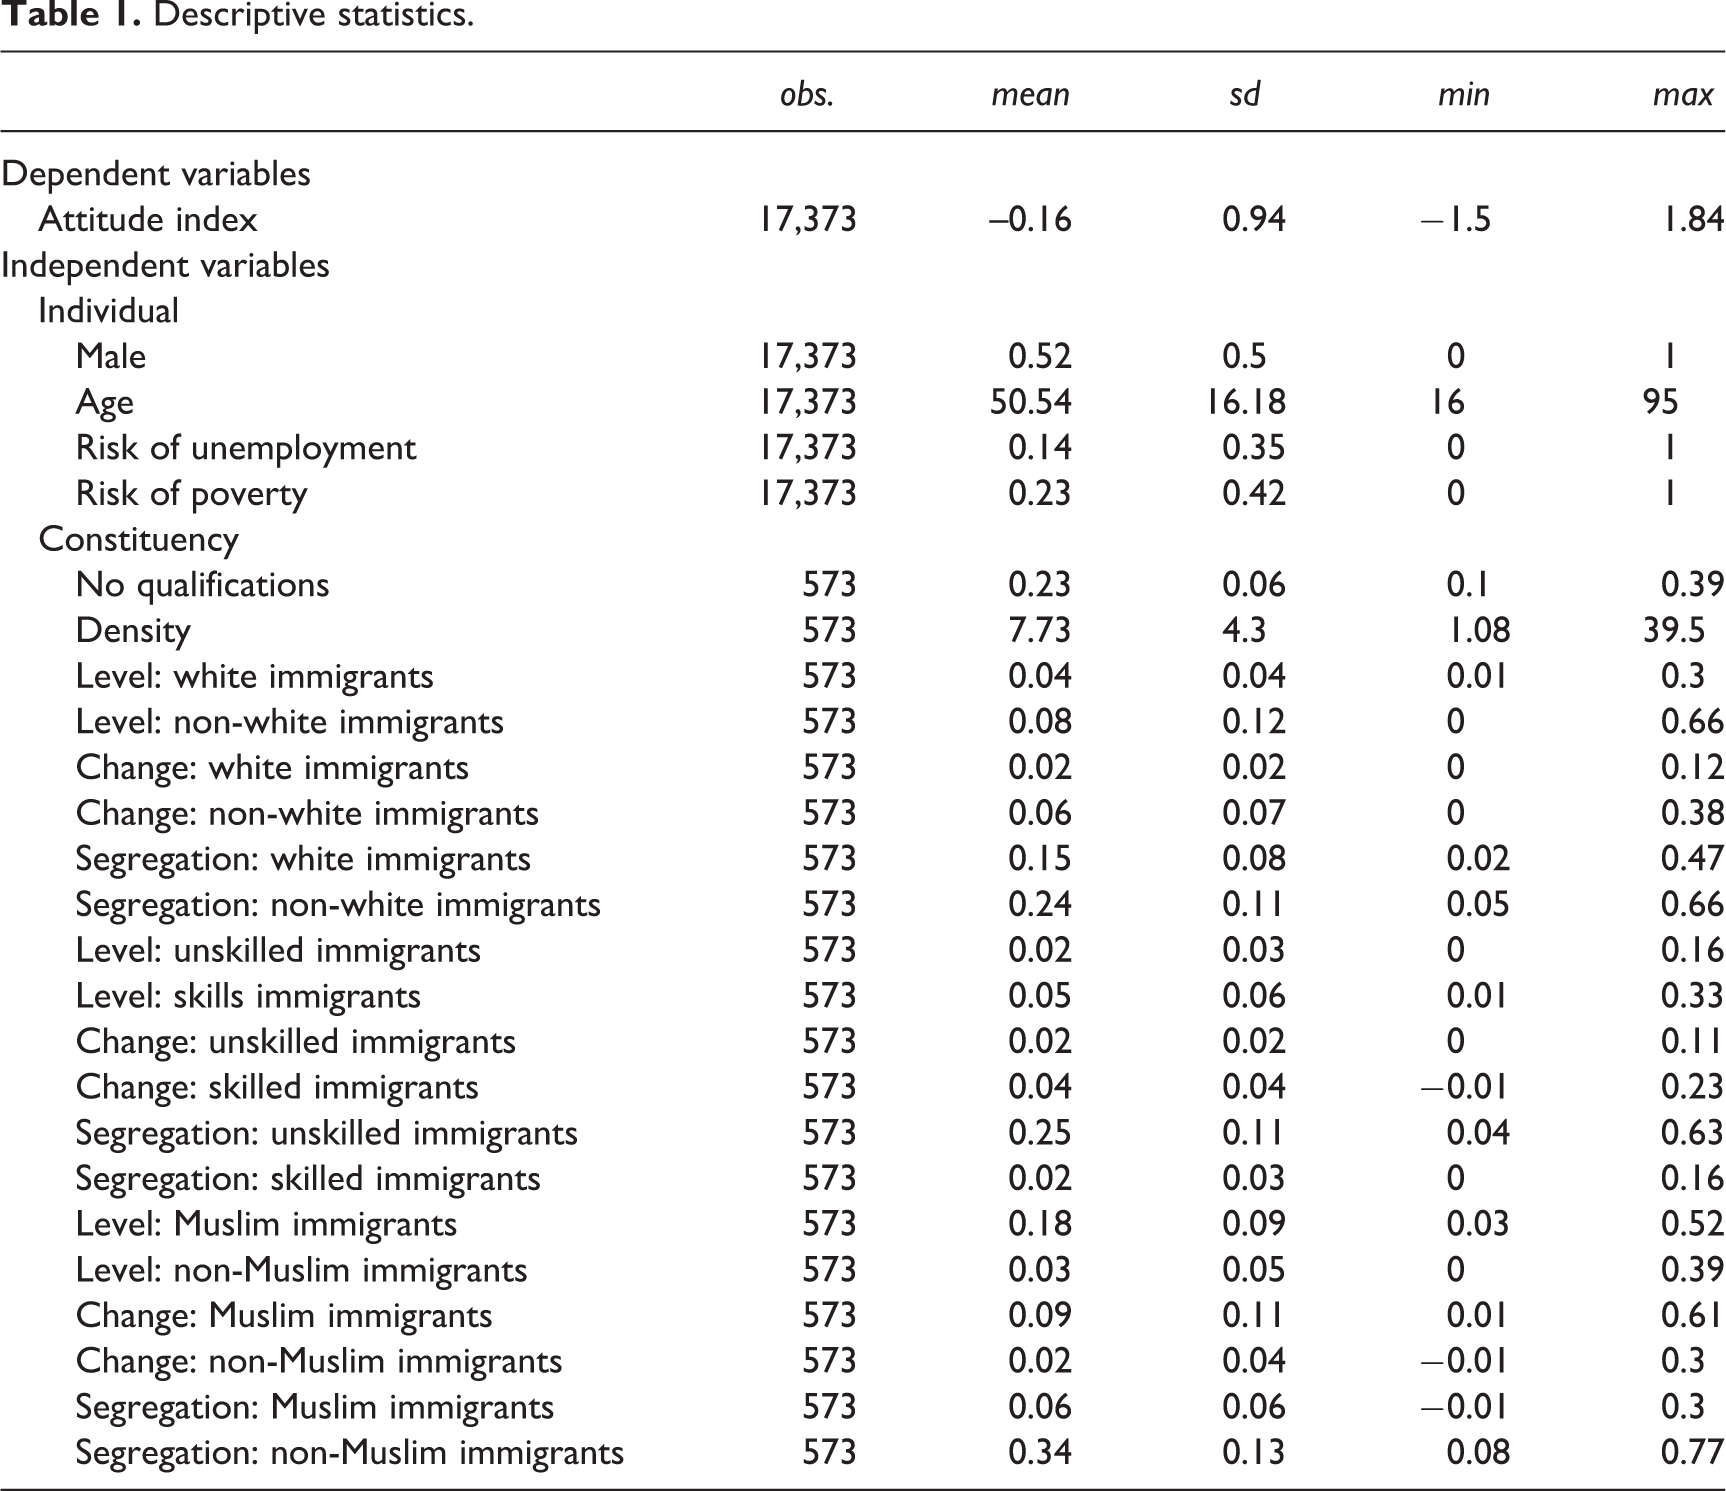
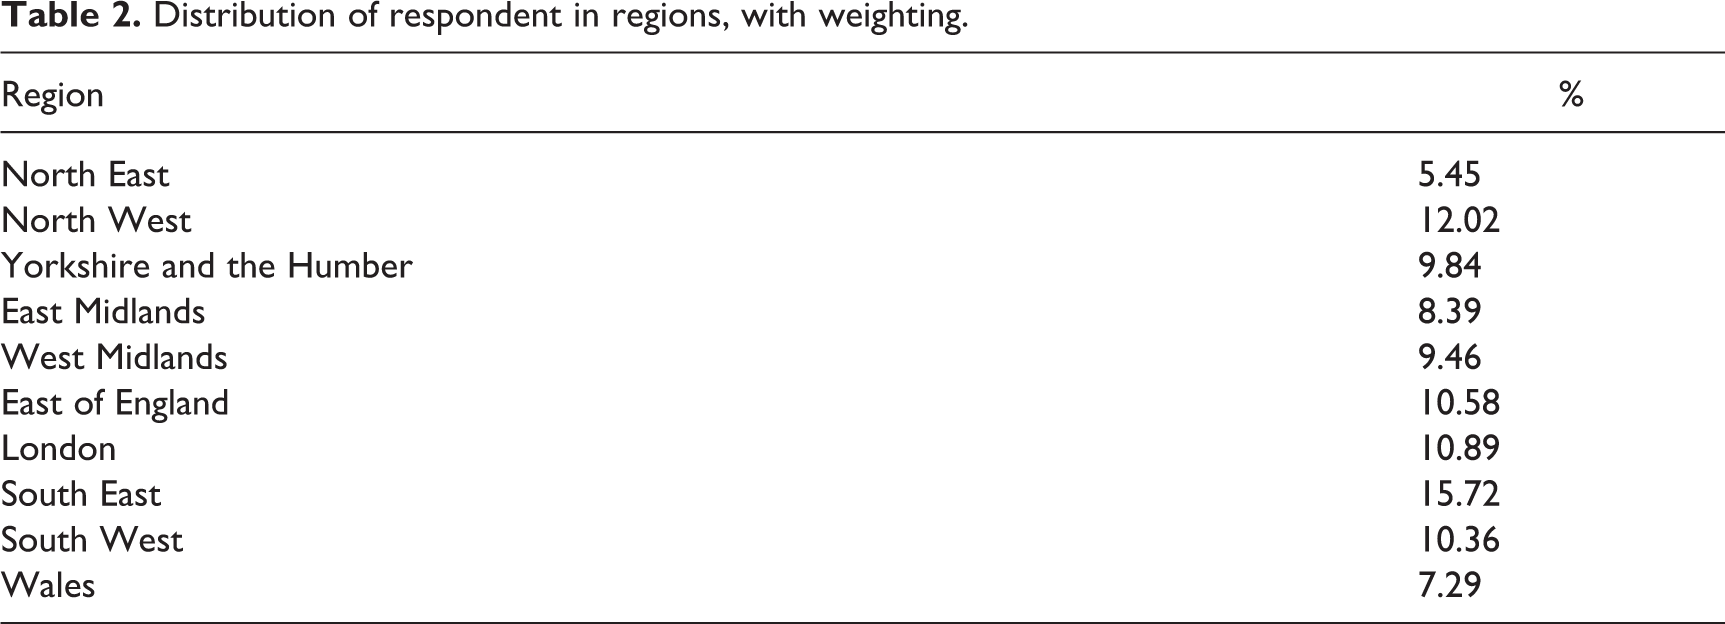
Contextual variables for population density at the constituency level and the percentage of the unemployed are also included as well as a regional dummy variable for 10 government office regions in England and Wales (NUTS1). Descriptive statistics for dependent and independent variables are shown in Table 1 and distribution of respondents (weighted) in Table 2.
Descriptive statistics.
Distribution of respondent in regions, with weighting.
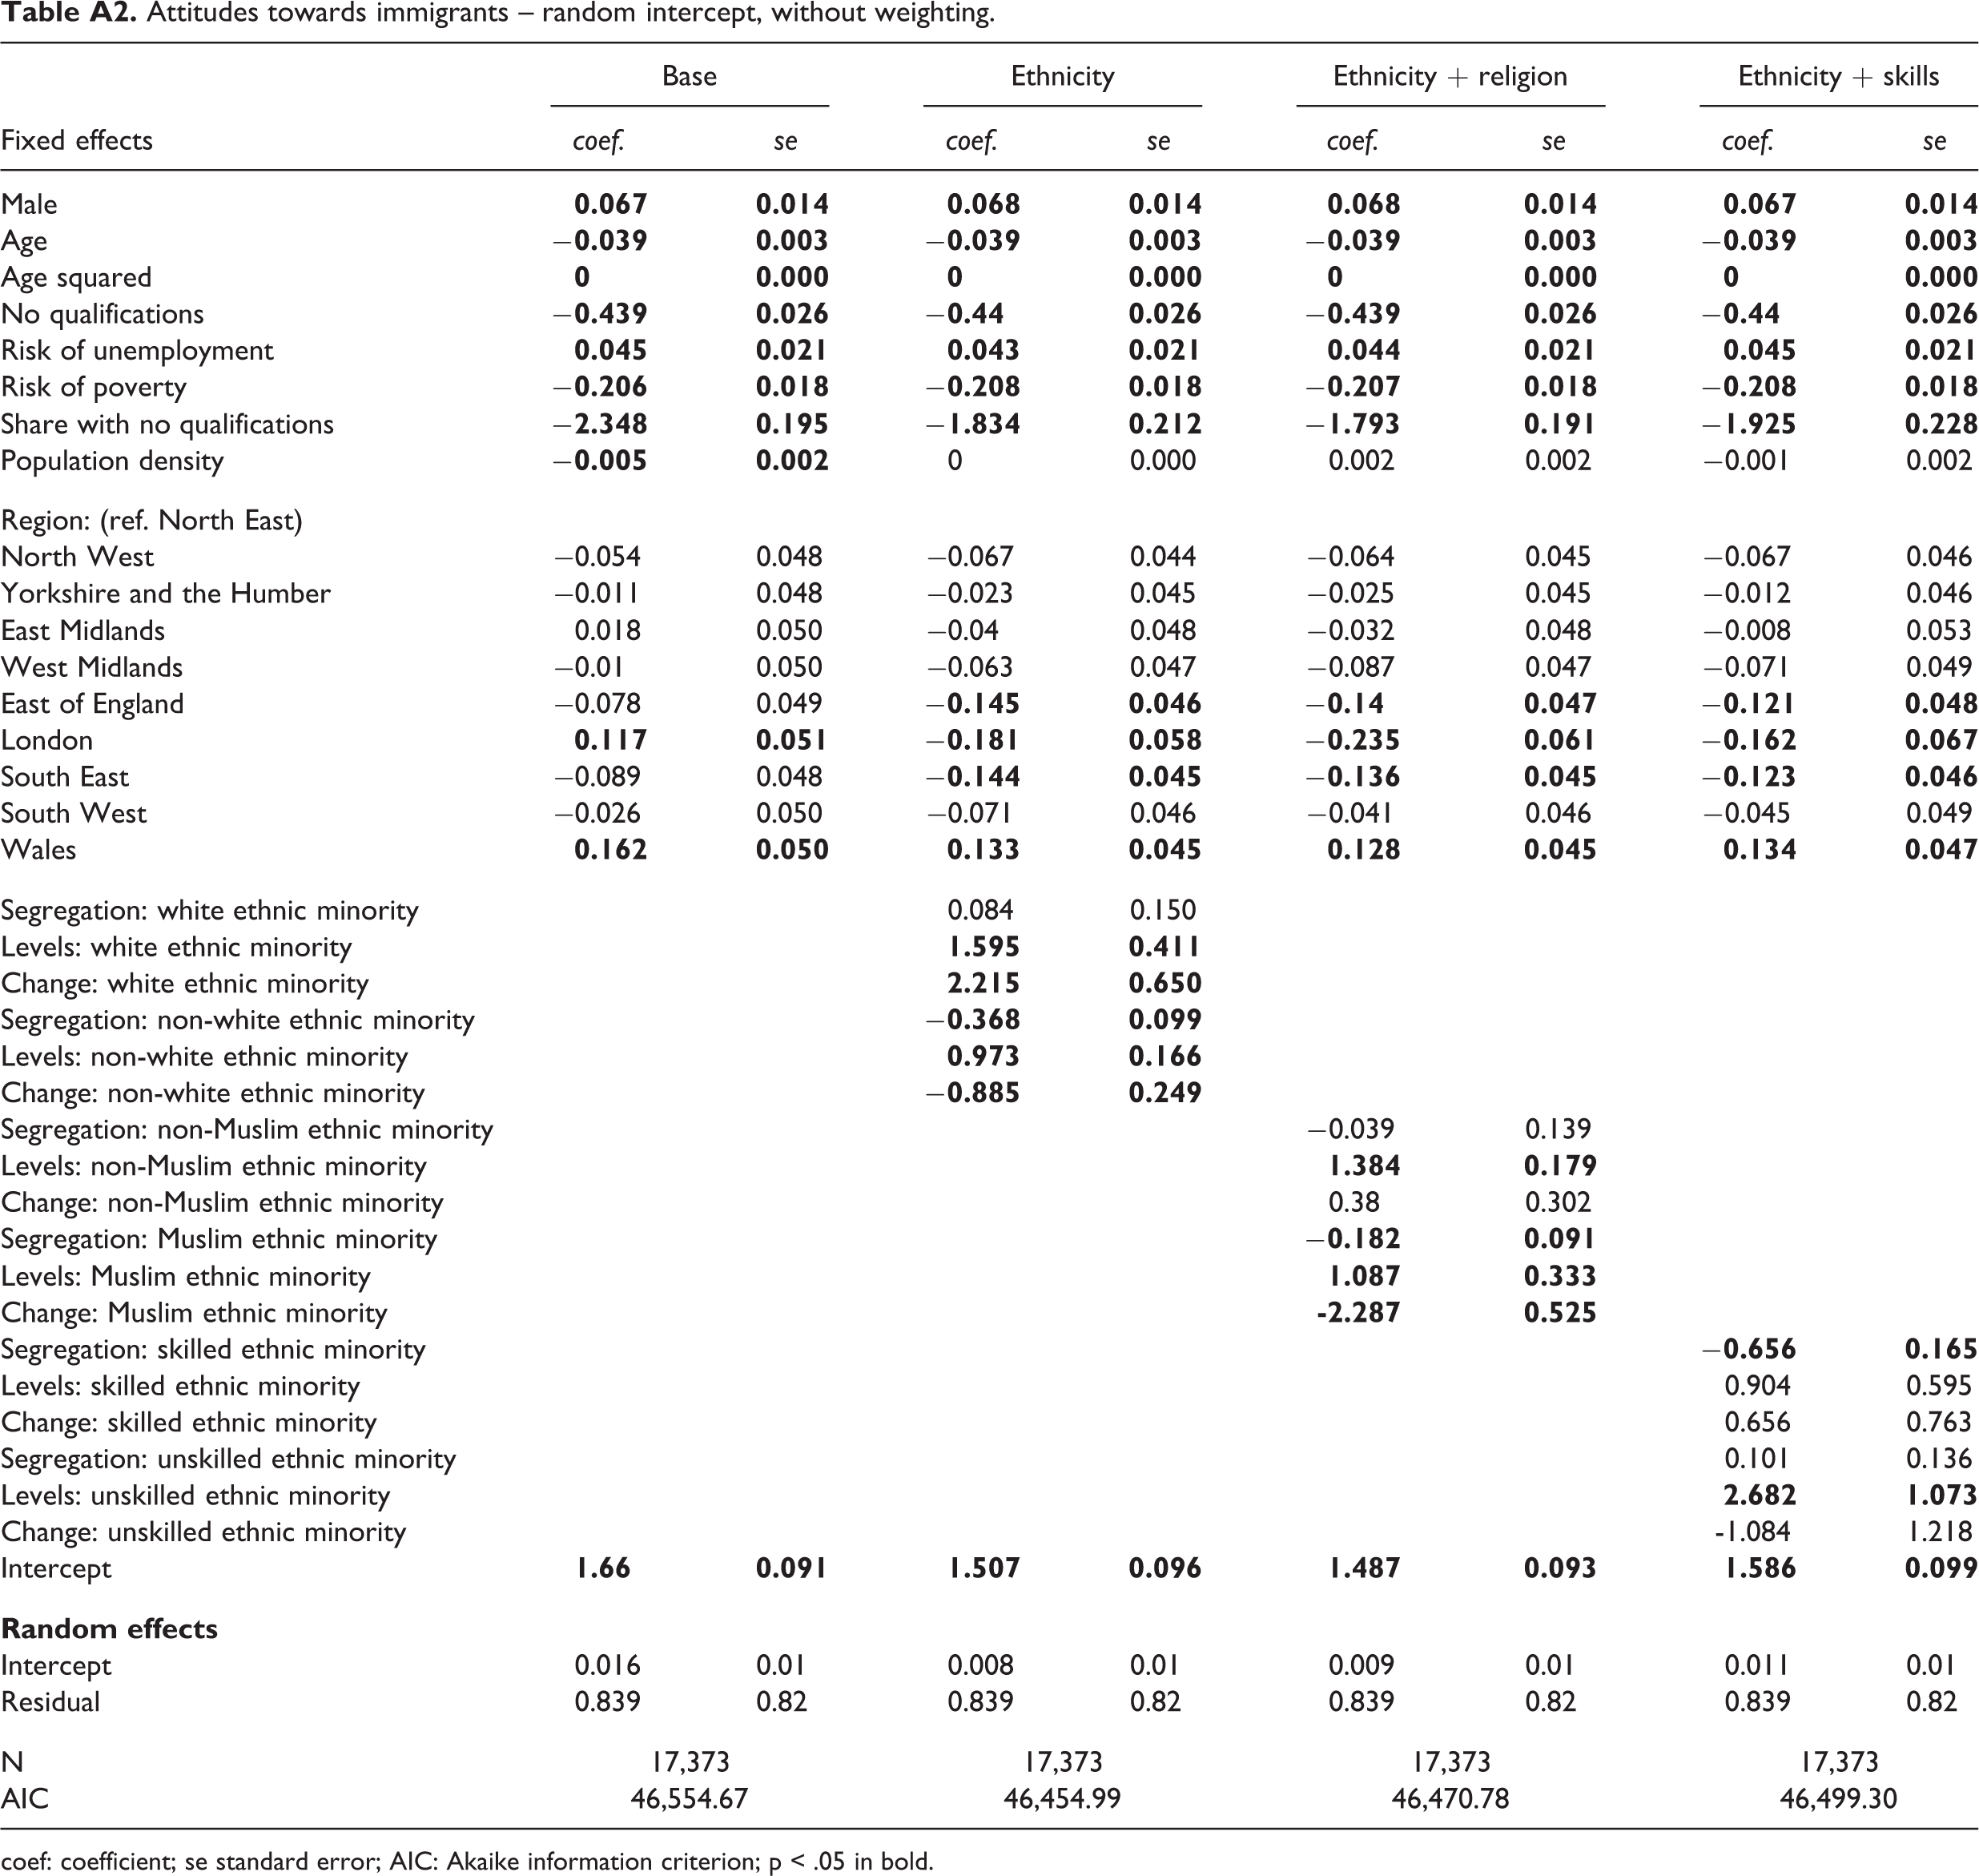
My data included information on individuals and the composition of the constituencies in which they are located. One method for analysing data in which individuals are nested within constituencies is multilevel modelling; my level 1 is the individual, and level 2 is constituency. Random coefficient models are preferred when dealing with nested sources of variability and when the association between dependent variables and level 1 might vary between level 2 units (Rabe-Hesketh and Skrondal, 2008). Regressions are weighted using the BES importance weights for Wave 4. In the appendix, I present random intercept models. There, I also present results from an unweighted random intercept model, following the advice of Winship and Radbill (1994) on the use of weighting in regression. These models give broadly similar results in terms of the main variables of interest; in particular, they all show that models based on ethnicity offer the greatest reduction in akaike information criterion (AIC) score and show the different effect of levels and changes.
Results
To assess whether local context is important for attitudes, I looked at the percentage of variance in attitudes explained by cross-constituency differences compared to individual differences. I ran the null model with a constant and random variation between and within constituencies. This gives the Interclass Correlation (ICC), calculated by dividing the variance at the constituency level by the total variance. The ICC shows that only about 6% of total variance in attitudes is attributable to a difference across constituencies, with the remaining 94% attributed to individual differences. This in itself is an important observation; natives’ views about immigration are not influenced by their local context.
The scale of my dependent variable ranges from −1.57 (the most negative attitudes) to 1.86 (the most positive attitudes) with a standard deviation equal to 1. To test Hypotheses 1a–1c, I ran three separate models and examined which model led to the greatest reduction of AIC score compared to the base model (which did not include diversity measures). Akaike’s information criterion measures relative goodness of fit; it aids selection of a model that offers an acceptable fit to the data while minimizing the number of estimation parameters (Burnham and Anderson, 2004). The results are shown in Table 3 and Table 4. First, note that with a reduction in AIC score, models that include contextual diversity are much better than the base model. Model 1 is associated with the greatest reduction in AIC score compared to the base model (45,197.86 − 45,130.69 = 67.17), suggesting that ethnic diversity with ethnic minority residents divided into white and non-white groups performs better at explaining variance in attitudes toward immigrants than criteria based on ethnicity and religion or ethnicity and skills. This suggests that ethnic criteria are the most salient. Yet, contrary to what was expected from Hypotheses 1a–c, higher 2001 levels of immigrant population are for all groups associated not with more negative but more positive attitudes towards immigrants, the only group for which the coefficient is not statistically significant at 0.05 level is the levels of unskilled ethnic minority in Model 3.
Attitudes toward immigrants - random coefficient models.
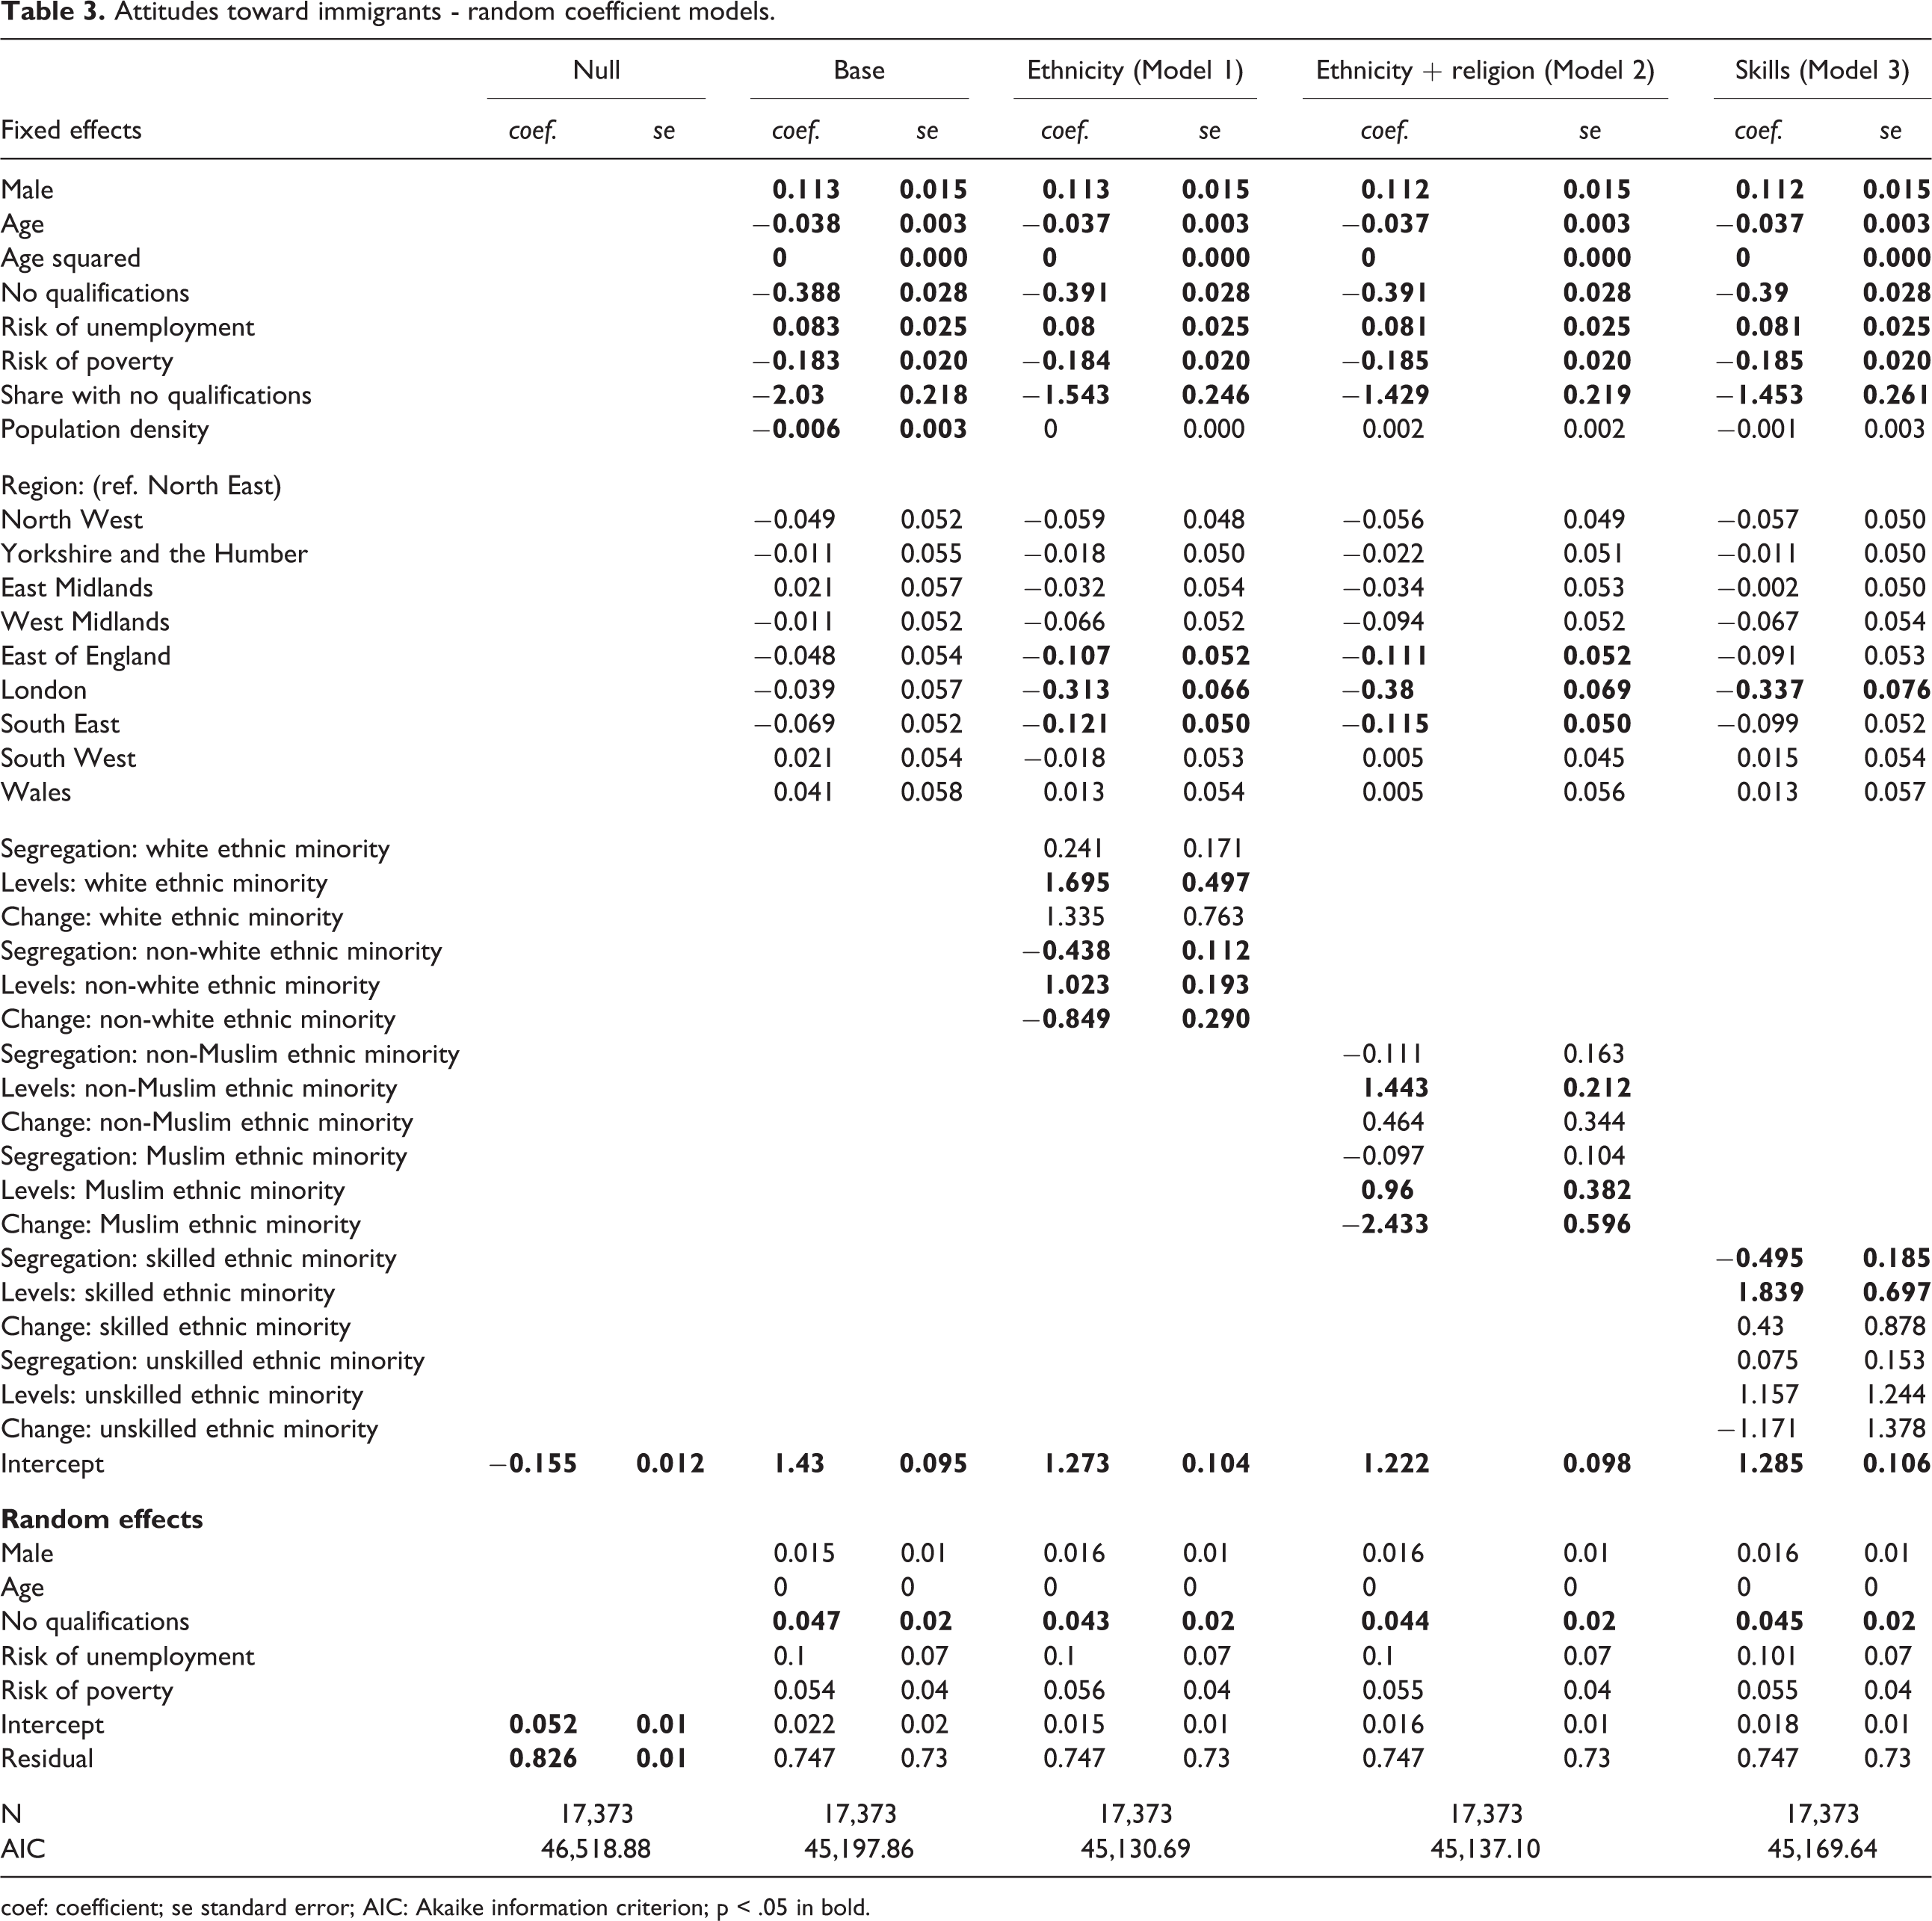
coef: coefficient; se standard error; AIC: Akaike information criterion; p < .05 in bold.
Attitudes toward immigrants - random coefficient models with interaction.
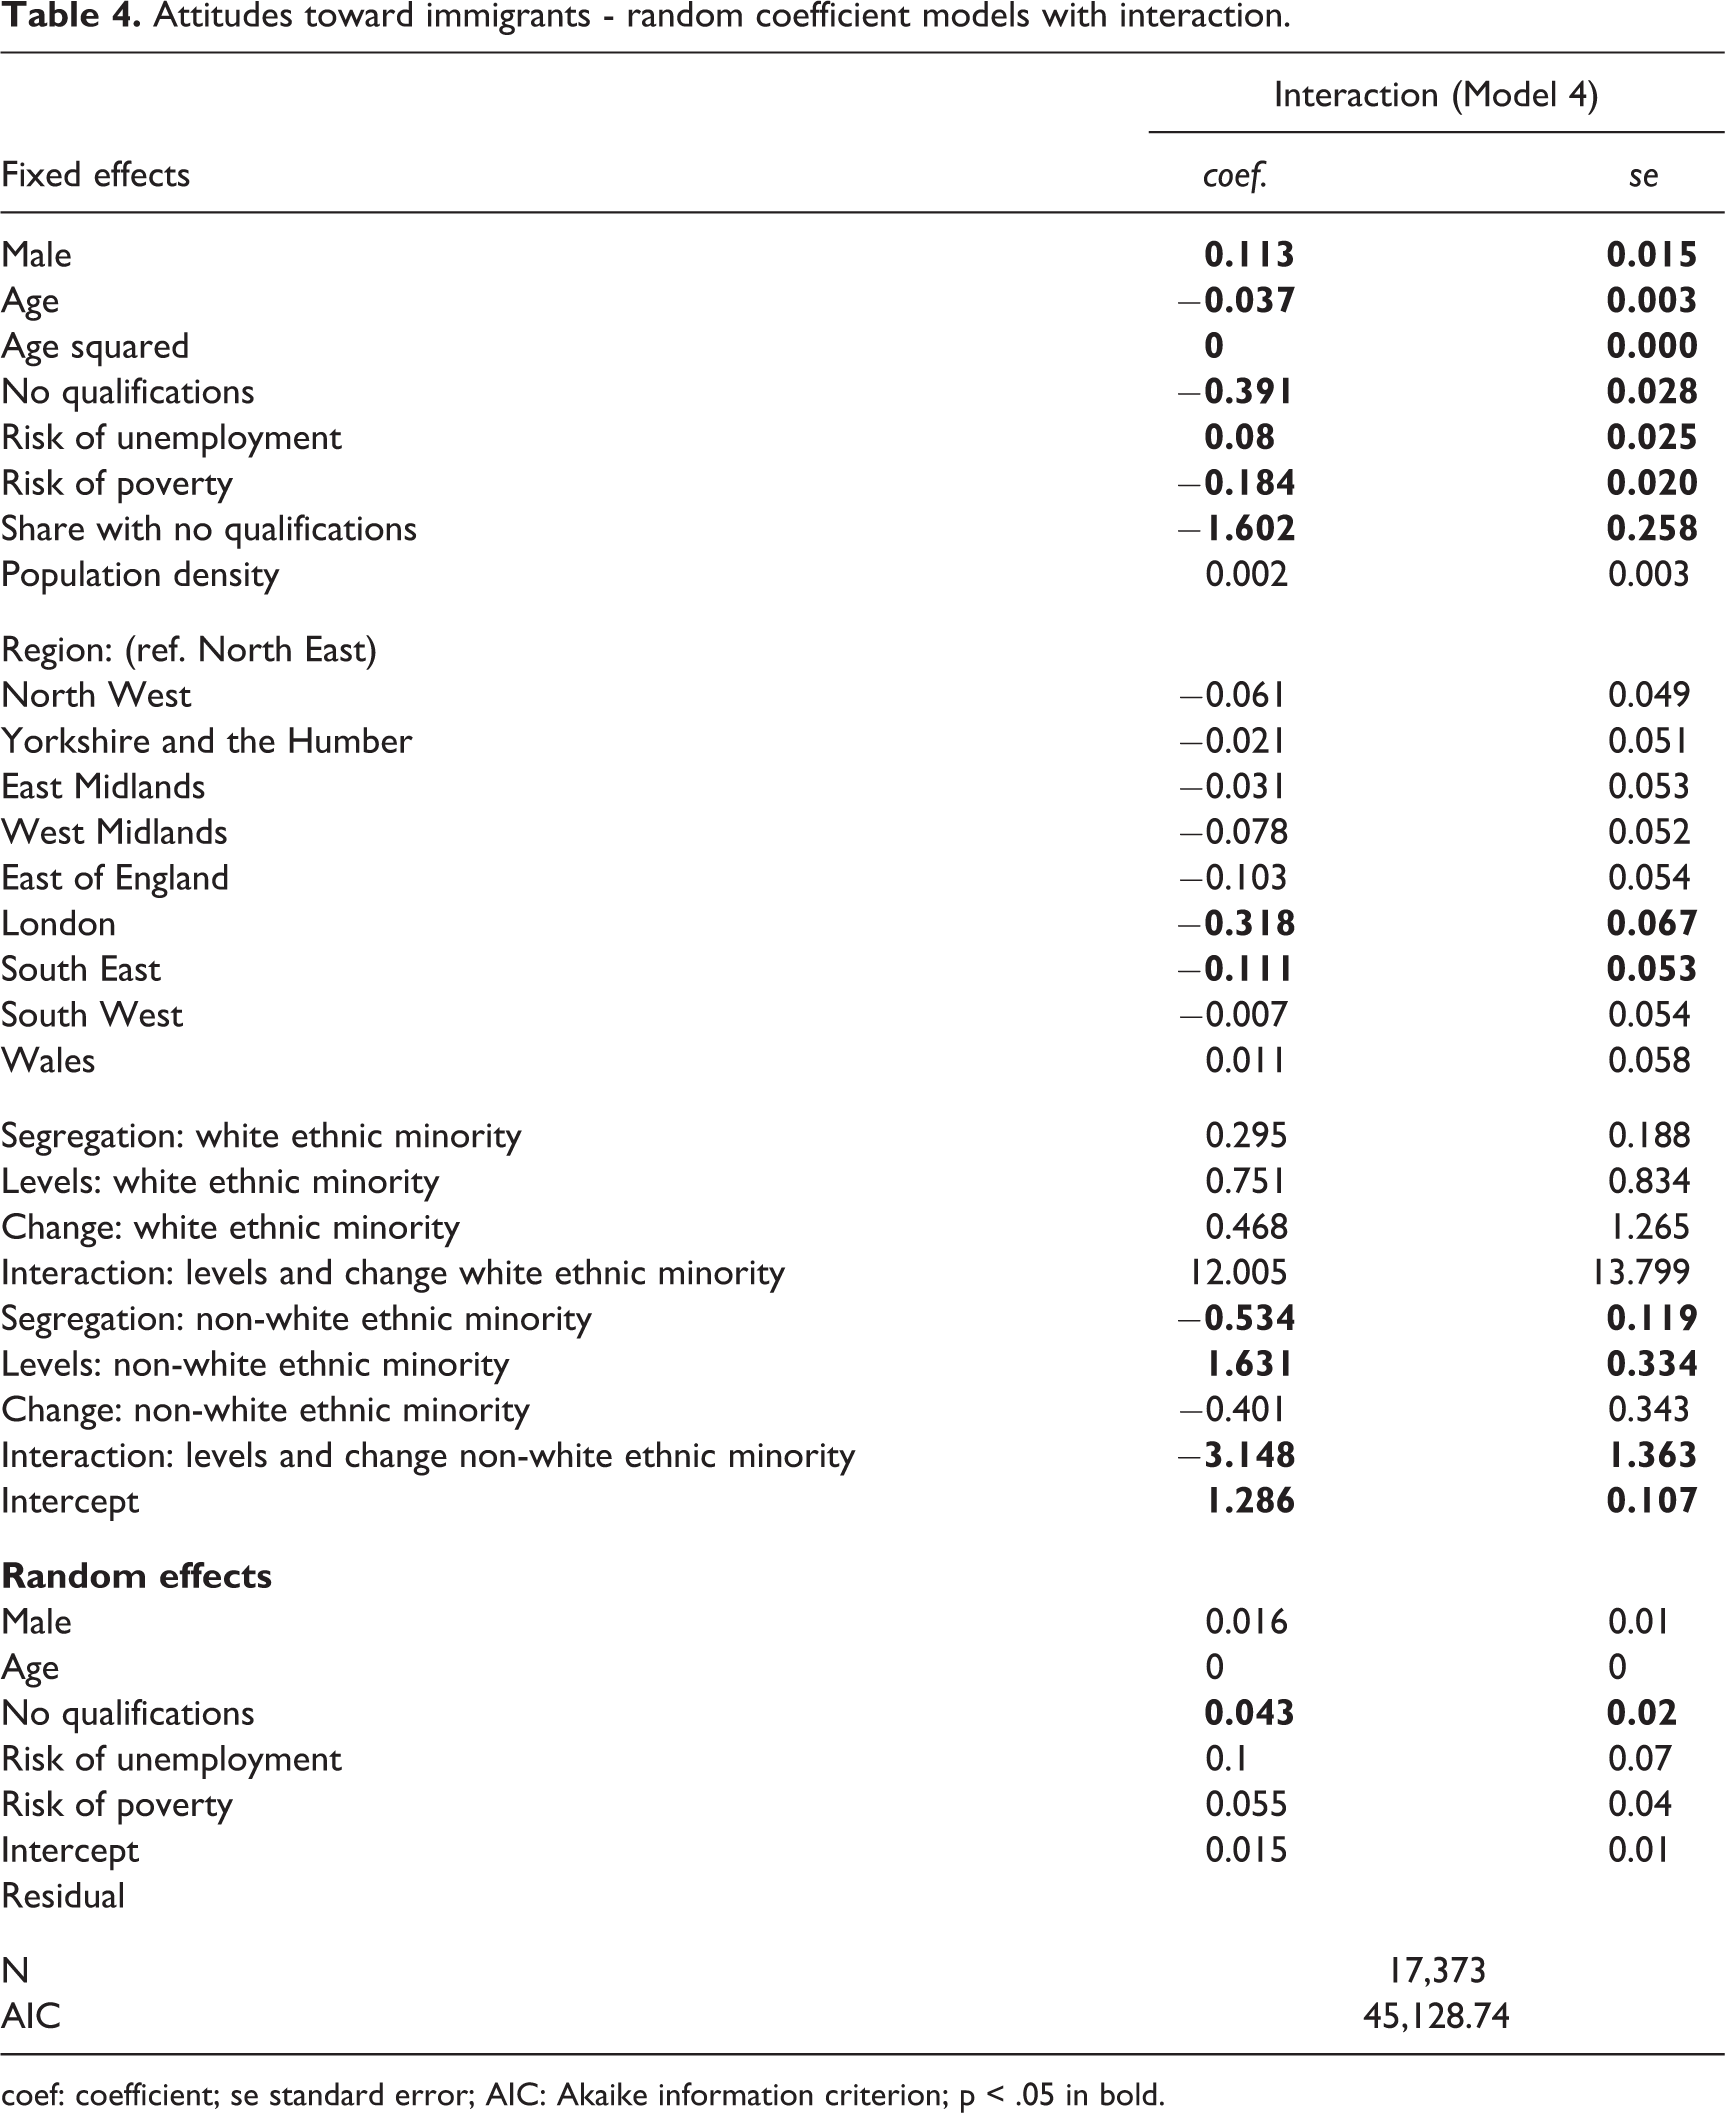
coef: coefficient; se standard error; AIC: Akaike information criterion; p < .05 in bold.
Hypothesis 2 about the impact of residential segregation is supported for the non-white ethnic minority. Rather surprisingly, the only other group for which segregation is statistically significant is the skilled ethnic minority group. The magnitude of the coefficient is similar in Model 1 and Model 3 (β = −0.438 for non-white ethnic minority and β = −0.495 for skilled ethnic minority, but note that segregation has on average higher values for non-white ethnic minorities): both are negative suggesting that higher segregation translates to more negative attitudes towards immigrants.
In Model 1 and Model 2 the coefficient for levels is higher for non-visible minorities: whites (compare β = 1.695 for white ethnic minority with β = 1.023 for non-white ethnic minority) and non-Muslims (compare β = 1.443 for non-Muslim ethnic minority with β = 0.95 for Muslim ethnic minority). What is associated with more negative views about immigrants is the change in visible minorities between 2001 and 2011: in constituencies experiencing larger growth of non-white ethnic minority and Muslim ethnic minority, the attitudes tend to be more negative (note that changes are not significant in Model 3 for skills). The different effect of levels and changes provides strong support to Hypotheses 3a–3c.
I also observed that the size of the coefficient for change was three times as large for change in Muslim ethnic minorities compared to that for non-white ethnic minorities (β = −2.433 compared with β = −0.849). This could suggest that change in the fraction of residents from this group is a source of greater threat, translating to more negative attitudes. To test Hypothesis 3c, I used the model with the lowest AIC score and added an interaction effect between the base levels and change for white and non-white ethnic minority groups. In Model 4, the interaction effect was statistically significant for non-whites (β = −3.148). Figure 2 shows how both variables affected the estimated attitude index. Attitudes toward immigrants were most positive in constituencies with larger base levels of non-white population and little change in the non-white population. Living in constituencies with low base levels of non-white population was associated with a more negative evaluation of immigrants; however, in this case, further changes did not seem to matter as much. For those living in constituencies with high base levels of non-white population, changes mattered more (note that the negative slope for the high base level is steeper). Model 4 also shows that higher levels of residential segregation were associated with more negative attitudes towards non-white ethnic minority groups; the effect was not significant for white ethnic minority groups, similar to the effect of levels and changes for this group. One possibility is that this is because of visibility; natives associated diversity with non-whites more because they are easier to notice.
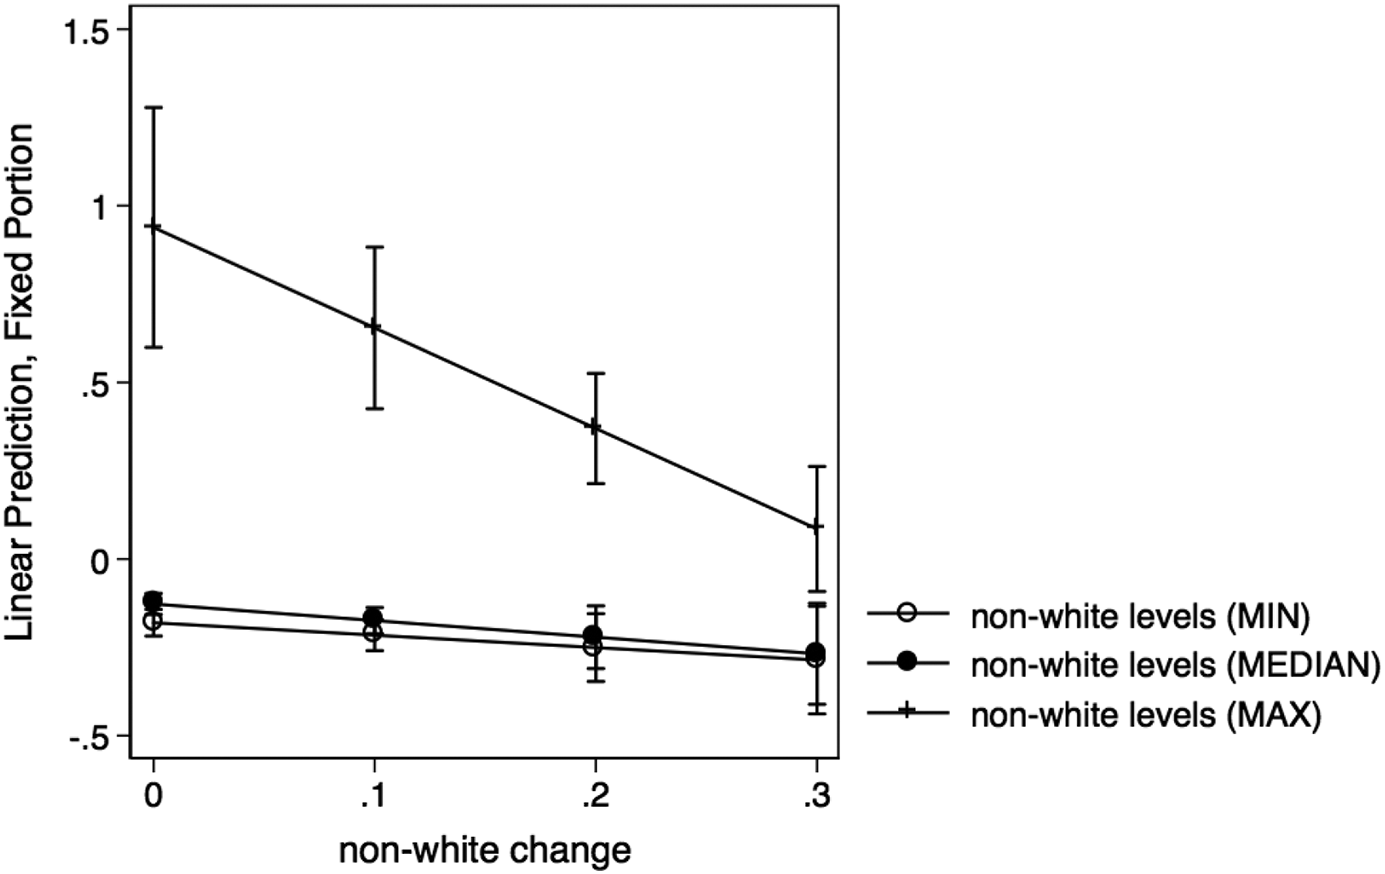
The effect of changes on attitudes towards immigrants at different base levels; predictive margins with 95% CIs.
Discussion
As observed by Fieldhouse and colleagues (2019), public concern tracks actual levels of immigration remarkably well in the United Kingdom, yet the mechanisms that connected the two are not well established. To what extent attitudes toward immigration are shaped by local demographic realities as opposed to other sources has been an issue of some debate. This article aims to contribute to this debate by testing the association between attitudes and levels and changes in ethnic minority residents defined in terms of ethnic, religious and skill-based criteria. I provide evidence for a weak effect of local experience.
In this study I have tested whether the same mechanisms apply to differently defined groups, an issue which has been highlighted by Pottie-Sherman and Wilkes (2017) who note that findings on the impact of local diversity on attitudes towards immigrants depend on the groups chosen to represent immigrant groups. I find that ethnic diversity is more salient in determining attitudes toward immigration, compared with religious diversity or presence of low-skilled non-white British residents. Recent work by Jeannet (2020) shows that national level migration from E8 countries to Western European countries can be linked to public scepticism about the consequences of immigration, but my finding suggests that when it comes to attitudes toward immigration, direct exposure to low skilled migrants from Central and Eastern European may be less important than local exposure to ethnic diversity.
Similar to the findings reported by Laurence and colleagues (2019), I confirmed that context with higher segregation levels between white British and non-white residents is associated with more negative attitudes toward immigration, even net of demographic levels and changes. Furthermore, I found that base levels and changes in levels of non-white population are both associated with attitudes. I confirmed that pre-existing levels are associated with more positive attitudes, while change fosters more negative attitudes. This is similar to the argument made by Meuleman and colleagues (2009), who observe that changes in attitudes are driven by changes in diversity and the threat perceived by natives. While stable levels may not affect changes in attitudes towards minority groups (or they may be even associated with reduction of prejudice over time due to contact), further increase in diversity may lead to more anti-immigration sentiment. Importantly, the interaction effect found in this study differs from predictions derived from the ethnic competition theory or the defended neighbourhood hypothesis. I find that changes are associated with more hostility, and this effect is more pronounced in constituencies with higher pre-existing levels of non-white population. A plausible explanation is that while areas with higher pre-existing levels of non-white population offer more opportunities for contact, the speed of change undermines natives’ ability to accommodate further changes. In other words, the prejudice-reducing mechanisms of interpersonal contact cannot catch up with the threat responses triggered by the rapid growth of the immigrant population. This result can be discussed in reference to Bowyer’s influential study (2009), where the author found that natives in England do not view different ethnic minority groups as equally threatening. Bowyer reported that while the share of black residents at local ward level was associated with lower prejudice, the share of East Asian residents was associated with increased racial prejudice. The author suggested that this may be because of religion – black residents are predominantly Christian, while South Asian residents are not. An alternative explanation that is in line with my findings has to do with the length of stay – black migration in Britain has a longer history and perhaps more time to habituate than the more recent migration from Pakistan or Bangladesh.
When discussing the implications of these results, it is important to consider their limitations. My dependent variables rely on respondents’ evaluation of factual statements. Alternatively, one could ask respondents for their views about immigrants, but then I would run into a problem of desirability bias. I argue that the problem is to some degree alleviated because I created an index from three factual statements, referring to immigrants’ impact on the economy, culture and the welfare state. My measure of attitudes is also arguably better than that employed in another British study looking at the link between local levels and changes in diversity and attitudes towards immigrants (Kaufmann, 2017). The dependent variable used by Kaufmann is constructed from a question on whether there should be a reduction in immigration levels into the United Kingdom, the answers to which are skewed (81% of respondents thought immigration should be reduced) and may be too blunt a measure to capture attitudes towards immigrants.
A note of caution is also due in respect to making statements about the causal link between positive attitudes towards immigrants and diverse context. Dustmann and Preston (2001) have previously argued that ethnic composition should not be treated as an exogenous variable in attitudinal studies, especially if units of analysis are small. Finding that a higher share of immigrants is associated with more positive attitudes towards immigrants does not warrant a conclusion that the presence of immigrants positively influenced natives’ attitudes; an alternative interpretation would be that those with the most negative attitudes simply moved out. I do not have a direct way to ensure that this mechanism did not influence my results; however, I can cite a study by Kaufmann and Harris (2015), who showed that while it is true that white movers generally select whiter destinations than ethnic minorities, there is little difference in the diversity of the destinations of those who tend to be pro-immigration (that is, left leaning with a degree) and those who are usually against it (declaring an English identity).
Future research on contextual determinates of attitudes towards immigrants would benefit from further investigation of the dynamic nature of contractual effects, for instance by employing difference in difference design or panel data modelling. Nordic register data may provide a promising avenue for such research, if coupled with geocoded survey data. Lastly, let me reiterate that while this study shows there exists a weak contextual effect, the vast majority of variance in attitudes toward immigration is attributable to individual level differences. Future research should attempt to better understand what other factors, aside from local demographic realities, shape these attitudes.
Footnotes
Appendix
Attitudes towards immigrants – random intercept, without weighting.
| Fixed effects | Base | Ethnicity | Ethnicity + religion | Ethnicity + skills | ||||
|---|---|---|---|---|---|---|---|---|
| coef. | se | coef. | se | coef. | se | coef. | se | |
| Male |
|
|
|
|
|
|
|
|
| Age |
|
|
|
|
|
|
|
|
| Age squared |
|
|
|
|
|
|
|
|
| No qualifications |
|
|
|
|
|
|
|
|
| Risk of unemployment |
|
|
|
|
|
|
|
|
| Risk of poverty |
|
|
|
|
|
|
|
|
| Share with no qualifications |
|
|
|
|
|
|
|
|
| Population density |
|
|
0 | 0.000 | 0.002 | 0.002 | −0.001 | 0.002 |
| Region: (ref. North East) | ||||||||
| North West | −0.054 | 0.048 | −0.067 | 0.044 | −0.064 | 0.045 | −0.067 | 0.046 |
| Yorkshire and the Humber | −0.011 | 0.048 | −0.023 | 0.045 | −0.025 | 0.045 | −0.012 | 0.046 |
| East Midlands | 0.018 | 0.050 | −0.04 | 0.048 | −0.032 | 0.048 | −0.008 | 0.053 |
| West Midlands | −0.01 | 0.050 | −0.063 | 0.047 | −0.087 | 0.047 | −0.071 | 0.049 |
| East of England | −0.078 | 0.049 |
|
|
|
|
|
|
| London |
|
|
|
|
|
|
|
|
| South East | −0.089 | 0.048 |
|
|
|
|
|
|
| South West | −0.026 | 0.050 | −0.071 | 0.046 | −0.041 | 0.046 | −0.045 | 0.049 |
| Wales |
|
|
|
|
|
|
|
|
| Segregation: white ethnic minority | 0.084 | 0.150 | ||||||
| Levels: white ethnic minority |
|
|
||||||
| Change: white ethnic minority |
|
|
||||||
| Segregation: non-white ethnic minority |
|
|
||||||
| Levels: non-white ethnic minority |
|
|
||||||
| Change: non-white ethnic minority |
|
|
||||||
| Segregation: non-Muslim ethnic minority | −0.039 | 0.139 | ||||||
| Levels: non-Muslim ethnic minority |
|
|
||||||
| Change: non-Muslim ethnic minority | 0.38 | 0.302 | ||||||
| Segregation: Muslim ethnic minority |
|
|
||||||
| Levels: Muslim ethnic minority |
|
|
||||||
| Change: Muslim ethnic minority |
|
|
||||||
| Segregation: skilled ethnic minority |
|
|
||||||
| Levels: skilled ethnic minority | 0.904 | 0.595 | ||||||
| Change: skilled ethnic minority | 0.656 | 0.763 | ||||||
| Segregation: unskilled ethnic minority | 0.101 | 0.136 | ||||||
| Levels: unskilled ethnic minority |
|
|
||||||
| Change: unskilled ethnic minority | -1.084 | 1.218 | ||||||
| Intercept |
|
|
|
|
|
|
|
|
|
|
||||||||
| Intercept | 0.016 | 0.01 | 0.008 | 0.01 | 0.009 | 0.01 | 0.011 | 0.01 |
| Residual | 0.839 | 0.82 | 0.839 | 0.82 | 0.839 | 0.82 | 0.839 | 0.82 |
| N | 17,373 | 17,373 | 17,373 | 17,373 | ||||
| AIC | 46,554.67 | 46,454.99 | 46,470.78 | 46,499.30 | ||||
coef: coefficient; se standard error; AIC: Akaike information criterion; p < .05 in bold.
Acknowledgements
Earlier versions of this paper were presented at the European Consortium for Sociological Research conference and the Institute for Analytical Sociology annual symposium. I am grateful to Michael Biggs, Jon Mellon, Anna Krusova, Tak Wing Chan and colleagues at the Institute for Analytical Sociology at Linköping University for their feedback. I would also like to thank three anonymous reviewers for their valuable comments.
Funding
The author disclosed receipt of the following financial support for the research, authorship and/or publication of this article: The research was supported by the Economic and Social Research Council in the UK and Forte, Swedish Research Council for Health, Working Life (Grant Nos. 505175 and 2015-01200).