
Abstract
Dynamic fluorescence images were obtained from xenografts bearing a subcutaneous human Kaposi's sarcoma (KS1767) immediately following the intravenous injection of an integrin-receptor targeting Cy5.5-c(KRGDf) at a dose ranging from 0.75 to 6 nmol/mouse. The fluorescence images were acquired using an intensified charge-coupled device system and were analyzed with a three-compartment pharmacokinetic (PK) model to determine uptake parameters in the tumor and normal tissue regions of interest as a function of administered dose. Our results show that the uptake of Cy5.5-c(KRGDf) in tumor regions were: (i) significantly greater than the contralateral normal tissue regions; (ii) linearly increased with dose of Cy5.5-c(KRGDf) up to 1.5 nmol/mouse; and (iii) blocked by preinjection of c(KRGDf). Above doses of 1.5 nmol/mouse, the uptake no longer increased with dose, suggesting integrin receptor saturation. In normal tissues, the PK uptake parameters were not influenced by Cy5.5-c(KRGDf) dose nor by the preadministration of c(KRGDf).
Keywords
Introduction
Integrins are a large family of heterodimeric glycoproteins consisting of two subunits, α and β [1]. One of the integrins, αvβ3, also known as a vitronectin receptor, is recently reported to play an important role in tumor metastasis [2–5] and angiogenesis [6], which is the growth of new blood vessels from preexisting vasculatures during tumor growth [3,7,8]. This integrin is expressed on tumor cells during angiogenesis [9–14]. Furthermore, it has been shown that antagonists of αvβ3 induce tumor regression and apoptosis of angiogenic endothelial cells [14–16], which implies that the integrin αvβ3 may be a viable marker for the tumor growth and spread. Therefore, noninvasive imaging methods for quantitative and visual monitoring of integrin αvβ3 expression in real-time could provide opportunities for assessing therapeutic intervention as well as for detection of metastasis.
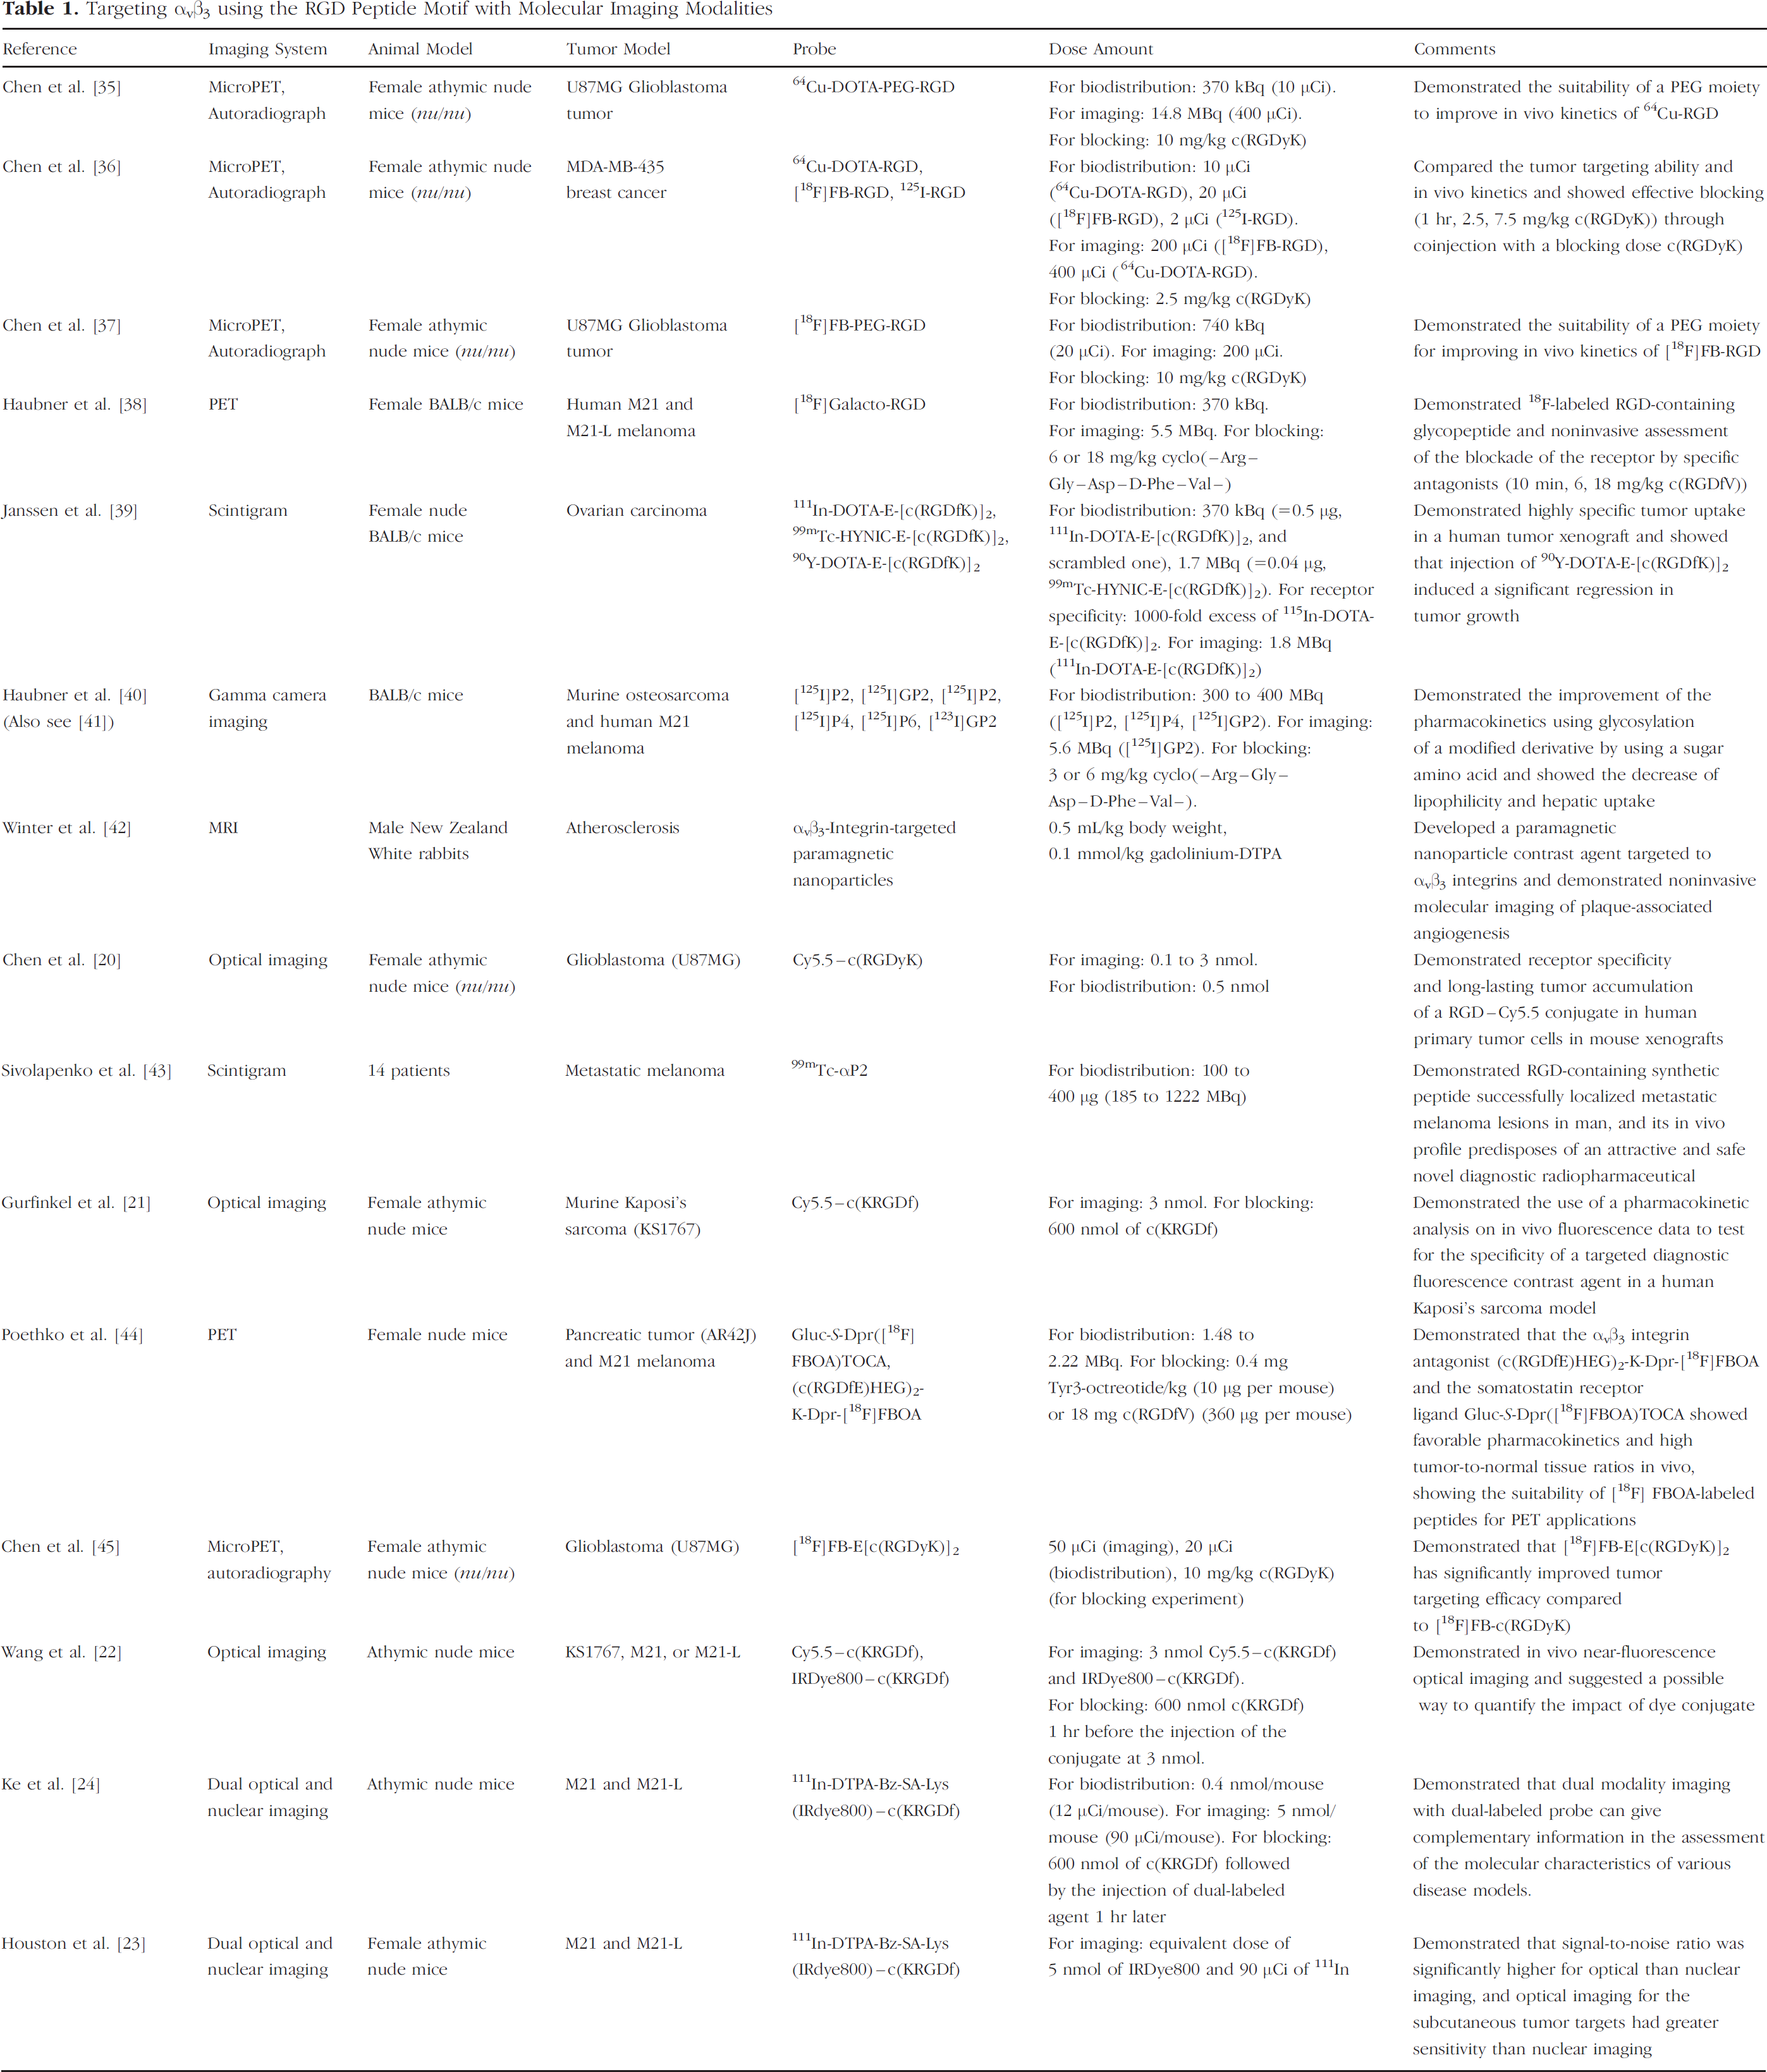
Kaposi's sarcoma (KS1767), a frequent cancer in HIV-infected patients [17], is richly vascularized, characterized by intense angiogenesis, and has high αvβ3 expression [18,19]. The arginine-glycine-aspartic peptide sequence (RGD) has been identified as one antagonist of αvβ3 and has been radiolabeled for diagnostic imaging and therapeutic purposes. Table 1 contains a listing of experimental cancer imaging performed by targeting αvβ3 using the RGD peptide motif. To date, with the exception of a few laboratories [20–22], all RGD-based imaging has been performed using the “gold standard” of molecular nuclear imaging. In a recent analysis of nuclear and near-infrared (NIR) optical scintigraphy in which animals bearing human melanoma were administered a dual-labeled RGD imaging agent, we have shown that fluorescence imaging has significantly higher signal per mass of agent, enabling rapid and dynamic imaging [23,24]. Unfortunately, to date there are no standardized fluorescence imaging systems and newly reported evidence from our laboratories suggests that target-to-background (TBR) values generated from intensity-based fluorescence imaging systems which produce planar images may be more likely dependent upon instrumentation than on the selectivity of the targeting contrast agent [25].
Targeting αvβ3 using the RGD Peptide Motif with Molecular Imaging Modalities
Although tomographic imaging systems are under development in our laboratory as well as in others, we have taken advantage of the high signal afforded by fluorescence imaging and have developed dynamic optical imaging to determine the rate of fluorescent agent uptake which is not dependent upon instrumentation artifacts as TBR may be [25,26]. In addition, we have shown that pharmacokinetic analysis of dynamic optical imaging can provide quantitative information relating to the availability of integrin receptor target as caused by the administration of unlabeled RGD peptide one hour prior to administration of the targeted imaging agent [21]. Our pharmacokinetic analysis assumed three compartments: (i) unbound conjugate in the vascular space; (ii) unbound conjugate in the extravascular space; and (iii) bound conjugate in the vascular and extravascular spaces as associated with proliferating endothelium as well as Kaposi's sarcoma cancer cells. Furthermore, we assumed an unsaturated receptor-binding model which predicts that the rate of uptake of fluorescent-labeled RGD depends linearly upon its concentration as well as on the density of available integrin receptors. When the administration of agent at large doses causes receptor saturation, the rate of uptake should be independent of the concentration of administered fluorescent-labeled RGD. Yet to date, there are no means to determine the concentration at which binding is saturated in vivo. For the purposes of molecular diagnostics, it is important to know the optimal dose of agent in order to avoid receptor oversaturation and excess administration of imaging agent. The optimal dose of a diagnostic agent may also provide information for the optimal dose of molecular therapeutic agents for individualized therapies. Yet to date, it is unclear whether the administration of a molecular diagnostic or therapeutic agent is at levels which cause saturation of the binding sites in vivo.
In this contribution, we demonstrate the use of dynamic optical imaging to assess changes in integrin-targeting as a function of agent dose in order to evaluate not only the availability of the integrin receptor, but also its expression level. From a noninvasive assessment of the disease marker availability through these dynamic molecular imaging approaches, a simplified and sensitive approach for individualized molecular therapies can be envisioned. In the following, we present the animal and tumor models, instrumentation, and pharmacokinetic models used to generate the dose-dependent pharmacokinetic response from planar, fluorescence optical imaging.
Materials and Methods
Animal and Tumor Models/Experimental Methods
Four to 6-week-old female athymic nude mice (nu/nu; 18–22 g) were purchased from Harlan Sprague Dawley (Indianapolis, IN) and housed five per cage and fed sterilized pelleted food (Harlan Sprague Dawley) and sterilized water. Animals were maintained in a pathogen-free mouse colony in the Department of Veterinary Medicine (The University of Texas M. D. Anderson Cancer Center, Houston, TX). The facility is accredited by the American Association for Laboratory Animal Care and all experiments were performed in accordance with the guidelines of the Institutional Animal Care and Use Committee. KS1767 tumor cells to be implanted into mice were harvested near confluence by incubation with 0.05% trypsin-EDTA. Cells (2–3 × 10⁶/animal) were implanted subcutaneously into the hind region of mice. Animals were subdivided into eight test groups (n = 3 for each test group) based on the dose amount of contrast agent administered. Six dose groups received different amounts of Cy5.5-c(KRGDf), while two blocking groups received RGD peptide at 300 or 600 nmol one hour prior to the administration of 3 nmol of RGD-Cy5.5. Prior to imaging and agent administration, mice were anesthetized with Nembutal (Sigma, St. Louis, MO; 50 mg/kg bw i.p.), and a tail vein catheter was introduced in each animal. Animals were then placed on the temperature-controlled water circulation pad (Heat Therapy Pump T/Pump, Model No. TP-500, Gaymar Industries, Orchard Park, NY) at 37°C under isoflurane anesthesia (VetEquip, Pleasanton, CA and IsoSol Isoflurane USP, VEDCO, St. Joseph, MO). Imaging commenced prior to the administration of agent.
Reagents, Dye, and Conjugate
Cyclo(Lys-Arg-Gly-Asp-Phe)[c(KRGDf)] was synthesized on linker-PL-DMA resin using Fmoc solid chemistry as described elsewhere [22]. Briefly, HMPB (3 eq) was attached to PL-DMA resin that had been treated with ethylenediamine overnight. The peptide was cleaved from the support with 1% TFA in dichloromethane with all side-chain protecting groups intact. The head-to-tail cyclization was then carried out in dichloromethane using PyBOP (3 eq), 1-hydroxybenzotriazole (6 eq), and DIPEA (6 eq) as coupling agents. After removal of all solvents, the residues were dissolved in ethyl acetate and washed with 5% NaHCO3, 2% KHSO4, and brine. All side-chain protecting groups were deprotected in TFA/H2O/triethylsilane (95/1/4 vol/vol/vol). The product was purified by reverse-phase HPLC, eluted with H2O-acetonitrile 0.1% TFA. To conjugate dyes with c(KRGDf), a solution of Cy5.5-NHS (1 eq) and c(KRGDf) (1.3 eq) in dimethylformamide/DIPEA (10/1, vol/vol) was stirred at room temperature overnight. After solvent was removed under vacuum, the compound was purified by reverse-phase HPLC, eluted with a 0.01-M solution of NH4OAc in water and acetonitrile, and lyophilized.
In Vivo Fluorescence Optical Imaging System/Data Processing and Statistics
The planar fluorescence optical imaging system used in these studies has been previously described [21,27]. Briefly, a laser diode (35 mW, 660 nm for Cy5.5 excitation) provided excitation light, which uniformly illuminated the whole body of the mouse through a convex lens and diffuser. To reject backscattered and reflected excitation light, a holographic notch-plus band rejection filter (660 nm center wavelength; Kaiser Optical Systems, model HNPF-660.0–2.0, Ann Arbor, MI, OD at λx reported to be >6) and a bandpass filter (710 nm center wavelength; CVI Laser, Albuquerque, NM, model, F10-710.0-4-2.00 OD at λx reported to be 3) were positioned prior to a 28–50-mm Nikkon lens (Nikon, Japan). Therefore, re-emitted fluorescence light and the small amount of leaked excitation light [25] were detected by an intensified charge-coupled device (ICCD) camera (Photometrics, model CH350/L, Tucson, AZ) coupled to an image intensifier (model FS9910C, ITT Night Vision, Roanoke, VA). When a low-power lamp provided a white light source for white light images, the filters were removed. All images were acquired by a personal computer with V++ imaging software (Digital Optics, Auckland, New Zealand). Imaging commenced with initial white light images and at least six images serving as “background” images prior to bolus administration of the imaging agent. Dynamic fluorescence images were acquired immediately following the injection of contrast agent for approximately 20 min. The injected dose of Cy5.5-c(KRGDf) was varied from 0.75 to 6 nmol per animal. The CCD integration time was 3000 msec for the 0.75-nmol dose, 1000 msec for 1- and 1.25-nmol doses, and 300 msec for 1.5-, 3- and 6-nmol agent doses in order to maintain signal-to-noise ratio. Fluorescence images were also obtained under isoflurane anesthesia at 24 and 48 hr after initial injection of the imaging agent at all doses.
After completion of the image acquisition, data analysis and processing were accomplished by Matlab software (The MathWorks, Natick, MA), SigmaPlot software package (SPSS, Chicago, IL), and ImageJ (National Institutes of Health, Bethesda, MD). First, the average of the six background images was subtracted from each of the acquired fluorescence images. Using white light images, two regions of interest (ROI), (i) the tumor and (ii) the contralateral normal ROI, were defined, each having the same numerical surface area. The mean of the fluorescence intensity within each ROI in each fluorescence image was calculated. Using these data, plots of mean fluorescence intensity versus time profiles after agent administration were fitted to solution of the pharmacokinetic models described below. The statistical analysis was performed with SPSS 12.0.1 statistical program (SPSS). The data from the nonlinear least-squares regression were analyzed using one-way ANOVA, LSD, and Student's t test. The differences were considered significant at p < .05.
Pharmacokinetic Model
The three-compartment pharmacokinetic models which describe molecularly specific uptake in the vascular or extravascular compartments are described schematically in Figure 1. The models are comprised of the unbound vascular component, unbound extravascular component, and the bound component whether associated with proliferating endothelium in the vascular space (Figure 1A) or cancer cells in the extravascular space (Figure 1B). In dynamic imaging studies, fluorescence intensity was detected at the animal tissue surface, which may be mediated by the time-invariant autofluorescence, and optical properties of scattering and absorption in the tissue over the short period of imaging time, and by the time-dependent concentration of the fluorophore within each compartment. The time-dependent fluorescent intensity can be expressed by


Description of two 3-compartment PK models.
For Figure 1A pre-exponential factors are given by:


For Figure 1A the time-dependent terms are given by:


The kinetic terms are different between the two models and are defined as illustrated in Figure 1A and B. In the initial dynamic imaging of short duration, the concentration difference between bound and unbound agent is the greatest and we assume reverse binding to be negligible as shown in Figure 1. Furthermore, if dyes do not experience specific molecular targeting, the vascular and extravascular compartments may be sufficient to describe their distribution. However, for dyes with molecular specificity, it is necessary to include the third compartment, which represents surface receptor binding and/or cellular uptake at a molecular level. The rate constant at which the dye accumulates in the bound compartment is denoted by kc, regardless of the PK model chosen.
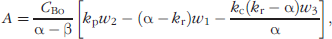
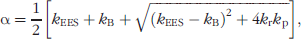
The pre-exponential parameters A and B reflect the magnitude of the detected fluorescence signal, which can provide the differentiation between contralateral normal and tumor tissue regions within an individual animal. For both PK models, the expression of α + β represents the sum of all rate constants between the various compartments:

This can be exploited to evaluate the response at various dose amounts in tumor ROIs among all animals. Assuming that all rate constants are unchanged except kc, variation of net uptake at different doses in different animals can be attributed to receptor binding. Previous work from our laboratory shows that there is no significant difference in the PK parameters of α + β of free, nontargeting Cy5.5 dye associated with KS1767 and contralateral normal tissues [21]. The derivation of the PK model depicted in Figure 1B is detailed in Ref. [21]. The derivation of the PK model depicted in Figure 1A is similar and readily developed.
Results
In Vivo NIR Fluorescence Imaging
Figure 2A presents an example of white light and fluorescence images of a xenograft bearing a subcutaneous human Kaposi's sarcoma on the left anterior limb 24 hr after the injection of 3 nmol dose of Cy5.5-c(KRGDf) conjugate. During all acquisition times for all animals, the tumor was detected from the fluorescence images, up to 48 hr after agent administration. Cy5.5-c(KRGDf) was also excreted to the bladder as evident from the fluorescent images. In order to demonstrate the binding specificity of the Cy5.5-c(KRGDf), fluorescence imaging was performed 24 hr after injection of 3 nmol dose of Cy5.5-c(KRGDf) conjugate but 25 hr after the injection of 600 nmol of c(KRGDf) peptide as a competitive agent. The examples of white light and fluorescent images of the blocked receptor xenografts are illustrated in Figure 2B. The fluorescence images with the same exposure time are illustrated on the same linear color scale to allow for a qualitative comparison. For all animals (n = 3), the fluorescence intensity originating from the tumor ROIs was larger when Cy5.5-c(KRGDf) conjugate was administered alone as compared to when c(KRGDf) was administered one hour prior to imaging agent administration. The reduced uptake of Cy5.5-c(KRGDf) resulting from preadministration of c(KRGDf) validates the in vivo molecular specificity of the conjugate to αvβ3 receptors [21].

White light images (left) and fluorescence images (right) 24 hours after the administration of (A) 3 nmol of RGD-Cy5.5 conjugate alone, (B) RGD-Cy5.5 conjugate 1 hour after the injection of 600 nmol of RGD peptide. The white arrows on the fluorescence images indicate the location of the xenografted Kaposi's sarcoma tumor.
Dynamic Optical Imaging
Figure 3 displays the fluorescence intensity (in arbitrary units) in (a) selected tumor and (b) corresponding normal tissue ROIs as a function of time after administration for one of three animals injected with 0.75, 1.5, and 3 nmol doses of Cy5.5-c(KRGDf) and one of three animals injected with 3 nmol dose of conjugate one hour after administration of 600 nmol of c(KRGDf). It also shows the results of the regression and the corresponding least-squares fit. The coefficient of determination R2 for the regression was .99 or greater in all cases. As shown in Figure 3, the fluorescence intensities in tumor ROIs are higher than those in their corresponding normal ROIs. The figure also shows fluorescence intensities with the conjugate administered at 0.75 nmol are the highest, because of the longer camera integration time of 3000 msec in comparison to the 300-msec integration times employed for the other dosages. When compared to intensities from 1.5 nmol dose of the conjugate alone, fluorescence intensities resulting from 3 nmol dose of the conjugate one hour after injection of 600 nmol of c(KRGDf) are higher with the same 300 msec integration time.

Fluorescence intensity versus time profiles from the animal that received an injection of the RDG-Cy5.5 conjugate at 0.75 nmol (integration time: 3000 msec), 3 nmol (300 msec), 3 nmol 1 hour after the injection of 600 nmol of c(KRGDf) (300 msec), and 1.5 nmol (300 msec) from above, acquired from the (A) tumor and (B) normal ROIs.
A ratio of the target (tumor ROI) to background (contralateral normal tissue ROI) fluorescence intensity normalizes against differing CCD integration time, because both tumor and normal tissue are collected in the same animal using the same image acquisition parameters. However, TBR may fail to account for differences in the fractional contribution of excitation light leakage [25], nonuniformity of excitation illumination, as well as the background autofluorescence which results from the red excitation wavelength. Figure 4 shows the average and standard deviation of the TBR for four groups of animals in the injection of Cy5.5-c(KRGDf) at doses of 0.75 (n = 3), 1.5 (n = 3), 3 nmol (n = 3) and 3 nmol one hour after injecting 600 nmol of c(KRGDf) (n = 3) as a function of time after administration. The results show that the mice administered 0.75 nmol of the conjugate have the highest TBR, whereas the mice administered 1.5 nmol have the lowest TBR. Furthermore, the TBR of mice injected with 600 nmol of c(KRGDf) prior to the injection of 3 nmol of Cy5.5-c(KRGDf) is higher than one of the mice injected with 1.5 nmol of the conjugate. At conjugate doses lower than 0.75 nmol, we found that background signal owing to excitation light leakage through filters and autofluorescence deteriorated the quality of imaging. With improved excitation light rejection and use of an NIR fluorescent dye, these practical limitations could be overcome enabling lower agent dose and greater penetration of excitation and emission light.
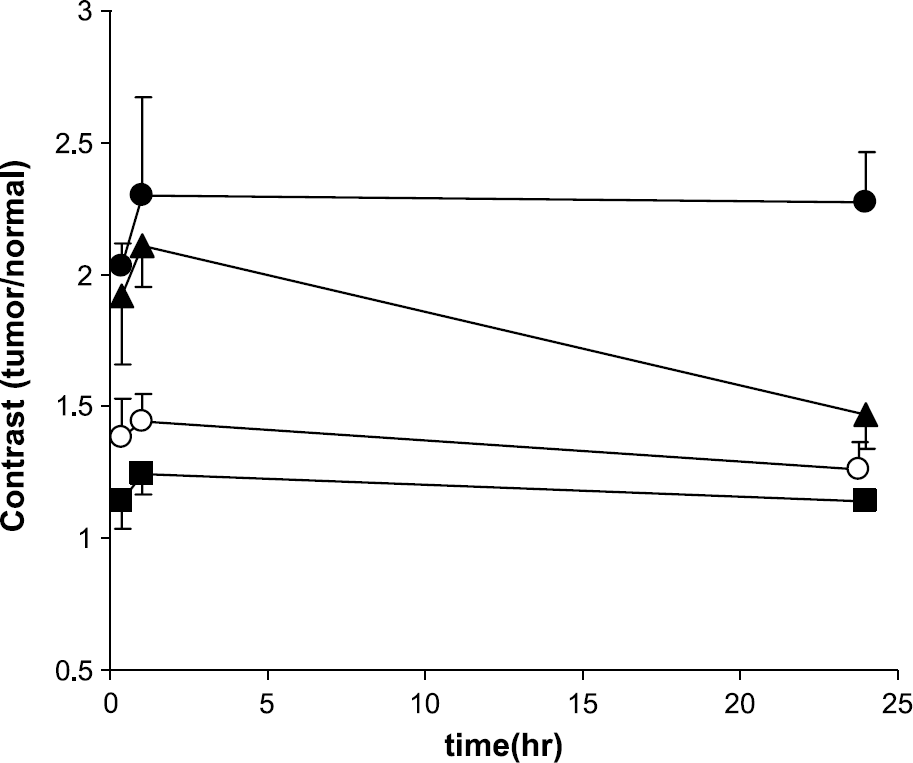
The ratio of the tumor to normal ROIs' intensities. The closed circles (○), triangles (▴), and squares (▪) denote data from an animal receiving 0.75, 3, and 1.5 nmol of RGD-Cy5.5, respectively. The open circles (○) denote the mouse injected with 3 nmol of Cy5.5-c(KRGDf) conjugate after the injection of 600 nmol of c(KRGDf). The points represent the mean value of the test group and the error bars the standard deviation.
PK Analysis
Figure 5 shows that the PK values of A and B in tumor region are higher than those in normal tissue region in each animal. The values of A and B are not only dependent upon the concentration of injected fluorophore but also vary with experimental conditions such as detector sensitivity, incident excitation fluence, and light leakage through optical filters. Therefore, A and B are not solely representative of the molecular specificity of conjugate uptake among all test groups in tumor ROIs but instead may reflect filter light leakage, integration time, autofluorescence, camera and intensifier gain, and so forth. However, because the exponential factors α and β are dictated only by the shape of the fluorescence intensity versus time profiles rather than the magnitude of detected signal, they may be directly comparable between different experimental trials utilizing the same contrast agents regardless of the exposure time, differences in incident excitation fluence, as well as excitation light leakage through optical filters. Figure 6 shows that for all test groups the sum of α and β in normal ROIs from images resulting from different dosages of conjugate are not statistically different (p = .86), whereas those in tumor ROIs are different (p < .0001) and apparently dependent upon the administered dose of imaging agent. The PK value of α + β in the tumor region with the conjugate alone is the lowest at the dose of 0.75 nmol, and the highest at 1.5 nmol. The figure shows a linear relationship between the dose amount and α + β for tumor ROIs for doses up to 1.5 nmol of Cy5.5-c(KRGDf). The PK value of α + β in tumor ROIs of mice injected with a dose of 0.75 nmol is significantly different (p < .02) compared with the corresponding values for mice injected with doses ranging from 1.25 to 6 nmol. Also, the value of α + β in tumor ROIs of mice injected at 1 nmol dose is statistically different (p < .05) from those values arising from doses ranging from 1.5 to 6 nmol. However, there is no significant difference in the values of α + β associated with tumor ROIs when Cy5.5-c(KRGDf) dose is varied from 1.5 to 6 nmol (p = 0.25). The PK parameters of α + β in the normal and tumor ROIs are not statistically different when free c(KRGDf) is preadministered at doses of 300 or 600 nmol an hour prior to administration of Cy5.5-c(RGDf) [21]. There is also no difference observed for α + β values in either normal or tumor ROIs between of blocking groups receiving c(KRGDf) prior to administration of 3 nmol of the conjugate and the dose group of animals receiving 0.75 nmol of the conjugate alone.
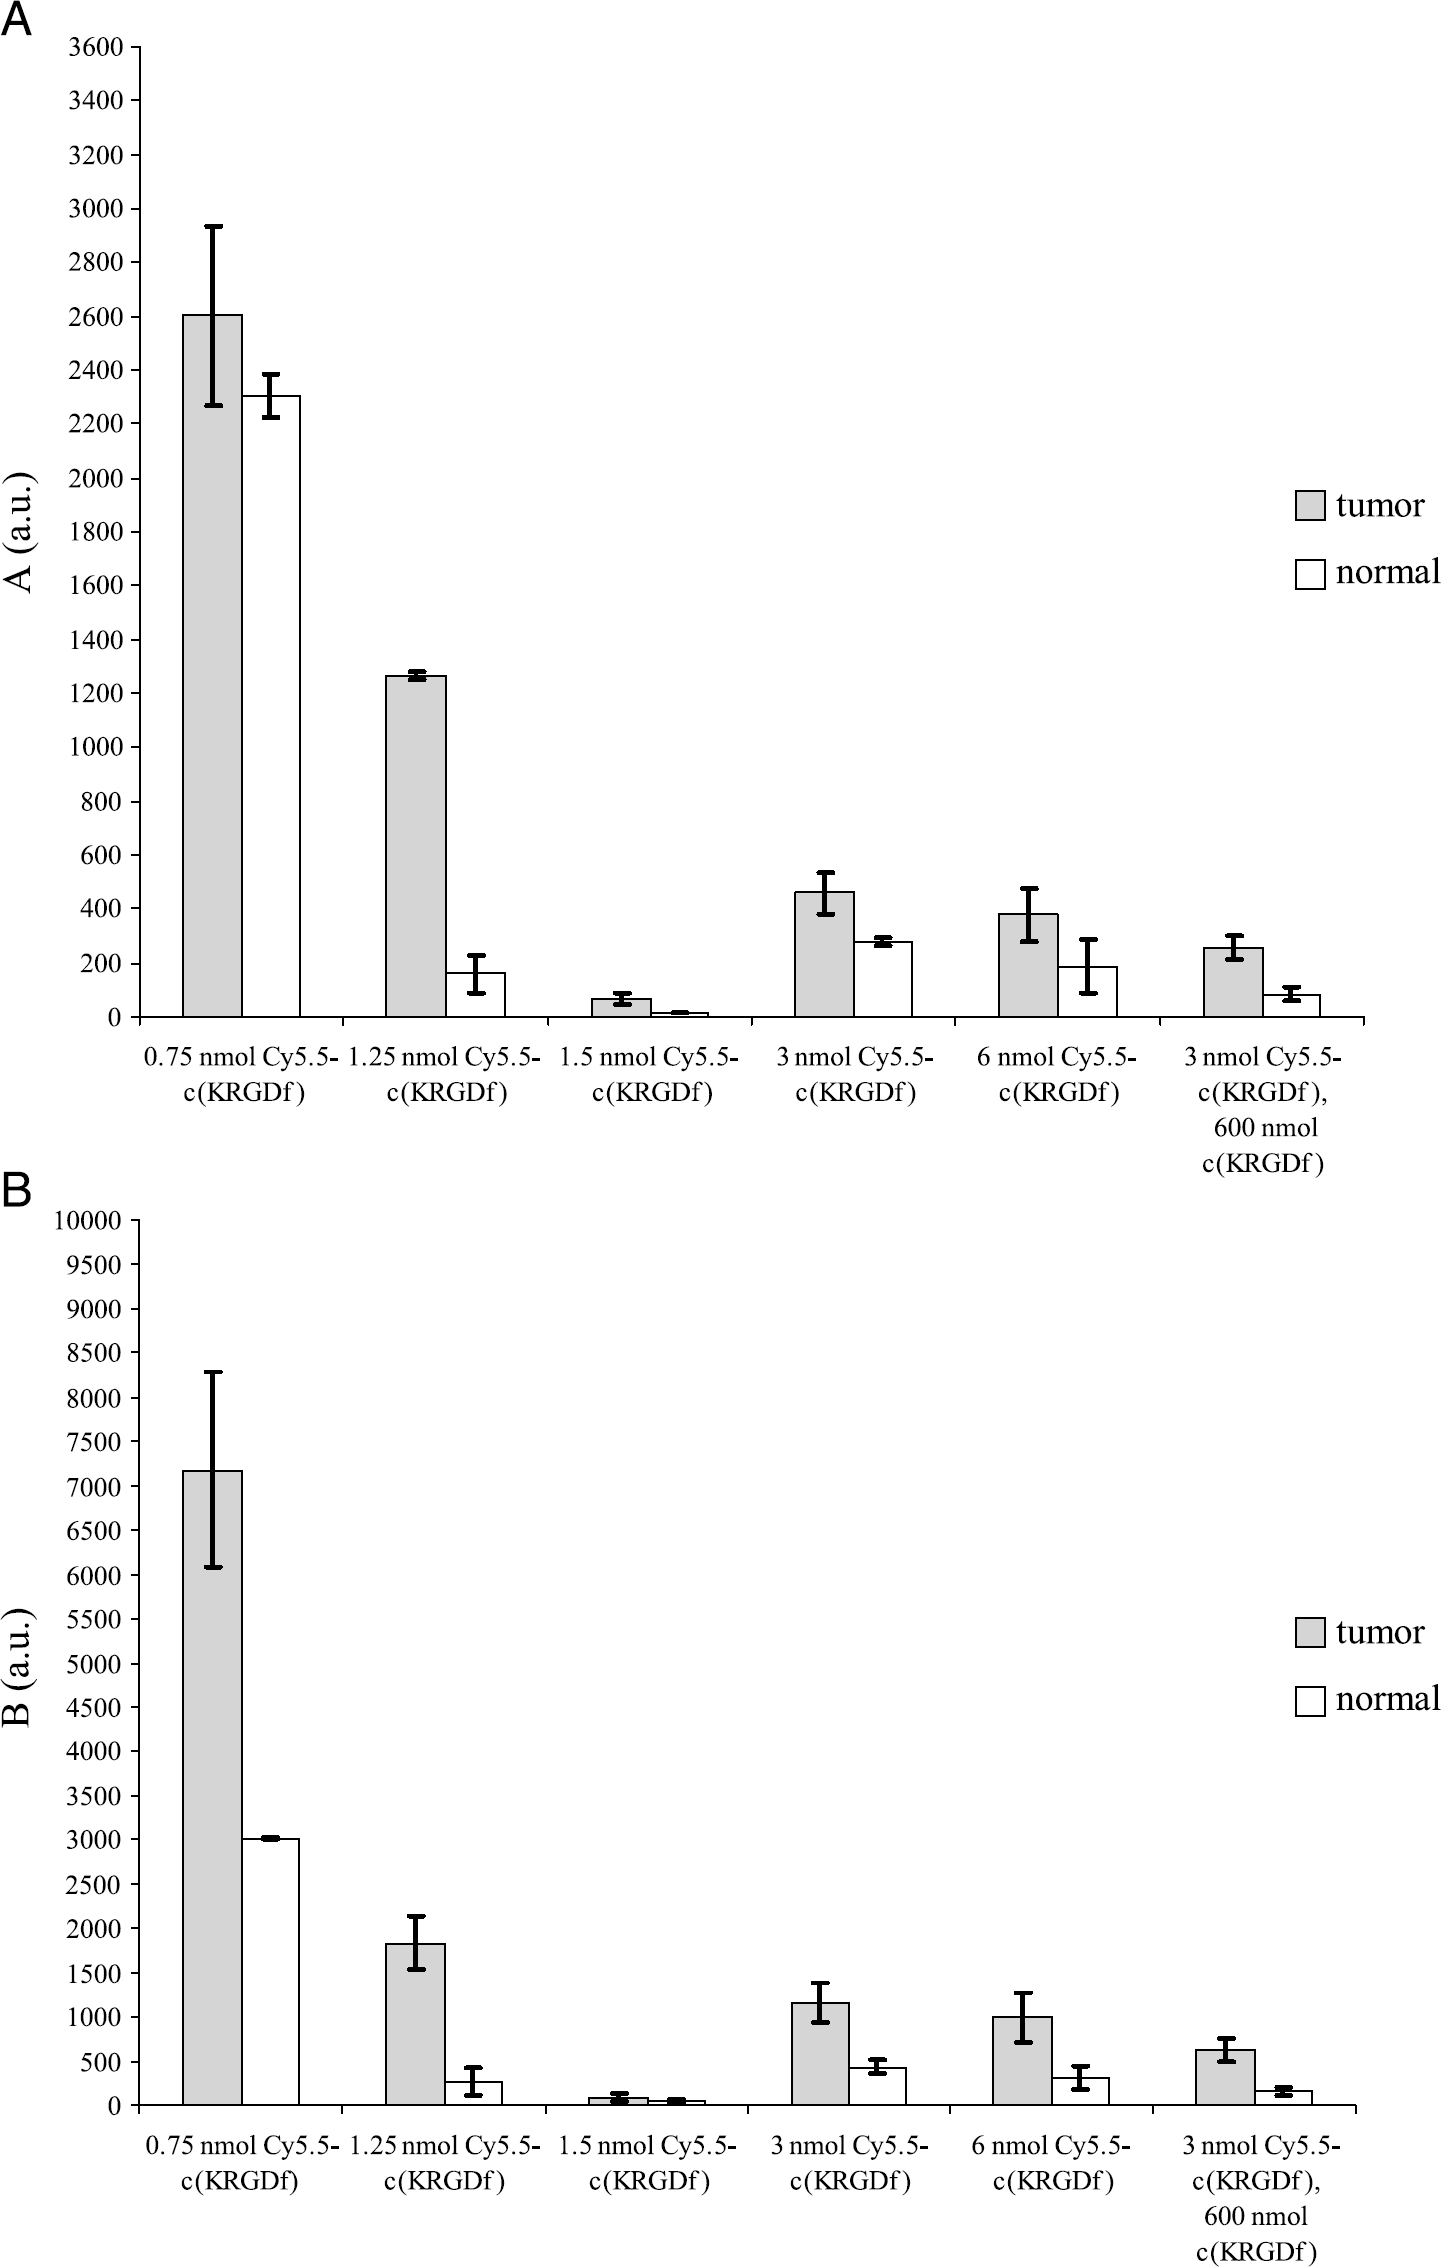
Results of the pharmacokinetic pre-exponential factors (A)

The sum of the pharmacokinetic constants α and β in the tumor and normal ROIs. The column height represents the mean value of the test group and the error bars represent the standard deviation.
Discussion
In this study, we have demonstrated the advantages of dynamic imaging for dose-dependent uptake and compared the resulting pharmacokinetic values with the conventional measurement of TBR. As shown in Figure 3, the acquired fluorescent intensities within selected ROIs are dependent not only on agent dose, but also on the camera integration times, which are varied in order to collect comparable signal to noise at the varying doses. For example, the fluorescence intensities in tumor and tissue ROIs at 0.75 nmol Cy5.5-c(KRGDf) dose integrated over 3000 msec are larger in comparison to those from 3 nmol dose integrated over 300 msec (Figure 3). Although the ratio of fluorescent counts of tumor to normal tissue ROIs, or the TBR, may normalize out the variation of integration times, systematic biases owing to excitation light leakage [25], autofluorescence, and variation in excitation light illumination with animal position or viewing angle [20,21] nonetheless alter TBR. Contribution of systematic biases to TBR becomes more pronounced with increased integration time. For example, Figure 4 shows the highest TBR for the lowest dose (0.75 nmol) but the highest integration time (3000 msec). Chen et al. [20] also used TBR to show the specificity of Cy5.5-conjugated RGD peptide in subcutaneous U87MG glioblastoma tumor model as a function of dose, but also noted changes in TBR that were unrelated to dose. Using a nonintensified CCD, their integration times were 120 sec for doses of 0.1, 1.5, and 3 nmol as opposed to our integration times of 300 msec at the dose of 1.5, 3, and 6 nmol and 1–3 sec at 0.75, 1, and 1.25 nmol. A detector with increased sensitivity enables image acquisition over shorter integration times with reduced contribution of systematic bias in TBR. For the red excitable dye such as Cy5.5, the endogenous autofluorescence may contribute to a higher systematic noise level that when utilizing a NIR fluorophore as we have previously employed [23]. In addition, the use of combined holographic and interference filter sets along with a narrow band illumination source, as used herein, reduces the out-of-band signal and the systematic noise level. Regardless, owing to the artifacts which impact it, TBR may not be a valid optical imaging metric for elucidating the dose-dependent uptake in normal versus diseased tissues.
Although we were unable to obtain a consistent dose response from fluorescent intensity and TBR for the reasons written above and elsewhere [25], Figure 6 shows that the PK parameter estimate, α + β (which contains only the compartment rate parameters as shown in Equation 14), produced a consistent dose response. Figure 6 shows that α + β in the tumor ROI varied linearly with dose from 0.75 to 1.5 nmol, with statistical difference between these amounts indicating unsaturated receptor binding mechanisms, assuming of course unchanged binding constants across the trials studied. Figure 6 also shows that the value α + β at the dose of 0.75 nmol of Cy5.5-c(KRGDf) alone is similar but somewhat higher than that of the 3 nmol dose one hour after the injection of 300 or 600 nmol of c(KRGDf). The ultra low dose may result in accumulation and selective compartmentalization to the kidney, spleen, and bladder rather than to tumor region [16]. However, the values of α + β remained statistically similar for the 1.5- to 6-nmol doses (p = .25) in the tumor ROI and for all doses in the normal tissue ROIs (p = .86), which is indicative of a dose-independent response.
This dose-independent response is consistent with literature reports and may be due to saturated or unavailable receptors for molecular targeting or due to partial self-inhibition at high doses. Chen et al. [20] suggested partial self-inhibition of αvβ3 integrin specific uptake in U87MG at a 3-nmol dose of Cy5.5-c(RGDf) similar to what they reported for targeting gastrin-releasing peptide receptor using MicroPET techniques [28]. Van Hagen et al. [29] investigated the tissue distribution of the targeted radiotracer, 111In-DTPA-RGD at doses of 0.1 or 0.5 μg administered with and without 100 μg of the unlabeled RGD peptide as a competitive ligand. They showed that the uptake in CA20948 pancreatic tumor was the highest for 0.1 μg 111In-DTPA-RGD. Zitzmann et al. [16] showed that RGD-4C-FITC peptide can bind to both endothelial cells and tumor cells in human breast cancer xenografts in nude mouse. Using in vitro confocal microscopy, Castel et al. [30] showed that cRGD peptide targeted to αvβ3 was internalized by integrin-independent, fluid-phase endocytosis pathways in both integrin expressing and nonexpressing melanoma cells. They showed that the number of functional integrin receptors at the cell surface remains constant after one hour following incubation with cRGD peptide, while it decreased after incubation with monoclonal antibody (mAb 17E6). Furthermore, they demonstrated that high concentrations of RGD peptide may be required to induce apoptosis. Kok et al. [31] showed that the in vitro specific binding of radiolabeled RGD-protein conjugates to the αvβ3 integrin in H5V endothelial cells seemed to exhibit saturation, but the binding plateau was not reached even at the highest concentrations. However, although these in vitro cell culture studies may reflect the binding of integrins on the cancer cells or proliferating endothelium, they do not reflect the combined binding in both vascular and extravascular compartments which occurs in vivo.
To relate our in vivo dynamic imaging to integrin binding, we developed two distinct models for binding in the vascular compartment associated with proliferating endothelium (Figure 1A) as well as the extracellular compartment associated with cancer cells (Figure 1B). Conveniently, the solutions for the time-dependent fluorescent intensity from both models are similar and the expressions for α + β are exactly the same. Even though it is difficult to relate each PK rate constant to physiologically relevant values, the grouped value of α + β α + β allows us to compare the dose dependence among all animals. Assuming that the in vivo binding constants and clearance rates remain unchanged across the groups studied, one can attribute the increase in the value of α + β with increasing dose to unsaturated binding of Cy5.5-c(KRGDf) to the integrin receptor. Furthermore, if one assumes unchanged in vivo binding constants and clearance rates following administration of free c(KRGDf), then one can attribute the diminution of the value of α + β to changes in integrin receptor availability. In contrast to the grouped PK value of α + β, the pre-exponential factors A and B indicate the magnitude of fluorescence intensities. Each value is higher in the tumor region than in the normal region in each individual animal (Figure 5).
The ability to estimate receptor densities from in vivo kinetic uptake analysis of radiopharmaceuticals has been reported. For example, Vera et al. [32] measured the receptor concentration, as well as forward and reverse binding rate constants of 99m-galactosyl-neoglycoalbumin with biodistribution data. With dynamic optical imaging, it may be possible to likewise measure the receptor density, given the forward and reverse binding constants. Previously, Gurfinkel et al. [21] used the PK model of Figure 1B to analyze uptake of free Cy5.5, Cy5.5-c(KRGDf) conjugate administered alone as well as with free c(KRGDf) administered as a competitive ligand 1-hour and 24 hours before the injection of Cy5.5-c(KRGDf). They inferred the net uptake rate constant owing to integrin binding from differences in Cy5.5-c(KRGDf) uptake with and without c(KRGDf) preadministered as a blocking agent. Assuming that the binding constants remain unchanged, the change of Cy5.5-c(RGDf) uptake was assumed to arise from changes in available receptor densities. Unfortunately, these studies did not evaluate the dose response of uptake due to in vivo binding. Using a dual-labeled optical and nuclear tracer, we [24] have also embarked on the evaluation of in vivo biodistribution data which should provide information for quantifying receptor density.
Optical tomography for quantitative 3-D imaging of NIR agents in small animals may overcome not only a requirement for dual-labeled probe by providing biodistribution data directly, but also enable molecular imaging of orthotopic tumors. Although phantom studies have demonstrated the possibility of optical tomography into deep tissues [33], to date, small-animal tomography remains under development in several laboratories including our own [34] and must be properly validated before being employed for kinetic analysis for determination of receptor densities.
Footnotes
Acknowledgments
The work was supported under NIH R01EB000174 (CL) and NIH R01 EB0003132 (ESM).