
Abstract
The ability to visualize the cellular inflammatory responses after experimental spinal cord injury (SCI) was investigated using a clinical 1.5-T magnetic resonance imaging scanner, a custom-built, high-strength gradient coil insert, a 3-D fast imaging employing steady-state acquisition (FIESTA) imaging sequence and a superparamagnetic iron oxide (SPIO) contrast agent. An “active labeling” approach was used, with SPIO administered intravenously at different time points following SCI. Our results show that this strategy can be used to visualize clusters of iron-labeled cells associated with the inflammatory response in SCI. Of particular importance for this application was the finding that in FIESTA images hemorrhage does not cause signal loss. In T2-weighted spin echo or T2*-weighted gradient-echo images, which are more commonly used to detect signal loss associated with SPIO, the signal loss associated with hemorrhage interferes with the detection of iron-induced signal loss. FIESTA, therefore, allowed us to discriminate between iron associated with blood products in hemorrhage that occurs in acute SCI and the iron associated with SPIO-labeled cells accumulating in the injured cord.
Introduction
Traumatic spinal cord injury (SCI) results in an immediate physical injury and is often followed by additional tissue damage that may develop over a period of days or months after the initial injury. This progressive degeneration has been termed secondary or “bystander” injury [1]. Leukocyte infiltration is consistently observed in human [2] and experimental SCI [3,4]. Treatments that block the accumulation of inflammatory cells and/or suppress their function attenuate the inflammatory response and reduce the extent of secondary injury resulting in improved neurological recovery [5–9]. Thus, cellular inflammatory responses have been implicated as one mechanism promoting secondary degeneration [10]. Immediately after the primary injury the inflammatory response is initiated largely by microglia and astrocytes through the release of lymphokines and chemokines, and migration of activated microglia is initiated to the injury site. This results in furthering an inflammatory response consisting of a spatially regulated and time-dependent influx of hematogenous leukocytes (neutrophils, macrophages/monocytes, T cells) along with a concomitant release of additional proinflammatory mediators (chemokines, cytokines, complement) within the lesion site. The combined response of central nervous system-derived cells and leukocytes participating in the inflammatory response is the host's attempt to repair the damaged tissue and restore homeostasis to the area of injury. However, in doing so, these cells and their proinflammatory mediators are believed to also contribute to neurodestructive processes after SCI.
Although it is clear that the early infiltration of neutrophils contribute to secondary injury, the role of the macrophage is far less clear. It is difficult to separate the potential beneficial effects of macrophages in removing cellular debris and repair from the potential destructive effects associated with their phagocytic activity and the associated free radical production. Some evidence suggests that the degree of macrophage infiltration in SCI is very closely related to the likelihood of this bystander damage [5]. On the other hand, treatment with immunosuppressive agents that suppress or eliminate macrophage function has been shown to be protective when administered soon after SCI [6]. Clearly, there are important and unresolved questions related to how the degree and temporal nature of macrophage involvement and the role of distinct populations of macrophages and their spatial distribution contribute to lesion development and regeneration in SCI.
High-resolution magnetic resonance imaging, also known as magnetic resonance microscopy (MRM), can provide detailed anatomic information in a noninvasive manner and is currently being used to characterize small animal phenotypes and pathology. Combined with sensitive superparamagnetic iron oxide (SPIO) contrast agents, which can be used to selectively target cells, MRM is currently being used to study a variety of cellular events in medical research [11–19]. MRM has also been used to detect individual SPIO-labeled cells [20–22].
The intravenous administration of SPIO agents before imaging to target circulating phagocytic monocytes and macrophages has been termed “active labeling” of cells. The accumulation of iron oxide-labeled cells appears as abnormal signal hypointensities in T2- or T2*-weighted images. The large magnetic susceptibility of these particles affects an area much larger than the actual size of the particles; an effect that has been called a “blooming artifact.”
In this study we use cellular microimaging techniques developed in our laboratory and in vivo active labeling of cells with SPIO to assess the pathological alterations and the cellular responses following SCI. Our results show that this strategy can be used to visualize clusters of iron-labeled cells associated with the inflammatory response in SCI. This is a first step in being able to do high-resolution in vivo imaging that will lead to the development of an in vivo means of following an inflammatory response and the effectiveness of anti-inflammatory treatments.
Materials and Methods
Animal Model
All protocols used in this study were approved by the University of Western Ontario Animal Care Committee and were conducted in accordance with the policies contained in the Canadian Council on Animal Care Guide to Care and Use of Experimental Animals.
Spinal cord injury was induced using the clip compression model of Rivlin and Tator [23]. Animals were premedicated with atropine (0.05 mg/kg sc, MTC Pharmaceuticals, Cambridge, Ontario, Canada) and placed on a heating pad to maintain body temperature at 37°C. Injury was induced in 43 female Wistar rats (Charles River Laboratories, St. Constant, Quebec, Canada) weighing 200–250 g. Animals were anesthetized with 4% isoflurane in an induction chamber and maintained at surgical-depth anesthesia with 2.5-3% isoflurane via a nose cone. A laminectomy was performed on the third thoracic vertebrae (T3) to expose the T4 segment of the spinal cord. A modified aneurysm clip, calibrated to deliver a compression force of 50 g, was applied to the T4 spinal cord segment for 60 sec, causing severe injury and immediate hind limb paralysis. After the clip was removed, the muscles and skin were closed. Animals were recovered under a heat lamp. Postoperative care consisted of hydration with 0.9% saline (5 mL sc), manual voiding of bladders twice daily, injection of antibiotic twice daily for 3 days (Baytril, 0.05 mL im), and injection of analgesic twice daily for 2 days (buprenorphine, 0.03 mg/kg sc).
Nine groups of animals were investigated. Groups 1 and 2 were control groups. Group 1 (n = 3) consisted of animals that had only a laminectomy performed and Group 2 (n = 4) consisted of intact, uninjured rats. Three groups of animals were examined at different time points after SCI to understand the MR appearance of the cord pathology. These groups were as follows: Group 3 (n = 6), examined at Day 1 post SCI; Group 4 (n = 6), examined at Day 4 post SCI; and Group 5 (n = 4), examined at 6 weeks post SCI. Four groups of animals were administered SPIO before imaging. Group 6 (n = 6) was examined at Day 1 post SCI and Group 7 (n = 6) was examined at Day 4 post SCI. In these animals, Feridex (22.4 mg Fe/kg; total volume of 1 ml diluted with 0.9% heparinized saline) was injected intravenously into the tail vein using a 24GA catheter. Rats in Group 6 received Feridex 4-6 hr after the SCI and rats in Group 7 received Feridex 3 days post SCI. Group 8 (n = 5) was a control group consisting of uninjured rats administered Feridex. Group 9 (n = 3) was a control group consisting of laminectomy rats administered Feridex. Euthanasia was performed with an overdose of sodium pentobarbital (Euthanyl) and animals were transcardially perfusion fixed with cold 3.75% neutral buffered formalin (Sigma-Aldrich, Oakville, Ontario, Canada). After fixation, the cords were excised and stored in 10% formalin until imaging.
Imaging
Excised cords were trimmed and placed in modified NMR tubes containing Fluorinert FC-72 (perfluoroalkene, 3M, London, Ontario, Canada). Fluorinert is used as an imaging medium because it limits susceptibility effects at the surface of the specimen while remaining MR-invisible. Imaging was performed on a 1.5-T GE CV/i MR using a custom-built gradient coil (inner diameter 12 cm, peak slew rate 2000 mT/m/sec and maximum gradient strength 600 mT/m) and a customized solenoid radio-frequency coil (1 cm diameter, 3 cm length). Specimens were imaged using a 3-D fully refocused (steady-state free precession) gradient-echo (3DFIESTA, GE Medical Systems, Milwaukee, WI) sequence. The 3DFIESTA imaging sequence was optimized previously for cellular imaging using iron-labeled THP-1 cells in a gelatin matrix [21]. The parameter set used for spinal cord imaging with the FIESTA sequence was as follows: TR/TE = 7.6/3.8 msec, flip angle = 30°, a 21-kHz bandwidth, 400 × 400 matrix, 4 cm FOV, and 1 or 4 nex; scan time was 5.6 or 22.5 min. FIESTA images were obtained with 100-μm isotropic spatial resolution or 100 × 100 × 200 μm spatial resolution. 3DFIESTA images were compared with 2-D T2-weighted fast spin echo (2DFSE) and 3-D T1-weighted spoiled gradient-echo (3DSPGR) images. SPGR images were acquired with TR/TE = 9.8/4.3 msec, 400 × 400 matrix, 4 cm FOV, and 4 nex. The signal-to-noise ratio (SNR) and spatial resolution were matched to FIESTA images obtained with 1 nex (SNR = 27) and the scan time was 29 min. Sagittal T2-weighted FSE images were acquired with TR = 3000, ETL = 8, effective TE = 80 msec, a spatial resolution of 100 × 100 × 200 μm, and a 27-min scan time.
Cord SNR was measured as the mean signal intensity (SI) in a region of interest (ROI) drawn in cord white matter (WM) divided by the standard deviation of the signal from noise in background air. Two measures of contrast-to-noise ratio (CNR) were made. CNR was calculated as the signal difference between a reference tissue (cord GM) and the signal from a ROI drawn in (1) WM and (2) regions of signal void (RSV), divided by the standard deviation of noise in background air.
Histology
After imaging, the specimens were prepared for histopathological analysis. Specimens were embedded in paraffin and 8-μm sections were cut from the block. Contiguous sections were stained with (1) hematoxylin and eosin (H&E) to assess cellular infiltrate and general tissue structure, (2) Perls Prussian blue (PPB) counterstained with Nuclear Fast Red to demonstrate iron oxide, and (3) immunolabeled with mouse anti-rat ED1 (also known as anti-CD68) to demonstrate the presence of CD68-expressing cells. The ED1 antibody reacts with an intracellular antigen in activated microglia and macrophages. ED1 (1:1000) was applied to sections for 48 hr in a humidified chamber at 4°C, after blocking with 5% normal goat serum (NGS), and 0.3% H2O2 in PBS-Triton X-100. Biotinylated goat anti-mouse (H + L) IgG secondary antibody was applied (1:1000) overnight at 4°C. Extravidin-peroxidase (1:500, 3 hr) and DAB were used to visualize the staining. Sections were counterstained with hematoxylin. Histopathological and MRM images were compared by locating corresponding landmarks.
Results
Anatomical MRM
Pathologic features of the SCI could be observed in FIESTA images. Blinded observers could easily and accurately distinguish between intact and injured cords. Figure 1 shows sagittal FIESTA images of a laminectomy control rat spinal cord (Figure 1A) and the injured cords from Groups 3–5 (Figure 1B–D). An area of diffuse high signal intensity, which was associated with edema and hemorrhagic necrosis, was consistently observed at the epicenter of the injury in all animals from Groups 3 and 4 (Figure 1B and C). Observers could not easily differentiate between images of these acute cord injuries (Days 1 and 4 post SCI). Images of cords from Group 5 animals, examined 6 weeks post SCI, showed a large, localized area of increased signal at the injury site, which was associated with the formation of large fluid filled cystic cavities (Figure 1D). Observers could easily distinguish between appearance of the acute (Figure 1B and C) and chronic (Figure 1D) SCI lesion. Abnormal regions of low signal intensity were never identified in FIESTA images of cords from Groups 1 through 5.
Certain pathologic features of SCI were more readily visualized in axial FIESTA cord images. In Figure 2, representative axial FIESTA images of injured cords from Groups 3–5 are shown. MR and histology images of an injured cord at Day 1 post SCI are shown in Figure 2A and B. Increased signal intensity in the cord WM corresponds to edema and foci of hemorrhage apparent in the analogous H&E-stained histology section (arrows). MR and histology images of an injured cord at Day 4 post-SCI are shown in Figure 2C and D. This image slice is located 3 mm caudal to the epicenter of the cord injury and illustrates pathology in the dorsal part of the cord WM (arrow). This area has increased WM signal intensity in the MR images, appearing isointense to cord GM, and corresponds to a cavitation in the dorsal funiculus in the corresponding histology section (arrow). The cord image in Figure 2E is of an injured cord 6 weeks post SCI and illustrates the large cystic cavities that form after SCI as a result of secondary damage. In Figure 2F, an image of an intact uninjured spinal cord, at the level of T3, is shown to illustrate the normal appearance of the spinal cord in cross section in FIESTA images.

Sagittal FIESTA images of the T4 region of rat spinal cords. (A) Laminectomy with no clip injury. Areas of high and diffuse signal intensity were seen in images acquired at (B) 1 day and (C) 4 days post SCI, demonstrating edema and hemorrhage near the epicenter of injury. At 6 weeks post SCI (D), fluid-filled cystic cavities can be seen.

Axial FIESTA images demonstrate the progressive pathological changes in the cord following injury. MR and histology images of the epicenter of injury at 1 day post SCI are shown in (A) and (B). At this time, the characteristic butterfly shape of the gray matter is severely compressed and areas of increased signal intensity can be seen in gray and white matter regions. At 4 days post SCI, images of injured cords 3 mm from the epicenter show an area of increased signal intensity in the dorsal funiculus (arrow, C) and cavitation in the corresponding histology section (D). At 6 weeks post SCI, a large cystlike cavity with high signal intensity can be seen (E). An intact uninjured spinal cord is also shown for comparison (F).
Figure 3 is a comparison of the different imaging sequences used to visualize SCI pathology. Two time points are presented when the tissue pathology is especially different: Day 1 post SCI (acute) and 6 weeks post-SCI (chronic). At Day 1, hemorrhage and edema are prominent pathologic features. By 6 weeks, the lesion is much more extensive in this cord and large, fluid-filled cavities have developed at the lesion epicenter. Hemorrhage appears as a region of high SI in FIESTA and T1-weighted SPGR images and as a region of low SI in T2-weighted FSE images (Figure 3A–C, arrows). The fluid-filled cavity observed at 6 weeks appears as a region of high SI in FIESTA and T2-weighted FSE images and as a region of low SI in SPGR images (Figure 3D and F). Cord tissue contrast is very similar between FIESTA and T2-weighted FSE images. SPGR contrast does not allow the differentiation of GM and WM.
Cellular Imaging
Regions of signal loss were detected in all injured cords from animals that were administered SPIO. Figure 4 demonstrates the typical appearance of signal loss observed in FIESTA images of cords examined at Day 1 post SCI. The sagittal FIESTA images in Figure 4 are single 100-μm slices from a 3-D isotropic volume (4 nex, 22.5 min scan time, SNR = 52). Figure 4A and B are separated by 900 μm. Small round black dots are easily detected in near the epicenter of the injury (Figure 4A) and in localized regions of the dorsal column of WM, away from the epicenter (Figure 4B). The 3-D, isotropic nature of the image data allows for visualization of the spinal cord after volume rendering. In Figure 4C, a 3-D image of this cord is illustrated with the regions of signal void in red and the region of edema and hemorrhage in pale blue. The arrow indicates the epicenter of the injury.
Figure 5 compares three different types of images (3DFIESTA, 3DSPGR, and 2DFSE) of a representative injured cord examined at Day 1 post SCI. FIESTA images (Figure 5A) were acquired with 100-μm isotropic spatial resolution and 1 nex; SNR was 27 and scan time was 5.6 min. Small discrete regions of signal void were again visible near the lesion epicenter and up to 5 mm away in the caudal direction (arrow). Additional FIESTA image data were acquired with equivalent spatial resolution but higher SNR (SNR = 52), obtained by using four averages (images not shown). In FIESTA images with higher SNR the image quality was enhanced but the number and location of the regions of signal void observed was the same as in the FIESTA image with lower SNR, shown in Figure 5A. A cross-sectional FIESTA image of the cord is shown in Figure 5D. This image slice corresponds to the location indicated by the line on the sagittal image in Figure 5A. Regions of signal void were located primarily in the cord GM and dorsal WM.
SPGR images (Figure 5B) were matched to the FIESTA images; spatial resolution was 100 μm, and SNR was 27. The same small regions of signal void could be detected in the SPGR image. Contrast between regions of signal void and hemorrhage (outlined with white dashed lines) was high in the SPGR images. Tissue GM-WM contrast, however, was very low. In T2-weighted FSE images (Figure 5C) the hemorrhagic area appears with reduced signal intensity in these images and discrete areas of signal void, observed in FIESTA and SPGR images, were very difficult to detect. The larger slice thickness of FSE images also contributes to the inability to distinguish small regions of signal loss.
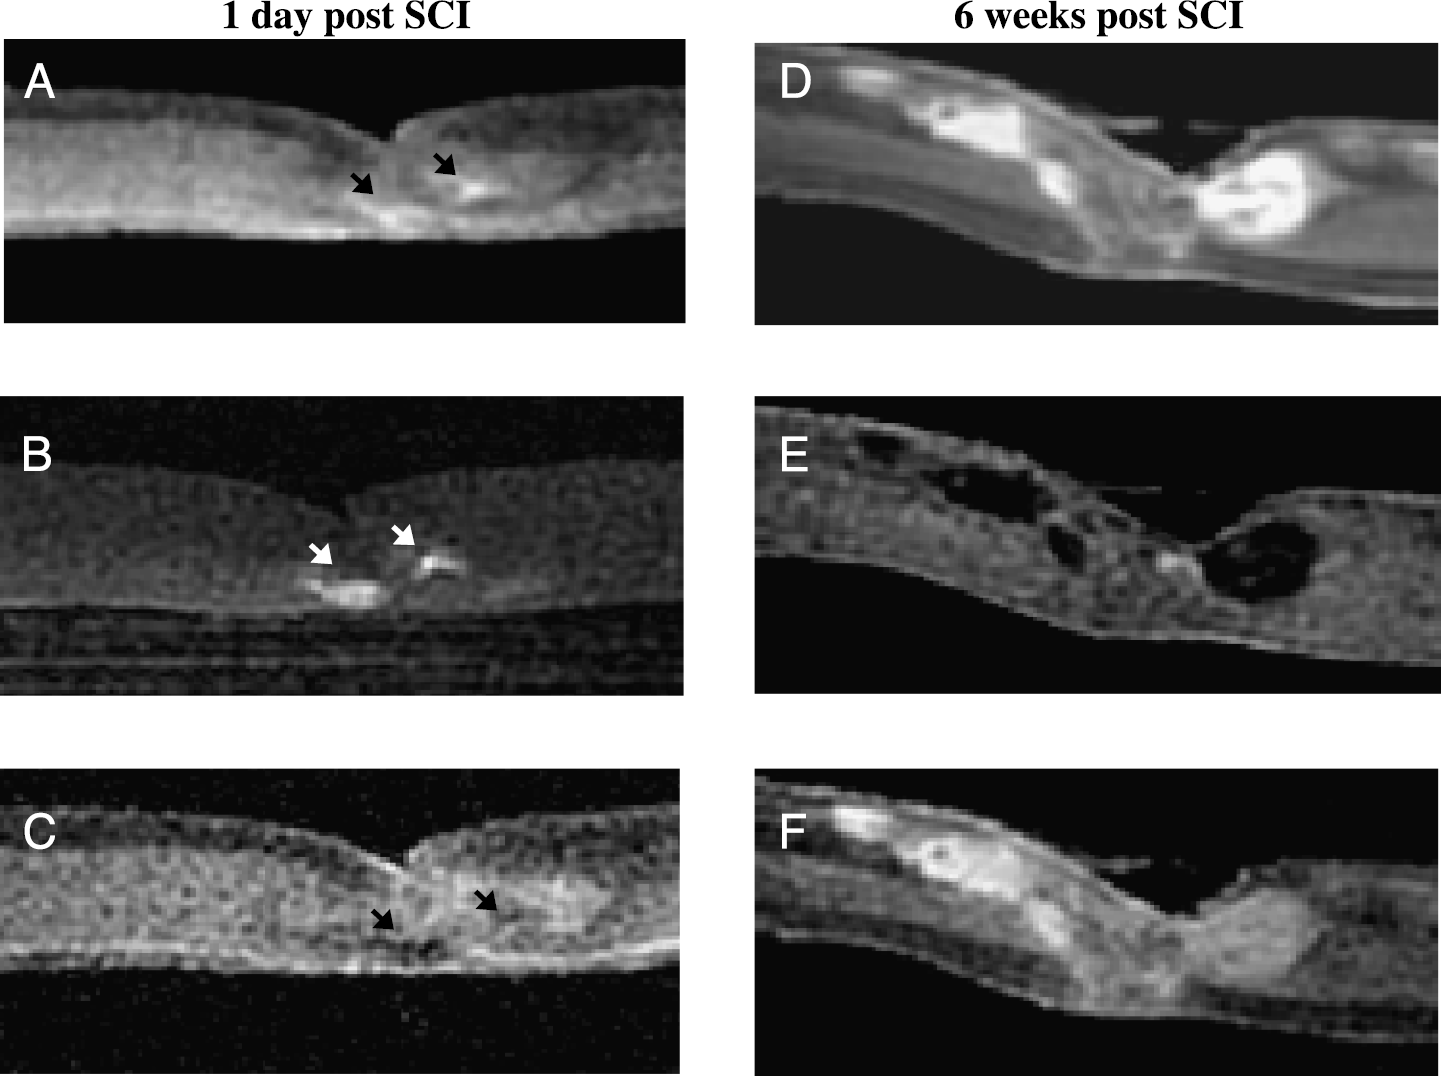
Three imaging sequences are used to compare the pathology of injured cords at 1 day (A-C) and 6 weeks (D and F) post SCI. At Day 1 post SCI, regions of hemorrhage (arrows) appear with increased signal intensity in FIESTA (A) and T1-weighted SPGR (B) images and with reduced signal intensity in T2-weighted FSE images (C). At 6 weeks post SCI, fluid-filled cavities appear with increased signal in FIESTA and T2-weighted FSE images (D and F) and as regions of low signal intensity in T1-weighted SPGR images (E). Spatial resolution of all images is 100 × 100 × 200 μm.

FIESTA images (100 μm isotropic) of a representative injured cord that received intravenous SPIO at 4 hr post SCI and was imaged at Day 1 post SCI. Small regions of signal void can be seen close to the epicenter of injury (A) and in regions of the dorsal column caudal to the epicenter (B). In (C), a 3-D image of this cord is presented with the regions of signal void depicted in red and the region of edema and hemorrhage in pale blue. The arrow indicates the epicenter of the injury. The top of the image is the dorsal side of the cord.
The appearance of the regions of signal loss detected in images of injured cords examined at Day 4 post SCI was notably different from those cords examined at Day 1 post SCI. Figure 6 compares the same three types of images of a representative injured cord examined at Day 4 post SCI. In the FIESTA and SPGR images shown in Figure 6A and B, large regions of signal loss were observed around the epicenter of the cord injury, predominantly in the cord GM and dorsal WM. At the epicenter of the injured cord, a moderate, diffuse area of increased signal intensity was observed in the FIESTA image (arrow). A much higher increase in the signal intensity in this area was observed in SPGR images (arrow). In T2-weighted FSE images (Figure 6C) the injured area at the epicenter, indicated by the arrow, appears as a signal void and is surrounded by a more extensive region of signal loss. Signal loss was never observed in FIESTA images of injured cords from animals that were not administered Feridex. A comparison of the scan times, spatial resolution, SNR, and CNR for the three imaging sequences is given in Table 1.

A comparison of FIESTA (A), T1-weighted SPGR (B), and T2-weighted FSE (C) images of an injured cord administered SPIO at 4 hr post SCI and imaged at Day 1 post SCI. The arrow in (A) indicates a region of signal loss in the WM dorsal column 5 mm rostral to the epicenter. A cross-sectional FIESTA image is shown in (D) and corresponds to the point along the sagittal FIESTA image indicated by the line and illustrates signal loss in the WM dorsal column near the epicenter. The asterisk specifies regions of signal void along the surface of the cord specimen caused by nicks occurring at dissection. The top of the image is the dorsal side of the cord.
Histopathology
Our histological analysis showed that regions of signal loss in the FIESTA images of injured cords corresponded with areas of tissue damage containing leukocytes. ED1+ cells (brown product) were found in the injured spinal cords (Figure 7A–C). The ED1+ cells were primarily located within the epicenter of the injury with much fewer numbers of ED1+ cells located caudal and rostral to the injury. The number of ED1+ cells was much greater in injured cords examined at Day 4 post SCI (Figure 7B), as compared with cords examined at Day 1 (Figure 7A, arrows). Neutrophils, which are ED1-, were much more commonly observed in cords examined at Day 1 (arrowheads on inset, Figure 7A). Images in Figure 7C and D are corresponding ED1 and PPB-stained sections of a region of the epicenter from an injured cord examined at Day 4 post SCI. The arrowheads indicate some of the many cells that are both ED1+ and PPB+. In Figure 7D, the high magnification view reveals the presence of SPIO particles in cells. Cells that were ED1+ but PPB- were also identified.

A comparison of FIESTA (A), T1-weighted SPGR (B), and T2-weighted FSE (C) images of an injured cord administered SPIO at 3 days post SCI and imaged at Day 4 post SCI. The arrows point toward an area of hemorrhage at the lesion epicenter. A cross-sectional FIESTA image (D), which corresponds to the point along the sagittal FIESTA image indicated by the line, clearly shows the localization of signal loss in the cord GM and dorsal WM. The top of the image is the dorsal side of the cord.
A Comparison of Sequence Parameter and Measurements Made in FIESTA, SPGR and FSE Images Shown in Figure 5

Discussion
Iron-labeled cells in the injured spinal cord were detected using new tools and concepts for cellular imaging at 1.5 T. Low-field MRM techniques, developed in our laboratory, including a custom-built, insertable, high-powered imaging gradient set, customized radio-frequency coils, and optimized 3-D imaging pulse sequences were used along with active in vivo labeling of cells with SPIO. This approach was used previously to image single iron-labeled cells in vitro [21] and to image inflammatory cells in ex vivo brain specimens in an experimental model of multiple sclerosis [24]. This article shows, for the first time, that cellular infiltration after SCI can be observed using these strategies for cellular imaging.
The most important finding in the analysis of different pulse sequences for imaging the pathology of SCI was that in FIESTA images hemorrhage does not cause signal loss, as it does in T2-weighted spin echo or T2*-weighted gradient-echo images. The negative enhancement due to hemorrhage is a confounding factor for cellular imaging with T2- and T2*-weighted methods because the contrast induced by the presence of SPIO is also a signal loss. FIESTA images, therefore, allow us to discriminate between iron associated with blood products in hemorrhage and the iron associated with SPIO-labeled cells.

ED1 immunohistochemistry performed on injured cords examined at Day 1 (A) and Day 4 (B) after SCI (magnification ×40). Many ED1 + cells (brown product) are visible throughout the epicenter of the injured cord examined at Day 4 post SCI (B). Fewer ED1 + cells are found at Day 1 post SCI (A, arrows). Neutrophils are more common at this time point (arrowheads on inset to A). (C) is a higher power magnification (100 ×) of the section shown in (B). (C and D) Contiguous sections stained with ED1 and PPB. Arrows point out some examples of cells that are both ED1 + and PPB +, indicating that macrophages have been labeled with iron.
Injured cords examined 1 to 4 days post SCI contain hemorrhage in the early subacute stage. In our FIESTA and SPGR images subacute hemorrhage appears with increased signal intensity because of the accumulation of methemoglobin, which produces a strong T1 shortening and a moderate T2 shortening [25]. The T1-weighted SPGR images are very sensitive to the T1 shortening effects of methemoglobin. Contrast in FIESTA images is related to T2/T1, and a large ratio causes brightening in the FIESTA images. Signal loss is not observed in FIESTA images because the T2 shortening effects are greatly overshadowed by this effect. Disparities in the appearance of hemorrhage are common because two or more compounds are often present concurrently in a hemorrhage and there are variations in the onset of cell lysis and methemoglobin formation.
Cellular imaging experiments showed that both the FIESTA and SPGR sequences were sensitive to the superparamagnetic effects of iron oxide. The FIESTA imaging sequence has certain additional advantageous features over other imaging sequences for cellular imaging with SPIO. The FIESTA sequence provides better SNR, relative to GRE and SE sequences, as a result of the multiple signal refocusing paths available for tissues with T2 much greater than TR. The significant improvement in SNR efficiency allows for the acquisition of images at high spatial resolution with relatively short scan times and allows microimaging at lower field strengths than is typically possible. These two factors were key to our ability to visualize small numbers of iron-labeled cells. Imaging at 1.5 T with FIESTA imparts a further advantage because at higher magnetic field strengths, more typically used for microimaging, off-resonance banding artifacts that result from imperfect shimming are more pronounced. SPGR images have some limitations for cellular imaging. The almost complete lack of tissue contrast limits the use of this imaging sequence if the spatial localization of cells is of interest. Furthermore, in chronic SCI, cystic cavities develop that appear with very low SI, as seen in SPGR images of cords examined 6 weeks post SCI (Figure 3E), which will interfere with the detection of iron-induced regions of signal void in SPGR images similar to that in T2-weighted FSE images. The T1-weighted SPGR sequence was much more sensitive to T1 shortening caused by hemorrhage, however, and so these two sequences might be considered complementary for cellular imaging in SCI.
There were distinct differences in the way the signal loss looked in cords imaged on Day 1 post SCI compared to those imaged on Day 4 post SCI. The larger and more diffuse regions of signal loss observed in images of injured cords examined 4 days after clip compression corresponds to the accumulation of larger numbers of iron-labeled immune cells. Regions of signal loss in the cord images were found to correspond to tissue areas infiltrated by inflammatory cells. Most of the cells were ED1+, indicating the accumulation of monocytes, blood-derived macrophages, or activated microglial-derived macrophages. The number of ED1+ cells was greater in cord tissue examined on Day 4 post SCI as compared to Day 1 post SCI, as shown in Figure 7 and in accordance with previously published results [26].
Several studies have described a spatially regulated and time-dependent distribution of cells in injured cord tissue after SCI. Several investigators [26–30] have examined the distribution of neutrophils and macrophages during the first 7 days after experimental contusion or clip compression injury. The initiation of the inflammatory response was nearly immediate, with neutrophils being the first cells to migrate into the tissue within a few hours of injury. The influx of macrophages derived from microglia probably starts very soon after injury, whereas the active migration of hematogenous macrophages is slightly delayed starting at 3 days post SCI in the rat. Low numbers of ED1+ macrophages were present between 8 and 72 hrs with a maximal number appearing by 7 days and then slowly declining thereafter. These cells were predominantly located in within the GM and dorsal funiculus of the WM. The numbers of cells gradually declined away from the lesion epicenter. In regions rostral or caudal to the epicenter, prolonged activation of inflammatory cells occurred preferentially in WM and consisted primarily of activated microglia.
Many observations in our image data correspond well with the findings from these immunohistochemical studies. For instance, our image data show that regions of signal loss were predominantly located within the GM and dorsal funiculus of the WM and that the number of regions of signal loss decreased away from the lesion epicenter. Other comparable findings, including the observation that larger areas of signal loss were observed at Day 4 post-SCI than at Day 1 post-SCI, and that rostral or caudal to the epicenter signal loss was observed preferentially in WM, lead us to hypothesize that we are observing primarily macrophage responses. Because there are currently no unique markers for distinguishing between hematogenously derived macrophages and macrophages derived from microglia, the identity of the cells contributing to the signal loss observed in the cord images cannot be stated unequivocally. It is interesting that we do not observe large regions of signal loss at Day 1 post SCI, corresponding to the peak influx of neutrophils, which are also phagocytic. It may be that neutrophils do not efficiently internalize the relatively large SPIO nanoparticles. Alternatively, an injection of SPIO at 4–6 hr post SCI may already be too late to target the neutrophil infiltration. Thus, further investigation is needed to resolve the outstanding issues surrounding the detection of neutrophils by MR using SPIO nanoparticles.
When and where the cells become labeled with iron oxide is an important point to consider. Active labeling strategies, such as those used in these experiments, are based on the assumption that phagocytic cells in the blood during an immune response can be targeted with an intravenous injection of SPIO nanoparticles. It is also assumed that these cells then migrate to the site of inflammation carrying the magnetic label with them and allowing their visualization with MR. Another possible mechanism for cell labeling under our experimental conditions, however, is that SPIO nanoparticles cross, or are trapped at, the disrupted blood-spinal cord barrier and are subsequently taken up by phagocytic macrophages and/or microglia already in the lesion site.
Our imaging approach has shown that iron-labeled cells can be detected in neuroinflammation. This work provides early evidence that cellular responses that are the basis of disease can be probed. Understanding the details of the cellular inflammatory response is crucial for an appreciation of secondary injury in SCI and will suggest better approaches for controlling cell responses and facilitating regeneration. In vivo cellular imaging of the injured spinal cord is the next step and will present the next challenges.
Footnotes
Acknowledgments
This work was supported by the Canadian Institutes of Health Research and the Ontario Neurotrauma Foundation. We thank Dr. Brian Rutt and Andrew Alejski for pulse sequence and gradient coil insert development.