
Abstract
The ability to visualize cell infiltration in experimental autoimmune encephalomyelitis (EAE), a well-known animal model for multiple sclerosis in humans, was investigated using a clinical 1.5-T magnetic resonance imaging (MRI) scanner, a custom-built, high-strength gradient coil insert, a 3-D fast imaging employing steady-state acquisition (FIESTA) imaging sequence and a superparamagnetic iron oxide (SPIO) contrast agent. An “active labeling” approach was used with SPIO administered intravenously during inflammation in EAE. Our results show that small, discrete regions of signal void corresponding to iron accumulation in EAE brain can be detected using FIESTA at 1.5 T. This work provides early evidence that cellular abnormalities that are the basis of diseases can be probed using cellular MRI and supports our earlier work which indicates that tracking of iron-labeled cells will be possible using clinical MR scanners.
Introduction
Multiple sclerosis (MS) is an autoimmune demyelinating disease of the central nervous system (CNS). The symptoms of MS vary depending on the pathological nature and the location of lesions within the CNS [1]. Experimental autoimmune encephalomyelitis (EAE) encompasses a group of CNS inflammatory/autoimmune diseases in various laboratory animals, including the mouse, rat, guinea pig, primate and marmoset [2–4]. Ongoing disease activity, in MS and EAE, is due to an active inflammatory process and is associated with blood–brain barrier (BBB) damage. Most evidence indicates that inflammatory cell infiltration, through the disrupted BBB, is an early event in the development of the MS lesion [5]. The prime inflammatory process is around blood vessels; in histological images, this process is recognized as perivascular cuffs of infiltrating inflammatory cells [6].
The importance of T cells in EAE has been extensively documented, particularly the ability to initiate the disease and the autoimmune specificity for myelin provided by these cells [7]. However, other cell types, specifically the infiltrating macrophages and endogenous microglia, likely provide the actual effector mechanisms leading to inflammation and demyelination. The macrophage is involved in different phases of disease in EAE and MS and plays an important role in the process of demyelination [8,9]. Macrophages emigrating from blood vessels digest myelin either as a response to inflammatory damage to the myelin or as a response to activation signals produced in either the perivascular region or the lesion. This inappropriate macrophage activation leads to patchy demyelination and axonal damage. Some evidence suggests that the degree of macrophage infiltration associated with certain MS lesions is very closely related to the likelihood of progressing to demyelination [10]. Several studies have correlated the presence of certain macrophage populations with different phases of the disease and this has led to new classification schemes that are based on the macrophage populations associated with lesions [11]. Clearly, there are important and unresolved questions related to how the degree of macrophage involvement, the role of distinct populations of macrophages and their spatial distribution contribute to lesion development and disease progression in MS and EAE.
The most common method for assessing the extent of macrophage involvement, or the effectiveness of various therapeutic strategies that inhibit inflammation, involves a histopathological evaluation of multiple tissue sections. Pathologic grading systems are frequently used to estimate the extent of perivascular cuffing using a cellular stain such as hemotoxylin and eosin (H&E). These techniques are often only semi-quantitative, laborious, and destructive. Methods that would permit the nondestructive or noninvasive definition of macrophage involvement in neuroinflammation, over the time course of the disease, would have a tremendous advantage over conventional histological techniques, and may represent important markers for early events in MS.
Magnetic resonance microscopy (MRM) is well suited to study cellular events in neuroinflammation [12–15]. Individual perivascular cuffs have been visualized in EAE guinea pig brain tissue by MRM at 9.4 T with high-resolution 3-D T1 stains [16]. Cellular imaging is a newly emerging field that combines the ability to obtain high-resolution MRM data with novel contrast agent strategies for labeling specific cells, thereby enhancing their detectability. The use of iron oxide based contrast agents for cell-specific imaging by MRI has now been demonstrated in a number of different disease applications [17–24]. The detection of brain lesions in EAE models was one of the early applications of this imaging approach [19,20]. Intravenously administered iron oxides, taken up by macrophages in the brains of EAE animals, could be visualized with MRI. This approach has been termed “active labeling” of cells. The presence of iron oxide is indicated by hyperintense regions in T1W images or abnormal signal hypointensities in T2- or T2*-weighted images, depending on the magnetic field strength and the concentration of iron. The large magnetic susceptibility of these particles can affect an area much larger than the actual size of the particles; this effect is known as a “blooming artifact” and leads to an exaggeration of the region occupied by iron oxide. The particle size, dose, and delay before scanning have all been shown to be important factors to consider for optimal detection of macrophages in EAE [25–27]. Several other factors also influence the visualization of iron-labeled cells in tissues, including the main magnetic field strength, the pulse sequence and timing parameters, and the spatial resolution.
The purpose of this work was to determine whether active labeling strategies could be used together with new tools and concepts for cellular and microimaging at low field, developed in our laboratory [28], to enable the visualization of perivascular cuffing in EAE using a clinical 1.5 T scanner. Our results show that small, discrete regions of signal void (RSVs) corresponding to iron accumulation in EAE brain can be detected using FIESTA at 1.5 T. This work provides early evidence that cellular abnormalities that are the basis of disease can be probed and supports our earlier work that indicates that tracking iron-labeled cells will be possible using clinical MR scanners.
Materials and Methods
Animal Model
EAE was induced in 8-week-old female Lewis rats by a single injection of whole CNS homogenate in complete Freund's adjuvant (CFA) with inactivated Mycobacterium tuberculosis. Immunization was performed by intradermal inoculation of 0.1 mL in the footpad of each hind leg under general anesthesia. The dose per rat was calculated to be the following: 0.1 g of Hartley guinea pig CNS, 0.01 mL CFA, 0.75 mg additional irradiated mycobacteria tuberculosis H37Ra. All animals were kept in individual cages with standard conditions of light and free access to water and food.
The clinical signs of EAE begin approximately 6 days postimmunization. Animals were weighed and scored daily for the clinical features of EAE according to the following scale: 0 = normal healthy animal, 1 = loss of tail tonus, 2 = hind limb weakness, 3 = complete hind limb paralysis, 4 = complete paralysis, incontinence, and moribund conditions. Scoring began the day after immunization. Day 0 was considered the day on which inoculation of EAE occurred.
In Vivo Imaging: Gadolinium Enhancement Studies
Imaging was performed at 1.5 T using a CVi/MR GE clinical scanner. Gadolinium enhancement in T1-weighted images was assessed in the brains of EAE rats (n = 15). Animals were anesthetized for imaging using an intraperitoneal injection of ketamine/xylazine (100/10 mg/kg) and positioned inside a custom-built quadrature surface RF coil. A T1W multislice spin-echo image (TR/TE 600/20 msec) was acquired before and immediately following a single intravenous injection of gadolinium-DTPA (Magnevist, 100 mmol/kg) into the tail vein. Five animals were imaged on each of four consecutive days, beginning when the first clinical signs were apparent. Five animals were imaged once, when the clinical score was 2, and five others were imaged once, when the clinical score was 3. Information about the leakiness of the BBB was used to guide the choice of timing for the intravenous injection of iron oxide contrast agent in subsequent EAE animal imaging experiments.
Ex Vivo Cellular Imaging Studies
Rat brain specimens were imaged using a custom-built gradient insert coil, designed and constructed in our laboratory. The coil was designed using a Constrained Current Minimum Inductance design algorithm [29]. The resulting coil had the following characteristics: inner diameter 11 cm, peak slew rate 2000 T/m/sec and maximum gradient strength 1200 mT/m. The entire set-up procedure required approximately 15 min to complete.
Seven EAE rats were administered Feridex (Berlex: Cambridge, MA). A catheter (24 gauge) was inserted into the rat tail vein then heparin diluted in saline was injected (0.5 mL) followed by Feridex (22.4 mg Fe/kg) diluted in saline (1 mL total volume). Control animals consisted of normal healthy animals administered Feridex (n = 4) or saline (n = 4), and EAE animals administered saline (n = 4). Twenty-four hours after the injection euthanasia was performed and the rats were perfusion-fixed with 3.75% neutral-buffered formalin (Sigma). Rat brains were excised and stored in 10% formalin until imaging. Just prior to imaging, brain specimens were placed in 1-cm diameter plastic tubes and immersed in Fluorinert (3M, Ontario, Canada) then positioned in a custom-built solenoidal RF coil within the gradient insert.
Rat brain specimens were imaged using a 3-D fully refocused gradient-echo sequence (3DFIESTA, GE Medical Systems, Milwaukee, WI), which was previously optimized for cellular imaging [28]. The parameter values used for rat brain imaging with FIESTA were as follows: TR/TE 7.7/3.6 msec, flip angle 30°, 21 kHz bandwidth, spatial resolution was either 100 or 200 μm isotropic using a 2-cm FOV, 200 × 200 or 400 × 400 matrix, and a slice thickness of 0.1 or 0.2 mm. 3DFIESTA images were compared with 2-D T2-weighted fast spin-echo (2DFSE) and 3-D spoiled gradient-echo (3DSPGR) images. SPGR images were acquired with the imaging parameters closely matched to those as of FIESTA. For 2DFSE, the scan parameters were as follows: BW 16 kHz, TR/TE 3000/80 msec, 256 × 128 matrix, slice thickness 0.2 mm. For 3DSPGR, the scan parameters were as follows: BW 21 kHz, TR/TE = 9/4 msec, 200 × 200 matrix, slice thickness 0.1 or 0.2 mm and 30° flip angle (FA). To investigate the influence of signal to noise ratio (SNR) and spatial resolution on the ability to detect iron-labeled cells in brain tissue, the number of signal averages, bandwidth, matrix size, and/or slice thickness were varied signal to noise ratio (SNR) was defined as the mean SI in a region of interest (ROI) drawn in brain GM and WM, divided by the standard deviation of noise SI from an ROI selected in background air. An average value for SNR was determined from three SI measurements taken in various parts of the brain images. CNR was calculated as the difference between mean SI in brain tissue versus the mean SI in regions of iron oxide induced signal void (RSV), divided by the standard deviation of noise SI measured in background air.
Correlative Histopathology
After imaging, the specimens were prepared for histopathological analysis. Specimens were embedded in paraffin in such a manner that 8-μm sections could be cut from the block. Sections were stained with H&E to assess cellular infiltrate. Contiguous sections were stained with Perl's Prussian Blue (PPB) counterstained with Nuclear Fast Red to demonstrate iron uptake and immunolabeled with mouse anti-rat ED1 (also known as anti-CD68). The monoclonal antibody (mAb) ED1 is widely used as a marker for rat macrophages. The ED1 antigen is expressed on lysosomal membranes, and weakly on the cell surface of myeloid cells. This antigen is expressed by the majority of tissue macrophages and weakly by peripheral blood granulocytes. ED1 (1:300) was applied to sections overnight in a humidified chamber at 4°C after blocking with 5% normal goat serum (NGS), and 0.3% H2O2 in PBS. Sections were rinsed with PBS-Tween 20 (3 ×), after which a biotinylated goat anti-mouse (H + L) IgG secondary antibody was applied (1:500) for 2.5 hr at room temperature. Sections were washed again with PBS-Tween 20, treated with extravadin–peroxidase (1:500, 3 hr) (Sigma), and finally, a DAB solution. Sections were counterstained with hematoxylin. Sections were dehydrated through ascending alcohols, cleared in xylene, and coverslipped with Cytoseal-60 (VWR International). Histopathological and MRM images were matched by locating corresponding landmarks.
Results
In Vivo Gadolinium Enhancement Study
Gadolinium enhancement observed in post Gad T1W SE images was a useful indication of BBB permeability in EAE rats. Of the 15 EAE rats imaged, Gad enhancement was observed in 13 animals. In all 13 rats, enhancement was observed when the animal's clinical score was either 2 or 3. This time point varied between Days 9 and 12 postimmunization. Based on these findings, the clinical score, and not the day postimmunization, was used to plan iron oxide administration. Feridex was administered to seven EAE rats, five of these animals had a clinical score of 3 and two animals had a clinical score of 2.
Ex Vivo Brain Specimen Scanning
The FIESTA imaging sequence has proven to be highly sensitive to the superparamagnetic effects of iron oxide. Small, localized RSVs were visualized in the brains of all EAE rats that were injected with SPIO. In non-EAE animals injected with SPIO, and in EAE animals that were injected with saline, RSVs were not observed. Multiple brain regions were affected. Figure 1 shows representative brain images, from control animals and four different EAE animals.
In Figure 2, FIESTA images are compared to the more commonly used T2W FSE. For FIESTA images, the spatial resolution is either 200 μm isotropic (B) or 100 μm isotropic (C). When comparing T2W FSE and FIESTA images, it is clear that the area of signal loss is more exaggerated in the FSE image. In FSE images with lower SNR, small discrete areas of signal void observed in FIESTA images went undetected. The RSVs are more distinct in the higher-resolution FIESTA image (C). This is likely due to partial voluming in the 200-μm-thick image slice of Figure 2B. Tissue contrast is similar in T2W FSE and FIESTA images.

Representative FIESTA images (100 μm isotropic spatial resolution) of rat brain demonstrating the detection of localized RSVs in EAE animals administered Feridex intravenously during the course of neuroinflammation. (A–D) Images from four different EAE animals with areas of signal loss observed throughout the brain; (E) Brain image from normal rat injected with Feridex; (F) Brain image from EAE rat injected with saline.
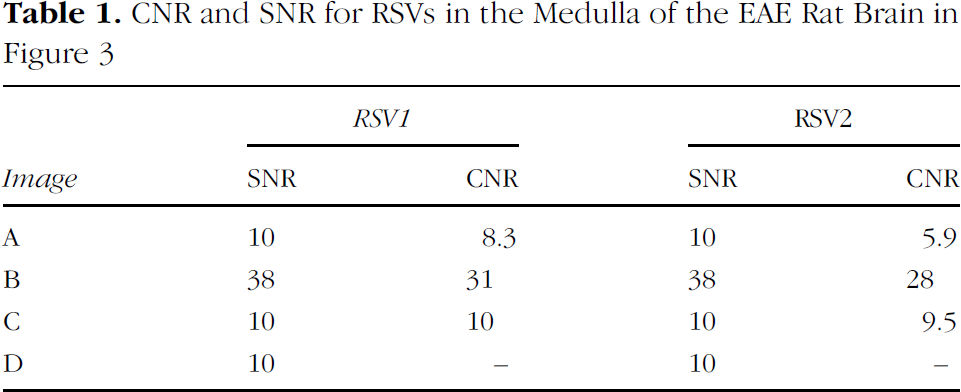
Figure 3 compares FIESTA and SPGR images. Table 1 lists the SNR and CNR for the RSVs 1 and 2. Images (A) and (B) are FIESTA images matched for resolution (100 μm isotropic) and TR/TE (7.7/3.6 msec) with increasing SNR due to signal averaging. The parameters are: (A) 1 nex, 3-min scan time, SNR = 10; (B) 16 nex, 55-min scan time, SNR = 38. The ability to detect the small discrete RSVs is clearly enhanced with increased SNR and CNR. CNR was measured for the RSVs indicated by numbers 1 and 2 in Figure 3B. CNRs were 8.3 and 5.9 in (A), and 31 and 28 in (B), for RSVs 1 and 2, respectively.
While the SNR contributes to the CNR, it is not the only factor influencing the ability to detect these small regions of signal loss. As shown in Figure 2, lower spatial resolution (increased voxel size), which increases SNR, interferes with the ability to localize small areas of signal loss due to partial voluming effects (Figure 2, B vs. C). In Figure 3, the FIESTA image in (C) has higher spatial resolution (50 × 50 × 100 μm) relative to that in (A), but the SNR is matched (SNR = 10) through signal averaging (6 nex). The CNRs for RSV1 and RSV2 are higher in (C) than in (A), at 10 and 9.5, indicating an enhanced ability to detect the RSVs. In this case, detectability is likely improved by both higher spatial resolution (50 × 50 × 100 μm) and longer TR/TE (12.7/6.3 msec). The CNRs for RSV1 are consistently higher than those for RSV2 in the FIESTA images. In addition, the signal loss extended through more image slices for RSV1 than for RSV2. These observations may indicate either the presence of a higher concentration of iron or the distribution of iron over a greater spatial extent.
The SPGR image in (D) is also matched to the FIESTA image in (A) for SNR [10] as well as resolution (100 μm isotropic) and TR/TE (7.7/3.6 msec). However, the contrast due to the presence of iron oxide is very low in these SPGR images, and does not permit the visual discrimination of small regions of signal loss from background, and so precludes a measurement of CNR. With higher CNR, due to increased SNR or larger regions of signal loss associated with higher concentrations of iron, SPGR may permit the visualization of small RSVs. However, the scan time required to obtain equivalent CNR through increased SNR, by signal averaging, would be prohibitive.

Comparing the FIESTA and T2-weighted FSE imaging sequences for detecting susceptibility induced contrast from iron oxide accumulation in rat brain tissue at 1.5 T. (A) 2-D T2W FSE; (B) FIESTA 200 μm isotropic spatial resolution; and (C) FIESTA 100 μm isotropic spatial resolution.

Comparing the FIESTA and SPGR images. Two RSVs, visible in the medulla of this EAE rat brain, are labeled 1 and 2. (A–C) FIESTA images; (A) 100 μm isotropic resolution, no averaging, TRITE = 7.7/3.6 msec, SNR = 10, 3 min; (B) 100 μm isotropic resolution, 16 nex, TR/TE = 7.7/3.6 msec, SNR = 38, 55 min; (C) 50 × 50 × 100 μm, 6 nex, TR/TE = 12.7/6.3 msec, SNR = 10, 1 hr, (D) 3DSPGR 100 μm isotropic resolution, 16 nex, TR/TE = 7.4/3.1 msec, SNR = 10, 50 min.
Histology
Our histological analysis showed that patterns of signal loss in the FIESTA images of EAE rat brain matched patterns of perivascular cuffing that were identified in the corresponding H&E stained sections (Figure 4). The arrows in Figure 4A and B indicate where the RSVs in the MR image and the perivascular cuffs in the H&E image correlate. Exact correspondence is not achievable since the MR image slice is 100 μm thick and the histological image is only 8 μm thick. PPB staining showed the presence of SPIO particles in cells. The discrete areas of signal loss correspond to individual clusters of iron-labeled cells associated with cell infiltration in perivascular cuffs (Figure 5). In Figure 5, four individual RSVs are indicated in the FIESTA images (A and B). In the PPB-stained histological image (Figure 5C), four individual perivascular cuffs are shown which correspond to these RSVs. In Figure 5B and C, these are numbered 1 through 4. In Figure 5D, a single cuff is shown which corresponds to area.
In EAE brains, clusters of ED1 positive cells were found throughout the brain (Figure 6). The ED1 positive cells were predominantly located around blood vessels (Figure 6B and C). In Figure 6C and D, higher magnification of an individual perivascular cuff is shown. While many ED1 positive cells surround the vessel in Figure 6C, only a few of these cells (arrows) have been labeled with iron as indicated by the PPB stain (D). This figure reveals some of the concerns with the active labeling strategy and Perl's staining. First, as is clear in Figure 6D, not all of the cells in a single cuff are iron labeled. This was a common observation. Another second point to note is that only a small percentage of the many perivascular cuffs in the EAE brains contain any cells that are iron labeled. This results in a percentage of the cuffs going undetected with any MRI pulse sequence. Finally, it was often necessary to analyze multiple contiguous PPB-stained histological slices to account for the iron-labeled cells in a single perivascular cuff which contribute to the RSV observed in the FIESTA image. Because it is practically impossible to obtain evenly sliced contiguous slices through an entire brain specimen, iron-labeled cells will go unaccounted for.
Discussion
We have developed methods for cellular imaging at 1.5 T, using a clinical whole-body scanner, for an alternative approach to microimaging. To accomplish this, new tools and concepts were applied and tested which included a custom-built, insertable, high-powered imaging gradient set, customized radio-frequency (RF) coils and optimized pulse sequence technology. This strategy, together with active cell labeling with the use of superparamagnetic iron oxide nanoparticles, has allowed us to visualize small clusters of inflammatory cells in EAE brain.
CNR and SNR for RSVs in the Medulla of the EAE Rat Brain in Figure 3

Correspondence between perivascular cuffing in EAE brain identified with (A) FIESTA imaging and (B) H&E stained histology. Arrows indicate where the RSVs in the MR image and the perivascular cuffs in the H&E image correlate.
MR Detection
The large magnetic susceptibility of SPIO particles produces magnetic field inhomogeneities that are known to affect regions in MR images over a far greater extent than the actual particle distribution. This effect, on the microscopic scale, permits the visualization of single cells in vitro [28,30]. On the macroscopic scale, however, large collections of SPIO-labeled cells can influence MR signal intensity many pixels away, and produce an effect typically described as blooming artifact. The size of the blooming artifact is sequence and echo time dependent. To visualize this effect, most imaging studies have used T2- or T2*-weighted SE and GRE pulse sequences. The RSV in these MR images is consequentially larger than the actual area occupied by the iron-labeled cells. This is well demonstrated in a paper by Bulte et al. [21], where the blooming effect due to the presence of hundreds of iron-labeled CG cells transplanted into the spinal cord of a myelin-deficient rat is compared with corresponding PPB-stained sections.

Correspondence between iron-loaded cells detected in FIESTA images of EAE brain and PPB-stained histology. High-resolution FIESTA images provide details on the number, size, and shape of perivascular cuffs in EAE brain tissue. (A) FIESTA image slice; (B) Magnified view of ROI indicated in A; (C) Corresponding PPB-stained histology at ×4 magnification and (D) at ×40 magnification. In (D), the stained cells correspond to area 4 of (B) and (C).

ED1 positive cells are visible throughout the medulla in the EAE brain (A). RSVs are also commonly observed in the medulla as shown in this 100 μm isotropic FIESTA image (B). At the level of an individual perivascular cuff, ED1 positive cells are found primarily surrounding the blood vessel (C). Iron-positive cells (arrows) identified in the Perl's stained section are fewer in number than ED1 positive cells.
The relative detection sensitivity between SE and GRE acquisitions was assessed in another paper from this group. FSE (TR/TE of 3000/45 msec) was compared to GRE (TR/TE of 300/20 msec, 20° FA) acquisitions at 1.5 T to demonstrate the much higher sensitivity of the T2 * W GRE sequence; the blooming artifact was much larger and the ability to detect the group of transplanted cells was improved [22].
Dousset et al. [20] reported that ultra-small iron oxide nanoparticles (USPIOs) administered intravenously, and in vivo T2-weighted SE imaging provided 100% sensitivity for lesion detection in EAE rats; RSVs were observed in all EAE animals. In this and other EAE studies, large regions of signal loss, resulting from blooming artifact are typically observed in the brainstem and cerebellum. Many studies have used iron oxide nanoparticles and similar imaging techniques in various applications to successfully visualize the presence of iron-labeled cells in tissues [18–24]. The relative tradeoff between detection sensitivity and the degradation of specificity from blooming artifact is still problematic though.
The images obtained with our microimaging system and the FIESTA imaging sequence are different. The acronym FIESTA stands for fast imaging employing steady-state acquisition and is also described in the literature as balanced fast field echo or fast imaging with steady precession (true-FISP) sequence [31,32]. The technique uses multiple RF pulses to generate a multitude of overlapping spin echoes, and full refocusing of transverse magnetization. The FIESTA images we have presented show very small, discrete regions of signal loss in numerous brain regions. Our histological data indicate that the number of iron-labeled cells associated with perivascular cuffing in these EAE brains is small, on the order of ones to tens of cells, and that they are scattered throughout the brain in multiple locations. These small abnormalities may represent the early cellular abnormalities and events in lesion formation that have not been visualized previously in similar EAE studies which used T2W SE and FSE or T2*W GRE sequences.
The FIESTA imaging sequence has a number of advantageous features, over other imaging sequences, for certain cellular imaging applications. What was originally considered a negative aspect of this imaging sequence, the high sensitivity to off-resonance effects, has made it very effective for cellular imaging with iron oxide nanoparticles. Our previous studies [28] have shown that single iron-loaded cells can be detected in vitro using the FIESTA imaging sequence at 1.5 T, with cell loadings as low as 6 pg of iron per cell. For this sequence, the signal response exhibits many of the blooming artifact suppression traits intrinsic to spin-echo sequences, while maintaining the sensitivity to iron oxide-labeled cells intrinsic to gradient-echo sequences. The reason for this lies with the unique off-resonance behavior of true-FISP sequences [32,33]. The NMR signal at the readout time (TR/2) for true-FISP sequences is well described as a spin echo, with the refocusing axis of the spin echo along either the + y′ or –y′ axis of the rotating frame. The specific axis along which the spin echo forms depends upon the local off-resonance frequency of the NMR signal, and alternates direction for off-resonance bands having full width defined by 1/TR. Therefore, macroscopic field inhomogeneities responsible for blooming, as produced by imperfect shimming or proximity to large clusters of iron oxide cells, are refocused as a spin echo. However, since the off-resonance produced, by even a single cell with 6 pg of iron, can span several thousand Hertz locally, pixels containing such cells involve spin-echo signal formation along two opposing axis, producing signal cancellation comparable to that observed with gradient-echo sequences. It is this unique response to off-resonance, which produces both the blooming artifact suppression and cellular detection sensitivity, which results in FIESTA acquisitions being so well suited to imaging iron oxide-labeled cells.
In addition, the FIESTA sequence provides substantially enhanced SNR, relative to GRE and SE sequences, as a result of the multiple signal refocusing paths available for tissues with T2 much greater than TR. This significant improvement in SNR efficiency allowed for microimaging at lower field strengths than is typically possible, and for the acquisition of images at high spatial resolution with reasonable scan times. These two factors were key to our ability to visualize small numbers of iron-labeled cells. Imaging at 1.5 T with FIESTA is an advantage since at higher magnetic field strengths, more typically used for microimaging, off-resonance banding artifacts that result from imperfect shimming, are more pronounced. The gradient coil insert was key to obtaining fast, high-resolution images with FIESTA. The benefits of which were illustrated by an observed 40% average increase in the CNR for regions of signal loss (Figure 3) as the voxel size were reduced. The increased CNR results from a reduction in partial voluming between regions with and without iron oxide-labeled cells.
Specificity of Cell Labeling by SPIO Particles
We used an active labeling approach where an intravenous injection of Feridex was administered at a time point during the course of EAE when there is an ongoing, active inflammatory reaction. The goal is to have hematogenous inflammatory cells take up iron particles during the cellular response and infiltrate the CNS so that their presence, spatial distribution, and numbers can be detected.
Our histological data show that not all of the perivascular cuffs in EAE brains contain iron-labeled cells. In addition, not all of the infiltrated cells contained in an MR-visible perivascular cuff contain iron oxide particles. However, not all of the cells in an individual cuff need to be iron labeled to allow the visualization of that cuff in the FIESTA image. Our studies have shown that even a few iron-labeled cells will allow the identification of a perivascular cuff in high-resolution FIESTA images. It is likely that in previous studies which have used more conventional T2-weighted SE or T2*-weighted GRE imaging sequences, or lower resolution imaging, lesions with only a small number of iron-labeled cells were not detected.
The low efficiency of cell labeling with intravenous iron oxide administration is not unique to these studies. It is well known that in vivo targeted cell labeling with iron oxide depends on the physical characteristics of the particles and their uptake by cells of the reticuloendothelial system (RES) (liver, spleen, and lymph). A large fraction of the iron oxide particles administered intravenously will be taken up by the RES. Larger particles are, in fact, taken up by the RES more efficiently [34] and this has led to the preferential use of USPIOs, which consequentially have a longer blood half life than SPIO, for most imaging studies of neuroinflammation [35–37]. Even with long-circulating USPIOs, only a small fraction of cells are labeled. Still, many studies have demonstrated that this approach does in fact result in sufficient numbers of cells being labeled with iron in the bloodstream and transported to the site of inflammation to allow their detection with MRI. For our studies, we chose to use Feridex, an SPIO, despite its shorter circulation time, because of its greater susceptibility [38] and because free Feridex is not likely to cross the basement membrane of capillaries, as smaller iron oxide agents do [39]. At a sufficiently high dose, the RES is saturated [40] and iron oxide particles are captured in the bloodstream by phagocytic cells of the immune system. More efficient in vivo cell labeling may come with the advent of new agents that have improved uptake and internalization into cells, surface modifications that allow the resistance to protein adsorption and recognition by cells of the RES, or are capable of targeted uptake by specific cells [41–43].
The concept of identifying only a portion of the infiltrated cells in active inflammation may at first seem futile. However, clinically, there is tremendous value in noninvasive markers that can demonstrate changes in the degree of inflammation, during disease progression, or in response to anti-inflammatory therapies or treatments. Macrophages are involved in every stage of disease progression in MS. Their presence has been noted during inflammation, in removal of myelin debris, and even in myelin repair [44].
Our results suggest that the RSVs in the FIESTA images represent the locations of iron-labeled cells in the EAE brain. In most cases, the patterns of signal loss and correlative histology suggest a perivascular location. However, the location does not establish the “source” of these cells. Within the CNS of rats with EAE, there are at least three different subpopulations of macrophages that might occupy these locations [45]. These include: (i) blood-borne macrophages infiltrating the perivascular lesions in the CNS; (ii) “resident” perivascular macrophages; and (iii) “resident” reactive microglial cells. It has also been suggested that iron oxide phagocytosed by CNS endothelial cells may be the cause of the signal loss in some cases [46]. All of these phagocytic cell types are known to take up iron oxide particles in vitro, either by endocytosis or phagocytosis depending on the particle size, and with different efficiencies depending on the cell type. The considerable functional and immunophenotypic heterogeneity of these cell types makes it unclear whether and how in vivo factors will influence cell-specific iron oxide uptake.
In order to determine what types of cells are in the tissue, it is common to use histological or immunohistochemical analysis to visualize the morphology (size and shape) or the response to markers (antibodies). There are currently, however, no unique histochemical markers that can distinguish resting or activated microglia from monocytes/macrophages in the circulation, or from macrophages which have invaded the brain. A multitude of stains would be required to get a limited appreciation of the true source of cells in the CNS. Alternatively, the source of the cells can be addressed indirectly by cell manipulation or inflammation modulation experiments; these types of studies are underway in our labs.
Using histological stains to identify the presence of iron in cells, and to correlate the location of iron-labeled cells in brain tissue with RSVs detected in the MR images, is also very challenging. The staining technique we used to stain iron in cells or tissue is known as Perl's Prussian Blue [47]. Staining iron oxide-labeled cells is trivial when you have hundreds or thousands of cells in a location but is much more difficult when there are only a few cells to locate. New 3-D optical imaging methods may permit a more realistic representation of cells in tissues [48,49].
Despite the various challenges for histological verification of the presence of iron in cells, and the source of cells, a body of indirect evidence is growing which supports the notion that, with active labeling techniques, the signal loss in MR images depicts the actual migration of iron-laden macrophages from the circulation into the brain. Dousset et al. demonstrated that the scanning delay is critical for performing macrophage activity imaging. Their studies suggest that images should be acquired approximately 24 hr after intravenous injection of iron oxides, which is 5–10 times the blood half life of USPIO or SPIO in the rat, While free iron oxide particles may cross the BBB during this window, an active cellular uptake of iron oxide particles is necessary for the particles still to be present in the parenchyma after 5–10 blood half lives. In studies of EAE, MS, and ischemia [35–37,50], which compare Gad-enhanced T1W images and SPIO-induced signal loss in T2 or T2 * W images, breakdown of the BBB and macrophage infiltration appear to be unrelated events. The results of these studies counter the idea that passive diffusion of particles is occurring through a leaky BBB with subsequent uptake by local resident macrophages.
Our imaging approach has shown that even very small numbers of iron-labeled cells can be detected in neuroinflammation. This work provides early evidence that cellular abnormalities that are the basis of disease can be probed and supports our earlier work which indicates that tracking of iron-labeled cells will be possible using clinical MR scanners. In vivo imaging of EAE rat brain is the next step and will present the next challenges.
Footnotes
Acknowledgments
This work was supported by the Canadian Institutes of Health Research. We thank Dr. Brian Rutt and Andrew Alejski for pulse sequence and gradient coil insert development. Dr. Chris Bowen is gratefully acknowledged for assistance in reviewing the manuscript.