
Abstract
Fluorescent ligands provide the means of studying receptors in whole tissues using confocal laser scanning microscopy and have advantages over antibody- or non-fluorescence-based method. Confocal microscopy provides large volumes of images to be measured. Histogram analysis of 3-D image volumes is proposed as a method of graphically displaying large amounts of volumetric image data to be quickly analyzed and compared. The fluorescent ligand BODIPY FL-prazosin (QAPB) was used in mouse aorta. Histogram analysis reports the amount of ligand-receptor binding under different conditions and the technique is sensitive enough to detect changes in receptor availability after antagonist incubation or genetic manipulations. QAPB binding was concentration dependent, causing concentration-related rightward shifts in the histogram. In the presence of 10 μM phenoxybenzamine (blocking agent), the QAPB (50 nM) histogram overlaps the autofluorescence curve. The histogram obtained for the 1D knockout aorta lay to the left of that of control and 1B knockout aorta, indicating a reduction in 1D receptors. We have shown, for the first time, that it is possible to graphically display binding of a fluorescent drug to a biological tissue. Although our application is specific to adrenergic receptors, the general method could be applied to any volumetric, fluorescence-image-based assay.
Introduction
3-D imaging has become more and more commonplace in research laboratories over the past 10 years. This is partly due to the decreasing cost of computing and storage hardware and the increasing number of robust software packages for image analysis. Imaging itself has become an integral part of basic biomedical research in the form of blots, gels, microarrays, and digital images. In clinical practice, there is an ever-increasing reliance on magnetic resonance imaging, positron emission tomography, computed tomography, X-ray, and utrasound for diagnostic purposes. However, in most cases, whatever the application, interpretation of the image is generally left to the skilful eye of an individual researcher or consultant pathologist. In particular, where there is heterogeneity, the ability to discriminate between two situations by comparing images is low and the change must be very large to be detected. In basic research, there is a need to move away from subjective analysis to one with a more quantitative basis.
Confocal microscopy (or any digital 3-D microscopy) is used in biomedical applications to acquire a set of perfectly aligned serial “optical” sections of a fixed or live biological specimen. The standard tissue slice thickness for histology is around 5-50 μm. Confocal microscopy can be used to collect perfectly focused digital images (free from out-of-focus glare) up to depths of 100 μm. Multiphoton microscopy enables deeper penetration (up to 300 μm, depending on the tissue composition). Images are collected along the axial (z axis) plane at equal spacings of 0.1-1 μm and this can typically result in an image “stack” of 100 or more images with a total file size of about 25 megabytes (Mb). Therefore, large volumes of image data are accumulated and these have to be inspected or measured in some way such that comparisons between volumes can be made. Biomedical scientists often avoid the problems associated with quantification of 3-D image volumes and simply present 2-D images as representations of 3-D volumes. This approach can result in missing important information.
We have previously used confocal microscopy to study blood vessel structure [1–3] and receptor distribution in single cells [4,5]. However, we have not previously attempted a quantitative analysis of receptor density in the tunica media (smooth muscle) of blood vessels. This is not possible with conventional radioligand-binding techniques because the low expression levels of G-protein-coupled receptors and the small amount of material. The cellular heterogeneity and nonspecific binding of ligands to the extracellular matrix protein in the vascular wall is problematic. This is a fairly standard experimental biological situation and has echoes in many fields.
α1-Adrenoceptors (ARs) exist as three subtypes (α1A, α1B, and α1D), which are differentially distributed along the arterial tree [6]. In mouse and rat, larger vessels (e.g., aorta and carotid) tend to express mainly α1D-ARs, whereas the smaller vessels (e.g., mesenteric and tail arteries) express mainly α1A-ARs [7]. More information is required on the amount and location of receptor subtypes within the vessel wall.
Fluorescent ligands provide a means of visualizing the distribution of receptor subtypes in whole tissues using confocal laser scanning microscopy and have certain advantages over antibody- or non-fluorescence-based methods [8]. From a pharmacological point of view, a significant advantage is the ability to view the fluorescent ligand binding at equilibrium at concentrations around the dissociation constant. The fluorescent antagonist BODIPY FL-prazosin does not contain the important furan ring, which distinguishes prazosin from the other quinazolines; therefore, we prefer to use the more accurate chemical descriptor, quinazilyl piperadyl bodipy (or QAPB). In radioligand-binding studies, QAPB displaced radiolabeled prazosin from cell membranes expressing all three α1-AR subtypes. QAPB displayed no subtype selectivity and had roughly 10-fold lower affinity than prazosin [4,5]. Thus, QAPB is a safe alternative to radiolabeled ligands; it can be used at equilibrium and can be used in live cell fluorescence-binding experiments [5].
Genetically modified mouse models are potentially of value for the study of adrenergic control of blood vessels. Adrenoceptor knockout (AR-KO) models for each of the α1 subtypes have been created [9–11] and extensively studied (see Ref. [12] for a review). Recently, a double (α1A, α1B) knockout has been created and showed the importance of both subtypes in regulating myocardial contraction [13].
In the present study we have used confocal microscopy to examine the binding of QAPB to α1-ARs in normal and AR-KO aorta. In particular we show, using an image-based methodology, that binding of QAPB is reduced in the α1D-AR knockout (α1D-KO) aorta.
Materials and Methods
Animal Model
Breeding pairs of wild-type (WT) and α1D-KO mice were kindly supplied by Professor Gozoh Tsujimoto (National Children's Medical Research Center, Tokyo, Japan). Breeding pairs of WT and α1B-AR knockout (α1B-KO) were kindly supplied by Professor Susanna Cotecchia (University of Lausanne, Switzerland). All mice were bred in the University of Glasgow. Mice were maintained on 12:12-h light/dark schedule at 22-25°C and 45-65% humidity and fed ad libitum on a standard rodent diet and tap water. Adult males (35-50 g, 8-15 months old) were killed by CO2 before transportation to the laboratory for dissection. This is a humane method of killing carried out by licensed personnel. The generation and background of α1B-KO and α1D-KO mice have been described previously (Refs. [9,11], respectively). Functional studies have shown no significant difference in agonist-induced contractility between both strains of wild-type mice (i.e., α1D-KO and α1B-KO controls) Therefore, we used α1D-KO control as a control for both KO mice.
Tissue Preparation
Aortae were carefully removed from the thoracic cavity and placed in a Petri dish containing physiological salt solution (PSS). The segment immediately after the aortic arch was cleaned of adhering perivascular tissue and cut into rings approximately 2 mm in length.
Functional Studies
Segments of aorta were collected as above and mounted between 40-μm wires in a small vessel myograph (DMT) containing heated (37°C) and gassed (95%O2/5%CO2) PSS. Tissues were placed under 1 g resting tension and allowed to equilibrate for 60 min. A single concentration of 1 μM phenylephrine was first administered to check tissue viability. After washout with fresh PSS and a further 30-min equilibration, a concentration response curve (CRC) to phenylephrine was constructed (1 nM-0.3 mM) for each tissue type.
Comparative Study of QAPB and α1D-Adrenoceptor Antibodies
Rat-1 fibroblasts stably expressing human α1D-AR subtype were used. Coverslips with cells attached were washed in phosphate-buffered saline (PBS) and fixed in 1.5 mL paraformaldehyde for 10 min. After fixation, the cells were washed with PBS and incubated with 1.5 mL of Triton X-100 (0.5%) in PBS for 10 min at room temperature to permeabilize the cells. After a wash with PBS and 200 μL of blocking solution (10% donkey serum, 1% bovine serum albumin in PBS) cells were placed on the coverslip. Next, the primary antibody (α1D-AR, goat polyclonal IgG) was added to the cells at a dilution of 1:100 in PBS for 2 hr at room temperature. Coverslips were washed and the secondary rhodamine-conjugated antibody (donkey anti-goat) was added at a dilution of 1:100 for 1 hr. Finally, QAPB was added to the cells (30 nM) for 30 min. Cells were then positioned on the stage of the confocal microscope for visualization.
Fluorescent Staining
Autofluorescence from the folded internal elastic lamina can mask the fluorescent signal from QAPB-bound receptors, thus obscuring the signal. We overcame this problem by stretching the aorta rings over an 18-gauge needle and fixing them in a fixative solution (4% paraformaldehyde and 5% sucrose) overnight. The aortic rings were then cut open and washed in PSS for 20 min. After washing, the rings were incubated in QAPB for 3 hr at room temperature (20°C). A concentration of 50 nM of QAPB was used for comparison between WT and KO mice and for the specific QAPB binding studies. To determine the concentration-fluorescence relationship we used increasing concentrations of QAPB (10, 50, 100, 500 nM). Nonspecific binding was defined as fluorescent binding in the presence of 10 μM of phenoxybenzamine.
Laser Scanning Microscopy
A Noran Odyssey real-time confocal laser scanning microscope was used in conjunction with a Nikon Diaphot (inverted) microscope. The 488-nm line (515-nm band pass) of argon-ion laser and a 15-μm slit was used in all experiments. A Nikon 40 × oil immersion objective (NA 1.3) was used throughout. Laser output and detector gain/offset (contrast/brightness) settings were kept constant for all experiments in the comparative studies between WT and KO mice and in the specific QAPB binding studies. For the studies of concentration-fluorescence relationship it was not possible to maintain exactly the same values of photomultiplier tube (PMT) offset and gain for the different concentrations of QAPB because of the huge difference in fluorescence between the highest and lowest concentrations; therefore, when it was required the PMT offset was changed. It was decided to modify PMT offset instead of gain because our results had shown that although changes in both PMT offset and gain alter the histogram of intensities within the fluorescent volume, the changes in PMT offset produce smaller alterations on the curve (see Results). In addition, the laser parameters required in the studies of concentration-fluorescence relationship were different from the ones used in the other studies so it is not possible to compare these histograms with those obtained in the other studies. Images were collected using Metamorph software (Universal Imaging, Marlow, England). Multiple confocal image z series were collected from random areas of the vessel starting from the endothelial surface, below the internal elastic lamina and penetrating the medial layer (30 planes, 1-μm steps, 64 frame averages, the size of each plane is 512 × 512 = 102 × 102 μm).
Data and Image Analysis
All images were 8 bit and therefore each pixel is assigned a value ranging from 0 (black) to 255 (white). Intermediate values are displayed as shades of gray. A single histogram was generated for each z series using Amira software (TGS). The histogram plots the number of voxels that contain values between 0 and 255. Because each data volume (z series) contains the same number of image planes, the number of voxels remains constant, as does the area under the curve. Multiple histograms were averaged to produce the final graphs shown in the Results section. Further histograms were produced by dividing the intensity range into four bins representing the background (0-100), low-level (101-150), midlevel (151-200), and high- level (201-255) intensities. The percentage of total fluorescence occupying each bin was then displayed in a histogram format.
Percentage of Total Fluorescence Calculation
Each intensity value (I) from 0 to 255 has an associated number of voxels (VI). Therefore, total fluorescence for the image volume is equal to the sum of every value of I multiplied by its associated VI. To calculate the total fluorescence for each bin, I is restricted to a defined range as indicated above (i.e., I0-100, I101-150, I151-200, and I201-255). The fluorescence for each bin is then expressed as a percentage of total fluorescence.
Drugs and Solutions
The drugs used were of the highest analytical grade. The following compounds were used: QAPB and Syto 62 (Molecular Probes Inc., Eugene, OR); phenoxybenzamine hydrochloride (dibenyline, GlaxoSmithKline, Middlesex, England); paraformaldehyde (Sigma, Gillingham, Dorset, UK); sucrose (PDH); TritonX-100 (Sigma); bovine serum albumin (Roche, Hertfordshire, England); donkey serum (Autogen, Holliston, MA, USA); α1D-ARgoat polyclonal IgG (Autogen); Rhodamine Red-X-conjugated, donkey anti-goat IgG (Jackson Inmunosearch, Soham, England); PSS composition: NaCl 119 mM, KCl 4.7 mM, CaCl 2.5 mM, MgSO4·H2O 1.2 mM, KH2PO4 1.2 mM, NaHCO3 24.9 mM, glucose 11.1 mM.
Results
Functional Responses of Aorta to Phenylephrine in Wild-Type and Knockout Mice
Control (WT) and α1B-KO aorta displayed similar sensitivity to phenylephrine (EC50 6.75 and 6.62, respectively). However, the maximum response is greater for the α1B-KO (1.03 g) than for the WT (0.66 g). The CRC in α1D-KO aorta lay to the right of the control (EC50 5.11) and the maximum response is smaller (0.51 g) than that of control (Figure 1).
Comparative Study of QAPB and α1D-Adrenoceptor Antibodies
Rat 1 fibroblasts expressing α1D-ARs were labeled with both specific antibodies (Figure 2A) and QAPB (30 nM; Figure 2B). Perinuclear intracellular sites and cell surface sites were labeled by both fluorescent probes. Examination of both images indicates that binding of both probes occurs at identical sites. These images provide confirmation of the selectivity of QAPB for α1-ARs.
Imaging with a Fluorescent Ligand
Visualization of QAPB binding in the innermost layers of smooth muscle was facilitated by opening the vessels and viewing from the endothelial surface, as shown in Figure 2C. The use of a slit-scanning confocal microscope provides the benefit of increased speed and light collection at the expense of resolution. The requirement of this study was efficient photon collection and counting. Nevertheless, sufficient resolution was maintained such that binding to individual cells could be detected in all three aorta types (Figure 3). The QAPB binding-induced fluorescence in α1D-KO was always reduced compared with WT and α1B-KO (Figure 3).

. Comparison of the phenylephrine CRCs in thoracic aorta taken from WT (▪), α1B-KO (○), and αa1D-KO (□) 16-month-old mice. Responses are shown both in grams force (A) and normalized, expressed as percent of maximal response (B). Data are means ± SEM of tissues from WT (n = 7), α1B-KO (n = 12), and α1D-KO (n = 12) animals.
Effect of PMT Offset and Gain on the Fluorescence Distribution Histogram
To establish if changes in PMT offset or gain alter the volumetric fluorescence intensity histogram, a z sections series from microspheres with a green fluorescent surface were taken. The laser power was kept constant for all the z series taken and either PMT offset or gain was increased or decreased. From these z series, the number of voxels that contain values between 0 and 255 representing fluorescence were plotted as a histogram (Figure 4). Changes in gain produced important alteration in the histogram, causing an upward shift in the curve when the gain was increased and a downward shift when it was decreased. These alterations were more apparent at the lowest values of fluorescence (Figure 4B). Although changes in the PMT offset caused similar alterations in the histograms, the displacement of the curve was apparent only at values of fluorescence lower than 75, which has been determined to be intensities below background (Figure 4A).
Effect of Different QAPB Concentrations on the Histogram of Voxel Intensities
Increasing concentrations of QAPB (10-500 nM) produced progressively brighter images (Figure 5A). Increasing concentrations of QAPB produced histograms whose tails moved rightward with increasing concentration, indicating binding-induced fluorescence (Figure 5B). For clarity, the data are also presented in histogram format (Figure 5C). This demonstrates that binding of 500 nM QAPB results in a greater number of bright voxels in the range 101–200 and fewer dark voxels (range, 0-100).
Specific QAPB Binding Studies
Segments of WT aorta were incubated in fresh PSS for 3 hr and visualized to construct an autofluorescence histogram (Figure 6). Alternatively, aortic segments were incubated with 50 nM QAPB for 2 hr before visualization. To assess nonspecific binding, tissues were preincubated in 10 μM phenoxybenzamine for 1 hr before QAPB (50 nM) incubation. Phenoxybenzamine caused a decrease in the tissue fluorescence and thus in the QAPB binding in the aorta from the control mice (Figure 6A). This was reflected in the histogram position as a leftward shift toward the curve for autofluorescence (Figure 6B) and in the segmented (bins) histogram (Figure 6C) as a decrease in the number of the bright voxels in the range 101-200. These specific QAPB binding studies were done in both KO mice with similar results (not shown).

. (A) Rat 1 fibroblasts expressing α1D-ARs labeled with primary and secondary fluorescent (rhodamine conjugated) antibodies indicate the distribution of receptors in both intracellular and cell surface locations. (B) The same cell shown in (A), preincubated with 30 nM QAPB (fluorescent α1-AR antagonist), shows binding sites for the ligand. (C) Schematic diagram of vessel preparation: Segments of aorta were cut open and mounted endothelial side up (as shown) on a glass slide and covered with a coverslip (No. 1.5 for confocal microscopy). A confocal z series was then collected and stored for later off-line analysis. The image volume shown is rendered for viewing in Amira and is representative of the multiple volumes collected.
Effect of Knocking Out α1-Adrenoceptor Subtypes on Binding and the Fluorescence Intensity Histogram
WT and α1B-KO curves were close and partly overlapping. However, there was slightly greater fluorescence in the α1B-KO, which correlates with the greater maximum response in this strain. A leftward shift (compared with control) was observed for the α1D-KO mouse aorta (Figure 7A) indicating a reduction in fluorescence and thus in QAPB binding in the medial layer. This is consistent with the functional data (Figure 1) and a reduced number of binding sites in the α1D-KO aorta. The segmented (bins) histogram shows a significantly greater number of dark (0-100) and few low-range (101-150) voxels in the α1D-KO data compared with WT or α1B-KO (Figure 7B).

. QAPB binding (50 nM) to segments of mouse aorta from WT (A and D), α1B-KO (B and E), and α1D-KO (C and F). The images in the bottom panels have been equalized by adjusting the brightness and contrast such that the less intense fluorescence of the α1D-KO can be seen for comparison. Each image is an extended focus view (a composite) of the complete z series.
Discussion
Interest in the pharmacology of the mouse vasculature has become more focused in recent years due to the increasing availability of genetically altered mouse strains. In particular, the use of AR-KO mice has attracted much attention. The interest in genetic mouse models is, in part, driven by the lack of suitable selective agonists and antagonists for the three α1-AR subtypes. Therefore, clean “pharmacological” dissection of functional responses involving multiple subtypes is problematic.
Our own work has confirmed that larger arteries (e.g., aorta and carotid) express mainly α1D-ARs, whereas the smaller arteries (e.g., tail and mesenteric) express mainly α1A-ARs [7]. However, through the use of KO mice, all three α1 subtypes are now implicated in the control of blood pressure [9,10,12]. The results of these and other studies do not clarify the situation but instead illustrate that knocking out one receptor type does not necessarily simplify the observed pharmacological response.
With respect to aorta, it has been shown in rat that α1D-AR-mediated responses are strain dependent, being greater in Wistar Kyoto and spontaneously hypertensive rats compared with the Wistar strain [14]. However, it was not possible to determine, from this study, whether increased responses were due to greater receptor number or alterations in receptor coupling. Recently, radioligand binding using [3H]prazosin was used to determine α1-AR number and subtype in rat intact arterial segments [15]. These workers showed the coexistence of α1A- and α1B-ARs in tail artery and coexistence of α1D and α1B in aorta. It was noted that nonspecific binding was much higher in the more elastic aorta compared with tail artery. Earlier work investigating the binding of [3H]prazosin to blood vessels confirmed the peripheral target of its antihypertensive effect [16,17]. However, autoradiography does not provide sufficient resolution to investigate cellular distribution of receptors. We believe that fluorescent ligands are a better alternative.
There are several fluorescence-based methodologies that can be used for studying receptors (see Ref. [18] for a review), although we prefer the advantages offered by the use of fluorescent ligands [8], in particular, the ability to use the fluorescent antagonist under equilibrium conditions (i.e., no washing) and at relatively low concentrations to maintain selectivity. We hypothesized that the binding of a fluorescent α1 antagonist (QAPB) should be both concentration dependent and altered in a tissue that is lacking its major subtype. Thus, the aim of the present study was to establish conditions and methodology, which would enable the efficient assessment of fluorescent ligand binding in thick sections of aorta. This required a means of graphically displaying the binding of QAPB.
Functional studies confirmed that the α1D-AR is the predominant subtype in mouse aorta since the CRC for phenylephrine in α1D-KO aorta lay to the right of that for WT and α1B-KO aorta. In agreement with previous work [11], this suggests that there is a reduced number of α1-ARs in the α1D-KO aorta. However, it is possible that upregulation of other subtypes may compensate for the loss of the α1D. It was therefore of interest to compare the relative density of α1-ARs in normal, α1B-KO, and α1D-KO aortic smooth muscle. Because ligand binding using radiolabeled compounds is problematic in thick tissues, we devised a method using a fluorescent ligand.
The large number of branches arising from the aorta makes it almost impossible to pressure fix once it is isolated from the mouse. It is also difficult to work with a completely unpressurized aorta because the folded nature of the autofluorescent lamina obscures the ligand-binding-induced fluorescence. Therefore, we fixed the aorta segments on an 18-gauge needle, which preserved the natural shape and kept the internal elastic lamina running smoothly in a circular direction. This made it easy to focus past the internal elastic lamina such that the fluorescence observed emanated only from the smooth muscle.

Histogram of intensities within the fluorescent volume of focal check fluorescent microspheres for different settings of PMT offset (A) or gain (B) expressed in logarithmic scale. The starting settings for laser and PMT offset and gain are 36-74-1650, respectively (▪), and then either the PMT offset (A) or the gain (B) was adjusted as indicated in the figure.
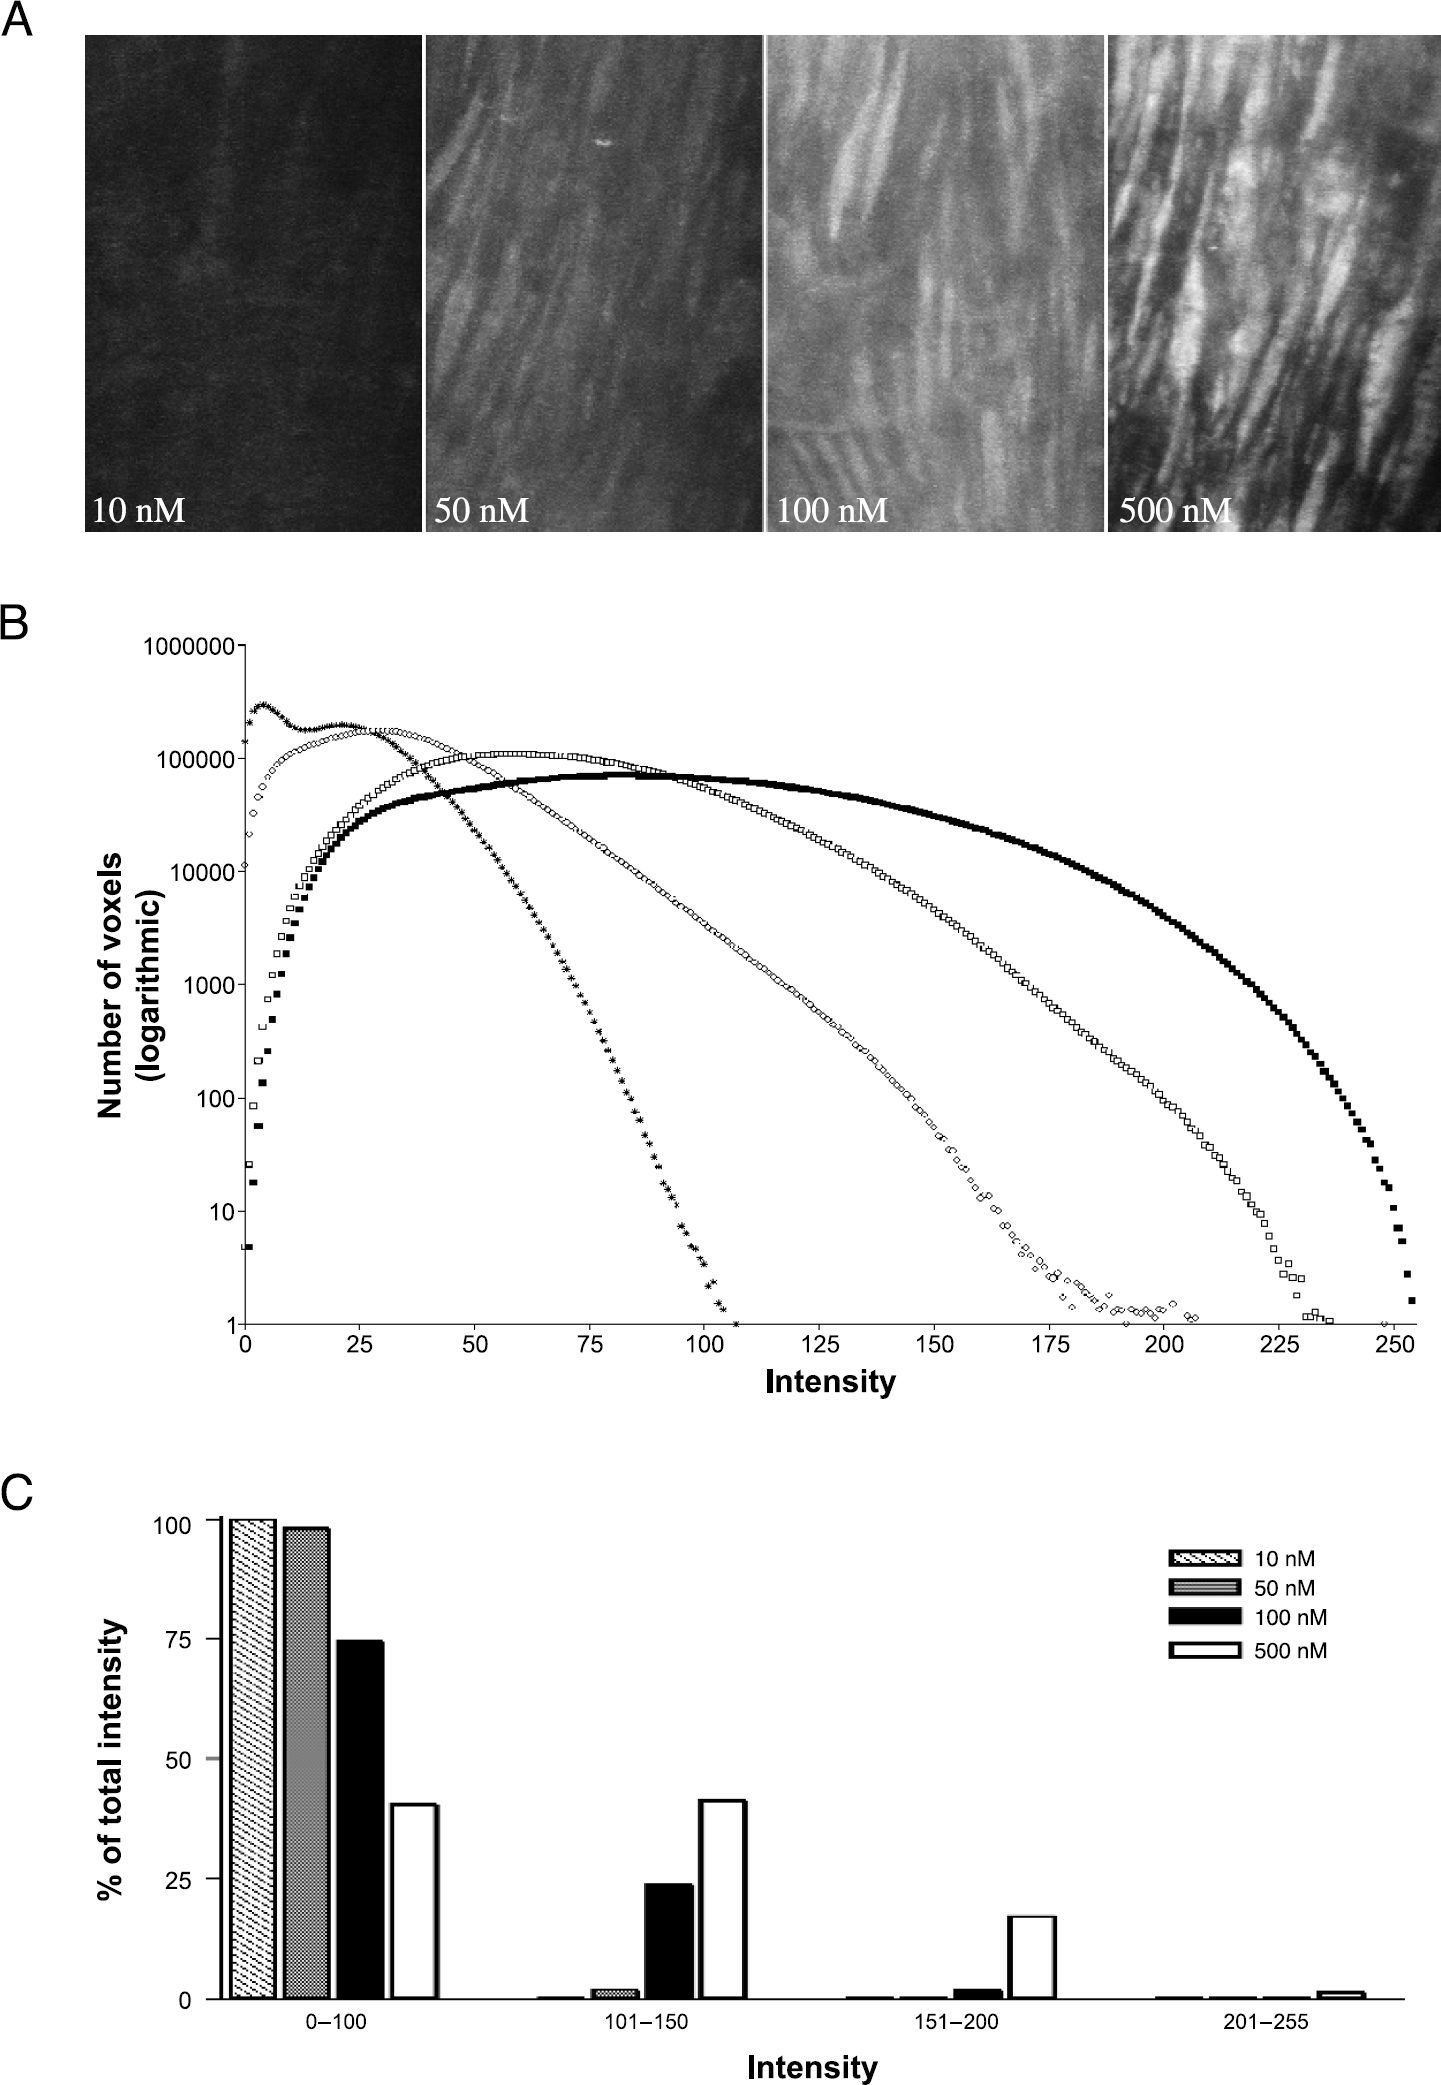
(A) Maximum intensity projection of z series collected from WT mouse aorta incubated with increasing concentrations of QAPB. (B) The histogram for each QAPB concentration represents the mean of the histograms of multiple z series collected from the multiple samples. (*) 10 nM, (○) 50 nM, (□) 100 nM, (▪) 500 nM. (C) Bar graph representing the percentage of the total intensity that corresponds to a range of fluorescent intensity values. The first one (0-100) is considered background. Data sizes: 10 nM (17 z series from n =3, 130.56 Mb); 50 nM (22 z, n =3, 168.96 Mb); 100 nM (17 z, n =3, 130.56 Mb); 500 nM (20 z, n = 2, 153.6 Mb). Total image data =583.68 Mb. Laser power and PMT gain are maintained the same for all the z series and they are 86 and 2150, respectively. The PMT offset was adjusted within the range 74-124.
The aorta segments were scanned using confocal microscopy, which enables the capture of a z series of images. Each individual image (512 × 512 pixels; 8-bit depth) is 256K in size and so each image volume (30 images) is 7.68 Mb. Taking our Figure 7 as an example, the histogram shown for the binding of 50 nM QAPB is the average of 52 z series taken from seven different mice. The total size of the data for that one histogram is almost 400 Mb. This illustrates the need for a convenient way to present large-scale image data in a graphical fashion.
The variability that exists among individual z series (which are only ~3000-μm3 volumes) makes it necessary to collect and average large quantities of data. This is analogous to the collection of multiple tissue samples or cells for ligand binding. However, visual inspection of 30–50 volumes of image data is not feasible on a slice-by-slice basis. Even building individual volumes of data for comparison does not help because we have yet to establish how representative of the entire vessel a single confocal volume is.

(A) Maximum intensity projection of z series collected from WT mouse aorta control (autofluorescence) and incubated with 50 nM of QAPB or 50 nM QAPB in the presence of 10 μM phenoxybenzamine. (B) Average intensity histograms of WT aorta for autofluorescence (○), 50 nM QAPB binding (*), and QAPB in the presence of 10 μM phenoxybenzamine (□). The autofluorescence histogram was generated by averaging 24 z series from four different mouse aorta segments not exposed to QAPB. The QAPB histogram is an average of 33 z series from four mice. The phenoxybenzamine treated segments histogram is of 24 z series from four mouse aortae. (C) Bar graph representing the percentage of the total intensity that corresponds to a range of fluorescent intensity values. The first one (0-100) is considered background. Data sizes: autofluorescence curve (24 z, n =4, 184.32 Mb); QAPB (33 z, n = 4, 253.44 Mb); phenoxybenzamine (24 z, n =4, 184.32 Mb). Total image data = 622.08 Mb. Laser-offset-gain settings are maintained constant for all the z series and the values are 86-114-2550, respectively.

(A) QAPB (50 nM)-induced intensity histograms of WT (.), α1B-KO (□), and α1D-KO (○) aorta. (B) Bar graph representing the percentage of the total intensity that corresponds to a range of fluorescent intensity values. The first one (0-100) is considered background. *p < .05, ***p < .001 versus WT. Data sizes: WT aorta (52 z, n=7); α1B-KO (38 z, n =4); α1D-KO (21 z, n =3). Total data size =852.48 Mb. Laser-offset-gain settings are maintained constant for all the z series and the values are 86-114-2550, respectively.
A major aim of this study was to devise a method of graphically displaying the intensity data collected from multiple image volumes. Simply averaging and plotting the distribution of voxel intensities provides curves whose position on the plot are relative to the amount of fluorescence (Figures 5B, 6B, and 7A). Grouping data into “bins,” representing low to high ranges, facilitates further understanding of the intensity distribution (Figures 5C, 6C, and 7B). Furthermore, where applicable, statistical tests can be applied to the binned data to strengthen the analysis (Figure 7B). However, we believe that the full plot of all data (Figure 7A) is sufficient to acquire an understanding of the full data set.
An alternative way to view the data is through the use of pseudocolor in which intensities are assigned specific colors (rather than gray levels) to aid visualization of intensity distribution and hotspots (Figure 8A). Pseudocolor or multicolor imaging can also be useful for identification of receptor location, with respect to other cellular structures. High-resolution imaging of QAPB binding at 50 nM revealed hotspots of binding often associated with the nuclear position (Figure 8B–D) or elastic lamina (Figure 8E and F). We believe that this may give clues to the regulatory functions of adrenoceptors, where cellular location may indicate the relative role of the adrenoceptors in vascular cell growth and vessel matrix organization.
Our results show that QAPB-induced fluorescence is concentration dependent and can be inhibited in the presence of a nonfluorescent α1-antagonist. The images in Figure 5 show the pattern of binding at different concentrations. It should be noted that these are single images and are displayed as an example of the binding. It was not possible, in this study, to examine the cellular distribution of receptor subtypes or even the cellular heterogeneity. The important first stage was to demonstrate that QAPB acts as a reliable fluorescent α1-antagonist and that the method is sensitive enough to detect differences in genetically modified tissues. Figure 3 shows an example of WT, α1B-KO, and α1D-KO binding. Figure 3C, D, and E have been equalized to show the binding patterns on the tissue. The α1D-KO tissue does still exhibit binding, but it is generally much fainter than the controls (Figures 3 and 7).

Distribution of QAPB binding in mouse aortic smooth muscle cells. (A) Pseudocolored images previously shown in Figure 5A. The look-up table (LUT) on the far left shows the color map used, where red represents 0 intensity value pixels (black on a gray LUT) and purple-white represents the high-intensity pixels. As the concentration of QAPB (and thus fluorescence) increases so too does the number of blue-purple pixels appearing in the image. (B-D) Dual staining of aorta sections where cell nuclei are stained blue (Syto 62, 5 μM) and QAPB (50 nM) is shown in red. Clusters of receptors can be seen close to the position of the smooth muscle cell nuclei. (E) View of a transverse (cross) section of a segment of mouse aorta. Concentric rings of elastic lamina are shown in green (autofluorescence) with smooth muscle cell nuclei (blue) positioned between the layers of lamina. QAPB (50 nM) binding was apparent at the lamina. (F) Higher magnification view of (E) shows QAPB binding along both edges of the elastic lamina and is consistent with cell surface binding at points on the membrane close to (or attached to) the elastic lamina.
We would therefore advise against drawing any firm conclusions regarding amount of fluorescence when the image has been processed because it could be misleading, as is shown in Figure 3. The processed images (Figure 3, bottom panels), when used for comparative purposes, do not show any marked differences. However, in the nonprocessed images (Figure 3, top panels) it can be seen that the α1DKO exhibits lower binding-induced fluorescence than α1B-KO or WT. When the total (50 nM QAPB) fluorescence is measured, averaged, and plotted a leftward shift was observed for the α1D-KO mouse aorta (Figure 7).
One possible limitation of our study has been the need to use 8-bit image depth. This image depth only provides for intensity measurements in the range 0-255. Therefore, in our study of ligand concentration-dependent fluorescence, it was necessary to alter the offset of the PMT for each concentration to ensure that no pixel had a value outside the 8-bit range. However, in all other experiments we were careful to maintain equal parameters. Ideally, future experiments will employ 12-bit or greater image depth. Alternative methods for working with 8-bit images should also be explored, such as calculating arithmetic averages for image sets collected under varying parameters.
We have shown, for the first time, that a fluorescent antagonist ligand can be used on whole-mount tissues in a manner analogous to radioligand binding. Binding is performed at equilibrium without washing and does not involve the use of hazardous material. In addition, we show that multiple data volumes can be analyzed quickly and averaged to produce histograms whose relative positions indicate the amount of binding within the volumes. We believe that this type of microscope-based image analysis and quantification can be used to complement functional studies and will be of particular benefit to users of multiphoton microscopy in which the depth penetration is two to three times greater than that for confocal microscopy and that z resolution with the multiphoton microscopy will be also far superior to that which was available to us during this study.
Footnotes
Acknowledgments
We thank Tenovus Scotland for the support given. Raquel Miguel studied in Glasgow as a part of the support received from Ministerio de Educacion, Cultura y Deporte of Spain. Z. Ali is funded by Medical Research Council. This research has been supported by a Marie Curie Fellowship of the European Community program Quality of Life under contract number QLRI-CT-2000-60058-15. Raquel Miquel and Venessa Segura are Marie Curie fellows.