
Abstract
In vivo optical imaging is potentially useful for evaluating the presence of tumor markers that are targets of molecular medicine. Here we report the synthesis and characterization of integrin αvβ3-targeted peptide cyclo(Lys–Arg–Gly–Asp–Phe) [c(KRGDf)] labeled with fluorescence dyes with wavelength spanning from the visible/near infrared (Cy5.5) to the true near infrared (IRDye800) for optical imaging. In vitro, the peptide–dye conjugates bound specifically to tumor cells expressing αvβ3. When administered intravenously into mice at a dose of 6 nmol/mouse, the conjugates accumulated in tumors expressing αvβ3. The tumor-to-background ratios for human KS1767 Kaposi's sarcoma in mice injected with Cy5.5–c(KRGDf) and Cy5.5 were 5.5 and 1.5, respectively. Preinjection of c(KRGDf) blocked the uptake of Cy5.5–c(KRGDf) in tumors by 89%. In αvβ3-positive M21 and αvβ3-negative M21-L human melanoma, fluorescence intensity in the tumor of mice injected with IRDye800–c(KRGDf) was 2.3 and 1.3 times that in normal tissue, respectively. Dynamic imaging revealed that Cy5.5–c(KRGDf) was rapidly taken up by KS1767 tumor immediately after bolus injection. The rate of its uptake in the tumor was reduced by preinjection of c(KRGDf) in an interval time-dependent manner. Our data suggest that near-infrared fluorescence imaging may be applied to the detection of tumors expressing integrin αvβ3 and to the assessment of the optimal biological dose and schedule of targeted therapies.
Introduction
Integrins are heterodimeric transmembrane proteins that function principally as receptors for spatially restricted extracellular ligands [1]. Structurally, integrins are composed of noncovalently bound α and β subunits, the N-terminal domains of which combine to form a ligand-binding site [2,3]. Previous data suggest that integrins, particularly integrin αvβ3, play an important role in tumor progression, angiogenesis, and metastasis [4–6]. For example, in human melanoma, the expression of αvβ3 was correlated positively with tumor thickness, which is the single most powerful currently known predictor of survival [7,8]. Integrin αvβ3 is expressed by newly formed tumor microvessels but not by preexisting vessels or by blood vessels in nonneoplastic tissues [6,9,10]. Angiogenesis initiated by basic fibroblast growth factor can be inhibited by an anti-αvβ3 antibody [11]. Integrin αvβ3 binds factors such as vitronectin that contain the amino acid sequence Arg–Gly–Asp (RGD), and this binding appears to be critical in mediating the ligation signal, allowing endothelial cells to attach to the extracellular matrix and thus supporting endothelial survival and growth [6,9,12]. The important role of αvβ3 in tumor angiogenesis and metastasis suggests that integrins can be an excellent diagnostic and therapeutic target in cancer.
Imaging methods that could noninvasively and repeatedly measure integrin expression and integrin activity would be useful in characterizing tumors and monitoring responses to therapeutic agents targeted at integrins. Several previous studies have validated the αvβ3 integrin as a viable target for imaging. Gamma scintigraphy, single-photon emission computed tomography (SPECT), and positron emission tomography (PET) with several radiolabeled peptides containing the RGD motif have been successfully used to measure αvβ3 integrin expression [13–17]. Haubner et al. [13] reported the biodistribution of 125I-labeled 3-iodo-tyrcyclo(Arg–Gly–Asp–Tyr–Val) and showed that the radioligand exhibited high affinity and selectivity for the αvβ3 integrin. The same group later developed an 18F-labeled RGD-containing glycopeptide for noninvasive imaging of αvβ3 integrin expression using PET [14]. The cyclic pentapeptide, c(KRGDf), used in their study contained d-Phe, which is believed to be responsible for the αvβ3 binding selectivity. Attempts have also been made to optimize the pharmacokinetics of radiotracers through the use of polyethylene glycol, which yielded lower kidney uptake and good tumor-to-background ratio without compromising the imaging agent's receptor-binding ability [18]. Paramagnetic contrast agents based on liposomes or nanoparticles targeted at integrin αvβ3 for magnetic resonance imaging have also been reported [19,20].
Optical imaging has a number of advantages over radionuclide-based functional imaging techniques. Optical imaging is relatively inexpensive, the optical imaging probes can be stored, and the radioactivity is not a concern. Furthermore, because a fluorophore is not annihilated upon radiation emission as is a radiotracer, there is potentially greater signal available for imaging. In addition, owing to relatively low tissue absorbance and minimal autofluorescence, near-infrared (NIR) light (700–900 nm wavelength) can penetrate several centimeters of tissue without the harmful radiation effects of gamma rays, X-rays, or ultraviolet light [21]. Fluorescence contrast-enhanced optical imaging has been used in studies of small animal [21–28], and optical tomography is currently under development [29,30]. Here we report what we believe to be the first study of static and dynamic NIR optical imaging of integrin αvβ3 in human xenograft tumor models using imaging probes containing RGD peptide and fluorescent dyes spanning from the visible/NIR (Cy5.5) to the true NIR (IRDye800).
Materials and Methods
Materials
All Na-Fmoc-amino acids, 1-hydroxybenzotriazole, benzotriazol-1-yl-oxy-tris-pyrrolidino-phosphonium hexaflurophosphate (PyBOP), and solid support linker [4-(4-hydoxymethyl-3-methoxyphenoxy)butyric acid] (HMPB) were purchased from Novabiochem (San Diego, CA). Trifluoroacetic acid (TFA) was obtained from Chem-Impex International (Wood Dale, IL). PL-DMA resin was purchased from Polymer Laboratories (Amherst, MA). 4-Dimethamino-pyridin, ammonium acetate (NH4OAc), 1,3-diisopropylcarbodiimide, ethylenediamine, N-hydroxysuccinimide, N,N-diisopropylethylamine (DIPEA), and triethylsilane were purchased from Aldrich Chemical (St. Louis, MO). Monofunctional hydroxysuccinimide ester of Cy5.5 dye (Cy5.5-NHS) was purchased from Amersham Biosciences (Piscataway, NJ). Monofunctional hydroxysuccinimide ester of indocyanine green derivative, IRDye800-NHS, was obtained from Li-Cor (Lincoln, NE). All solvents were purchased from VWR (San Dimas, CA).
Analytical Methods
Analytical high-performance liquid chromatography (HPLC) was carried out on an Agilent 1100 system (Wilmington, DE) equipped with a Vydac peptide and protein analytic C-18 column (Anaheim, CA). Preparative HPLC was carried out on a Rainin Rabbit HP system (Walnut Creek, CA) equipped with a 25 × 5.5 cm Vydac C-18 column. Matrix-assisted laser desorption ionization (MALDI) mass spectrometry was performed in the proteomics laboratory in the Department of Molecular Pathology at The University of Texas M. D. Anderson Cancer Center (Houston, TX). Fluorescence spectra were obtained on a Fluorolog-3 fluorometer (Jobin Yvon, Edison, NJ).
Synthesis of Cyclic Peptides
Cyclo(Lys–Arg–Gly–Asp–phe) [c(KRGDf)] was synthesized on linker-PL-DMA resin using Fmoc solid phase chemistry. Briefly, HMPB (3 eq) was attached to PL-DMA resin that had been treated with ethylenediamine overnight. Peptide was cleaved from the support with 1% TFA in dichloromethane with all side-chain protecting groups intact. The head-to-tail cyclization was then carried out in dichloromethane using PyBOP (3 eq), 1-hydroxybenzotriazole (3 eq), and DIPEA (6 eq) as coupling agents. After removal of all solvents, the residues were dissolved in ethyl acetate and washed with 5% NaHCO3, 2% KHSO4, and brine. All side-chain protecting groups were deprotected in TFA/H2O/triethylsilane (95/1/4, v/v/v). The control peptide Ac-Ala-c(Cys–Asn–Gly–Arg–Cys)–Gly [Ac-A-c(CNGRC)G] was similarly synthesized. The products were purified by reverse-phase HPLC, eluted with H2O/acetonitrile containing 0.1% TFA, and validated by analytic HPLC and MALDI mass spectrometry.
Conjugation of Cy5.5 and IRDye800 to c(KRGDf)
To conjugate dyes with c(KRGDf), a solution of Cy5.5-NHS (1 eq) or IRDye800-NHS (1 eq) and c(KRGDf) (1.3 eq) in dimethylformamide/DIPEA (10/1, v/v) was stirred at room temperature overnight. After solvent was removed under vacuum, the compound was purified by reverse-phase HPLC, eluted with a 0.01 M solution of NH4OAc in water and acetonitrile, and lyophilized. The products were validated by analytic HPLC and MALDI mass spectrometry.
Cell Lines
Kaposi's sarcoma KS1767 cells, which express αvβ3, were provided by Dr. Renata Pasqualini (M. D. Anderson Cancer Center). Human melanoma M21 cells, which express integrin αvβ3, and M21-L cells, which do not express integrin αvβ3, were obtained from Dr. David Cheresh (The Scripps Research Institute, La Jolla, CA). Cells were maintained at 37°C in a humidified atmosphere containing 5% CO2 in Dulbecco's modified Eagle's medium and nutrient mixture F-12 Ham (DMEM/F-12) containing 10% fetal bovine serum (GIBCO, Grand Island, NY).
Fluorescence Microscopy
KS1767 cells were seeded on cover slips in 24-well plates (Becton Dickinson Labware, Franklin Lakes, NJ) and incubated in DMEM/F-12 culture medium (0.5 mL/well) overnight. Cy5.5–c(KRGDf) was added into each well at a concentration of 6 μM. For the blocking study, unconjugated cyclic peptide c(KRGDf) (600 μM) was added to the culture medium 1 hr before the addition of Cy5.5–c(KRGDf). Cells were washed twice with phosphate-buffered saline and incubated in a solution of Sytox Green in 95% ethyl alcohol (1 μM, Molecular Probes, Eugene, OR) for 15 min to fix and stain cell nuclei. Cells were washed again with phosphate-buffered saline, and the cover slips were mounted for microscopic examination using a DMR microscope (Leica Microsystems, Bannockburn, IL). The microscope was equipped with a 75-W Xenon lamp, 775 nm/845 nm, 560 nm/645 nm, and 480 nm/535 nm (excitation/emission) filters (Chroma Technology, Brattleboro, VT), a Hamamatsu black and white chilled charge-coupled device camera (Hamamatsu Photonics K.K., Hamamatsu City, Japan), and Image-Pro Plus 4.5.1 software (Media Cybernetics, Silver Spring, MD). Cy5.5 was pseudocolored red, and Sytox Green was green.
Cell Adhesion Assay
KS1767 cells were seeded in DMEM/F-12 culture medium supplemented with 10% fetal bovine serum for 24 hr. Cells (1 × 10⁵) with different concentrations of c(KRGDf), Cy5.5–c(KRGDf), IRDye800–c(KRGDf), or Ac-A–c(CNGRC)G were added to vitronectin-coated microtiter wells under serum-free conditions and incubated at 37°C for 1 hr. After washing steps, the bound cells were stained with 5% crystal violet, and then 0.1 M HCl was added to each well. The concentrations of crystal violet were determined by UV/Vis absorption at 627 nm. IC50 values were estimated from the dose–activity curves.
In Vivo Optical Imaging
Four- to six-week-old athymic nude mice (18–22 g, Harlan Sprague Dawley, Indianapolis, IN) were housed five per cage and fed with sterilized pellet chow (Harlan Sprague Dawley) and sterilized water. Animals were maintained in a pathogen-free mouse colony in the Department of Veterinary Medicine at M. D. Anderson. All experiments were performed in accordance with the guidelines of the Institutional Animal Care and Use Committee. KS1767, M21, or M21-L cells (1–2 × 10⁶ cells/site) were implanted subcutaneously into the chest wall or the hind legs of each mouse. Imaging studies were performed when tumors reached 4–6 mm in average diameter.
In vivo fluorescence imaging was accomplished by illuminating the animal with light from a laser diode (35 mW) expanded to an approximately 8-cm-diameter circular area. The re-emitted fluorescent light was collected by an image intensifier (model FS9910C, ITT Night Vision, Roanoke, VA) lens-coupled to a charge-coupled device camera (model CH350, Photometrics, Tucson, AZ). The imaging was designed so that the field of view could be varied from 3 × 3 cm to 12 × 12 cm by varying the 28- to 85-mm zoom lens used to focus the image onto the photocathode of the intensifier. The lens was fitted with a holographic notch-plus filter (660-nm center wavelength for Cy5.5, 780-nm center wavelength for IRDye800; Kaiser Optical Systems, Ann Arbor, MI) and a bandpass filter (710-nm center wavelength for Cy5.5, 830-nm center wavelength for IRDye800) to reject backscattered and reflected excitation photons. Image acquisition was accomplished using V+ + software (Digital Optics, Auckland, New Zealand), and the obtained images were stored in uncompressed tagged image file format. Data processing and analysis was accomplished using Matlab software (The MathWorks, Natick, MA). For all imaging sessions, the acquisition parameters were kept constant. The integration time for each image was 800 msec. For quantitative comparison of uptake of NIR dyes in the tumor and normal tissue, region of interest (ROI) was selected in the tumor and muscle areas and fluorescence intensity in each ROI was measured. Three to nine mice were used in each group to derive the quantitative data. Statistical comparisons were made using the Student's t test with p #x003C; .05 considered to be statistically significant.
For dynamic in vivo fluorescence imaging, groups of mice consisted of three mice each were anesthetized with pentobarbital (50 mg/kg ip), and a catheter was placed in the tail vein for intravenous injection of each NIR dye. A white-light image of the animal was obtained using a low-power lamp as a white-light source with holographic and interference filters removed. Fluorescence images were then acquired as a function of time following administration of Cy5.5 (6 nmol/mouse) or Cy5.5–c(KRGDf) (6 nmol/mouse). For the blocking study, c(KRGDf) (600 nmol/mouse) was injected intravenously 1 and 24 hr before the injection of Cy5.5–c(KRGDf). Images were obtained every 6 sec for up to 20 min following injection of each contrast agent. Each mouse was imaged again 24 hr after contrast agent injection. Two ROIs were selected for quantitative analyses. One ROI was located entirely within the circumference of the tumor, and the other, of approximately equivalent size, was a symmetric region of normal tissue located opposite the tumor. Using Matlab software, the mean of the fluorescence intensity within each ROI was computed for every fluorescence image acquired. These data were then used to generate curves of mean fluorescence intensity versus time for each imaging study.
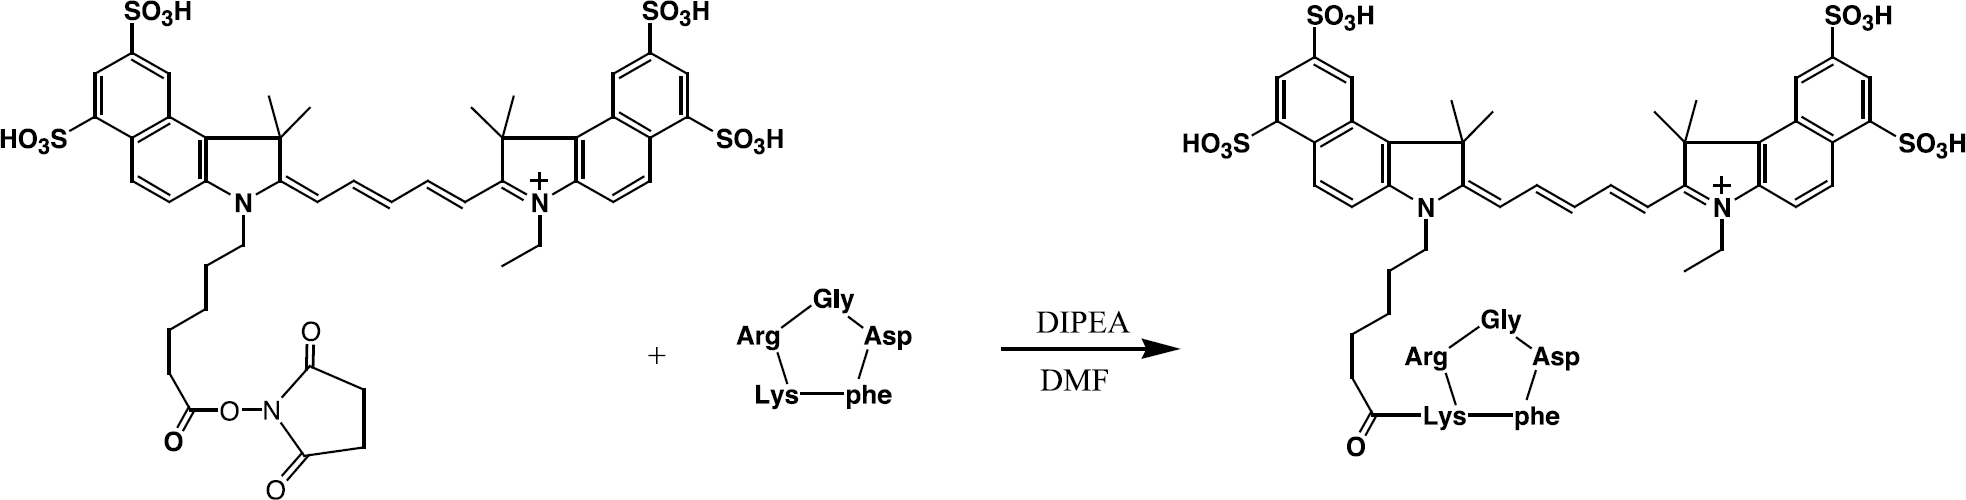
Synthesis scheme for Cy5.5–c(KRGDf) conjugate.
Results
Synthesis and Characterization of RGD–Dye Conjugates
To explore the feasibility of optical imaging of integrins, we conjugated the cyclic RGD pentapeptide c(KRGDf) to either Cy5.5 (excitation/emission, 675/694 nm) or IRDye800 (765/792 nm) via an NHS activated ester (Figure 1). Two fluorescence dyes were used to examine whether replacing one dye with the other in the dye–peptide conjugate would adversely affect their biopotency. Most optical imaging studies reported in the literature used Cy5.5 as the fluorophore, whereas the use of IRDye800 is advantageous if clinical applications are intended because the dye has a longer emission wavelength than Cy5.5 and therefore light emitted from IRDye800 is more transparent to tissue than from Cy5.5. c(KRGDf) was synthesized on a solid support using Fmoc chemistry. The resulting peptide was cleaved from the support, and the head-to-tail cyclization was then carried out in solution. Each NIR dye was conjugated to the peptide by means of NHS activated ester after removal of the side-chain protection groups from the peptide. The HPLC and MALDI mass spectrometry characteristics of the peptide and its conjugates are summarized in Table 1.
In Vitro Binding of RGD-Dye Conjugates to Tumor Cells Expressing Integrin αvβ3
Figure 2A shows fluorescence microscopic images of KS1767 cells incubated with Cy5.5–c(KRGDf) and with an excess of c(KRGDf) followed by Cy5.5–c(KRGDf). Cy5.5–c(KRGDf) bound to KS1767 cells, and its binding could be partially blocked by c(KRGDf) (Figure 2A). The biological activity of both RGD conjugates was compared to that of the unconjugated RGD peptide using the cell adhesion assay. As shown in Figure 2B, Cy5.5–c(KRGDf), IRDye800–c(KRGDf), and c(KRGDf) inhibited adhesion of KS1767 cells to vitronectin-coated microplate wells in a dose-dependent manner. In contrast, a control cyclic pentapeptide, Ac-A-c(CNGRC)G, failed to show significant anti-adhesion activity even at the highest dose tested (Figure 2B). The IC50 values for Cy5.5–c(KRGDf), IRDye800–c(KRGDf), and c(KRGDf) were estimated to be 1.11, 2.58, and 2.47 μM, respectively.
HPLC and MALDI Mass Spectrometry Characteristics of the RGD Peptide and its Conjugates
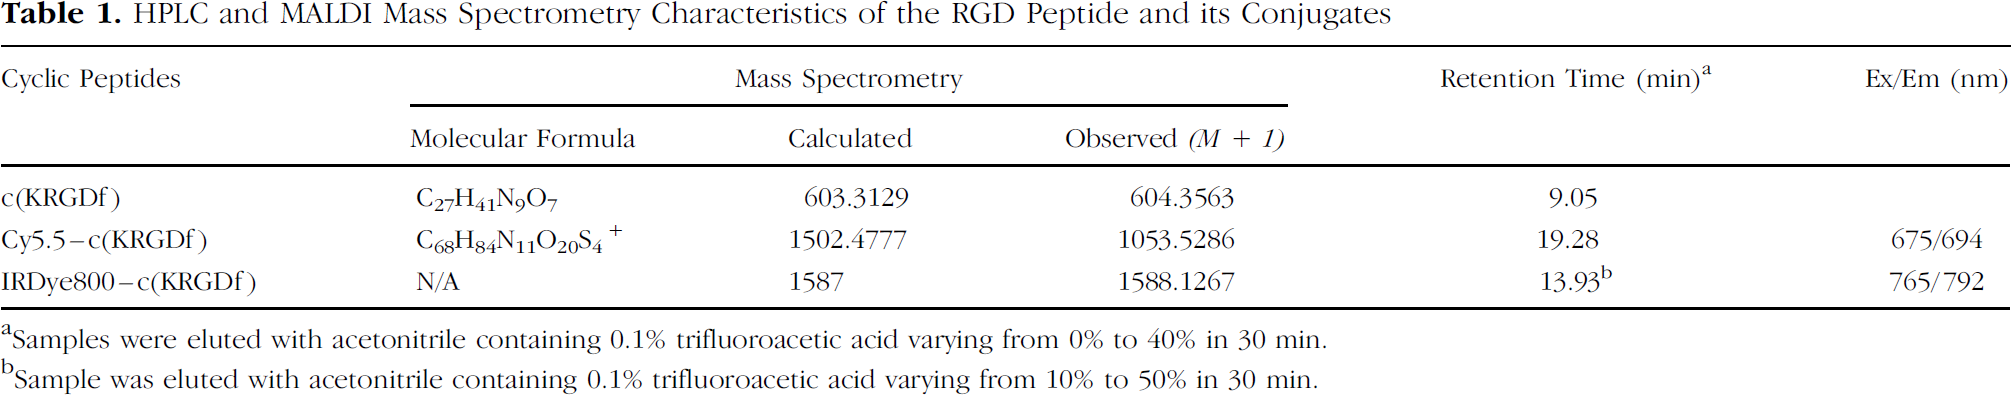
Samples were eluted with acetonitrile containing 0.1% trifluoroacetic acid varying from 0% to 40% in 30 min.
Sample was eluted with acetonitrile containing 0.1% trifluoroacetic acid varying from 10% to 50% in 30 min.

(A) Binding of Cy5.5–c(KRGDf) to KS1767 cells. Cells were incubated with Cy5.5–c(KRGDf) (6 μM) for 10 min or with c(KRGDf) (600 μM) for 1 hr followed by c(KRGDf)–Cy5.5 (6 μM) for 10 min. Red: Cy5.5 dye; Green: Sytox Green-labeled cell nuclei. Original magnification ×60. (B) Dose-dependent inhibition of adhesion of KS1767 cells to vitronectin-coated microplate wells by c(KRGDf) and its NIR dye conjugates. Ac-A-c(CNGRC)-G is a control cyclic pentapeptide that does not bind to integrin αvβ3. The data are presented as mean and standard error of mean from triplicate experiments.
In Vivo NIR Imaging
Representative in vivo NIR fluorescent images of KS1767 tumors are shown in Figure 3. Tumors were clearly visualized 24 hr after intravenous injection of Cy5.5–c(KRGDf). Injection of 100-fold molar excess of c(KRGDf) 1 hr before the administration of Cy5.5–c(KRGDf) blocked the uptake of Cy5.5–c(KRGDf) in KS1767 tumors by 89%. Cy5.5 alone did not have significant retention in the tumor (Figure 3). The average tumor-to-background ratios in mice injected with Cy5.5–c(KRGDf) and Cy5.5 were 5.5 and 1.5, respectively. Fluorescence microscopic images of excised tumor and muscle tissue immediately adjacent to the tumor confirmed that Cy5.5–c(KRGDf) was localized to the tumor and was not found in muscle cells (Figure 4).
Similar results were observed with IRDye800–c(KRGDf) in human melanoma xenograft models. Integrin-positive M21 melanomas, but not integrin-negative M21-L melanomas, were clearly visualized 24 hr after intravenous injection of IRDye800–c(KRGDf). IRDye800 itself did not have detectable signal in the same M21 tumors (Figure 5). The tumor-to-background ratios for IRDye800–c(KRGDf) in mice with M21 tumors and mice with M21-L tumors were 2.3 ± 0.29 (n = 9) and 1.3 ± 0.12 (n = 4), respectively. In contrast, the tumor-to-background ratios in mice injected with IRDye800 alone were 1.3 ± 0.27 in M21 tumor and 1.2 ± 0.16 in M21L tumor. The difference in tumor-to-background ratio between M21 tumor and M21-L tumor was highly significant in mice injected with IRDye800–c(KRGDf) (p #x003C; .0001), but was insignificant in mice injected with IRDye800 (p = .32).

Representative in vivo NIR fluorescent images of mice with subcutaneously implanted KS1767 tumors. Images were acquired 24 hr after intravenous injection of Cy5.5–c(KRGDf) (6 nmol/mouse) (left), c(KRGDf) (600 nmol/mouse) followed 1 hr later by Cy5.5–c(KRGDf) (middle), or Cy5.5 (6 nmol/mouse) (right). All images are normalized to the same scale. Arrows indicate tumors.

Ex vivo analysis of Cy5.5–c(KRGDf) distribution in a KS1767 tumor excised 48 hr after intravenous injection of the conjugate. Fluorescence microscopic images were obtained from sectioned tissues (6 μm thick). The same slide was also stained with hematoxylin – eosin. Red: Cy5.5–c(KRGDf); green: nuclei stained with Sytox Green. Original object magnification: × 10.
Dynamic Imaging
Profiles of fluorescence intensity as a function of time were obtained from dynamic imaging data (Figure 6). The circles in Figure 6A indicate the ROI for the tumor and for the normal muscle used to generate intensity values. The rate of uptake of Cy5.5–c(KRGDf) in KS1767 tumors was much faster than the rate of its uptake in muscle (Figure 6B and C). Preinjection of c(KRGDf) blocked the uptake of Cy5.5–c(KRGDf) in the tumor when the interval between the injections of these two agents was 1 hr. However, when the interval between the injections was increased to 24 hr, the rate of Cy5.5–c(KRGDf) uptake in the tumor was partially recovered.
Discussion
Although several targeted NIR imaging probes have been described and have shown promising imaging properties, there remain obstacles to the translation of optical imaging into clinical applications, chief among them is the limited availability of well-validated imaging agents and lack of Food and Drug Administration–approved instrumentation for measuring the NIR fluorescence signals. The purpose of this study was to develop imaging probes targeted to integrin αvβ3, an adhesion molecule that has been implicated in the progression, invasion, and metastasis of many solid tumors, including melanoma. Our data clearly demonstrated that conjugation of the cyclopentapeptide c(KRGDf) via its lysine residue with fluorescence dyes—Cy5.5 and IRDye800—did not significantly affect the in vitro and in vivo binding of the peptide to integrin αvβ3. Specific in vitro binding of Cy5.5–c(KRGDf) to αvβ3 was evidenced by its binding to αvβ3-expressing KS1767 cells and by blockage of its binding to KS1767 cells by free, unconjugated c(KRGDf) (Figure 2A). Interestingly, the fluorescent signal of Cy5.5–c(KRGDf) on the surface of tumor cells appeared to be polarized (Figure 2A). This is consistent with the role of integrins in cell mobility and their clustering to the focal contact-like structure [31]. The biopotency of Cy5.5–c(KRGDf) and IRDye800–c(KRGDf) was further confirmed by its ability to inhibit attachment of tumor cells to vitronectin-coated surfaces (Figure 2B). Cell attachment was inhibited because Cy5.5–c(KRGDf), IRDye800–c(KRGDf), and c(KRGDf) competed for the ligand-binding site of the cell-surface integrins. Taken together, our data suggest that Cy5.5–c(RKGDf) and IRDye800–c(KRGDf) selectively bound to integrin αvβ3 on the surface of tumors cells in vitro.

Representative fluorescence images obtained 24 hr after intravenous injection of IRDye800–c(KRGDf) (3 nmol/mouse) in mice bearing integrinpositive M21 melanoma and integrin-negative M21-L melanoma.

Dynamic imaging study performed in mice bearing KS1767 tumors. Animals were injected with Cy5.5–c(KRGDf) alone (6 nmol) (□) or with c(KRGDf) 1 hr (○) or 24 hr (♦) after the injection of unconjugated c(KRGDf) peptide (600 nmol). (A) Bright light image showing the ROI in the tumor and muscle areas. Fluorescence intensity versus time profiles were obtained from the tumor ROI (B) and the normal ROI (C) in one representative animal in each group. The symbols denote experimental measurements, while the solid line denotes the corresponding least-squares fit.
In vivo fluorescence imaging with Cy5.5–c(KRGDf) was accomplished by illuminating nude mice bearing subcutaneous KS1767 tumors with NIR light. Whereas almost no fluorescent signal was detected in the tumors of mice injected with Cy5.5, tumors in mice injected with Cy5.5–c(KRGDf) were clearly visualized (Figure 3). Pretreatment with c(KRGDf) blocked tumor uptake of Cy5.5–c(KRGDf). Moreover, fluorescent microscopic examination of excised tissues revealed association of NIR dye with vital tumor cells but not with adjacent muscle cells (Figure 4). These results indicate that Cy5.5–c(KRGDf) targeted KS1767 tumors in vivo and that its specific uptake in the tumor was mediated by integrin αvβ3.
For clinical use, it is preferable to have an NIR dye with longer wave number than Cy5.5 has in order to obtain NIR images with reduced background signals. For this reason, we replaced Cy5.5 with an indocyanine dye, IRDye800. Specific in vivo targeting of the resulting conjugate, IRDye800–c(KRGDf), to tumors expressing integrin αvβ3 was confirmed using melanoma xenograft models. IRDye800–c(KRGDf) localized to M21 tumors, which express integrin αvβ3, but not to M21-L tumors, which do not express αvβ3 (Figure 5). Because melanoma lesions are superficial and because the invasiveness of melanoma is closely related to the expression of αvβ3, we believe that opportunity exists for clinical application of planar as well as tomographic NIR optical imaging using IRDye800–c(KRGDf) as the targeted imaging probe.
We have previously used area detection and area illumination systems to obtain dynamic imaging data and to assess the pharmacokinetics of Cy5.5-labeled epidermal growth factor in tumors expressing epidermal growth factor receptor [27]. In this study, fluorescence imaging of mice bearing subcutaneous KS1767 tumors was performed immediately following bolus administration of Cy5.5–c(KRGDf). The time-dependent fluorescent intensity curves obtained over a period of 20 min clearly showed that Cy5.5–c(KRGDf) had a higher rate of uptake in the tumor than in the normal tissue and that preinjection with unconjugated c(KRGDf) 1 hr before the injection of Cy5.5–c(KRGDf) markedly suppressed the uptake of Cy5.5–c(KRGDf) in tumors (Figure 6). These results suggest that rapid dynamic imaging may provide valuable informative with regard to the specificity of target binding using targeted NIR imaging probes. Significantly, the rate of Cy5.5–c(KRGDf) uptake in the tumor was partially recovered when administration of the unconjugated c(KRGDf) peptide preceded the injection of Cy5.5–c(KRGDf) by 24 hr (Figure 6). On the basis of these data, one may speculate that the turnover of integrin αvβ3 expressed on the cell surface of KS1767 tumors occurs over a period of 24 hr. Thus, given dynamic imaging data obtained subsequent to the injection of the Cy5.5–c(KRGDf) at various intervals following the administration of the RGD peptide, it would be possible to experimentally determine the optimal interval and dose for therapy directed against integrin αvβ3. Quantitative analysis of the intensity–time curve obtained from dynamic imaging using an appropriate kinetic model may provide further insight regarding the binding affinity of the imaging probe to receptors, the receptor density in the tumor, and the receptor turnover rate. Studies along this line are currently in progress.
Although several well-characterized, radiolabeled probes comprising of RGD derivatives have been successfully developed for SPECT and PET [16,32–34], NIR probes targeted to integrin αvβ3 in specific and to other molecular markers in general will have clinical utility in a number of settings. Optical imaging can be used for intraoperative navigation (i.e., defining surgical margin and detection of residual disease) during surgical procedures owing to its ability to acquire real-time images. It can also be used to obtain dynamic imaging data in the same way as described in this work to interrogate the kinetics of receptor-mediated uptake of the optical probe in the diseased sites, as well as the modulation of probe uptake by targeted therapeutics. Each of the above scenarios would be difficult, if not impossible, to accommodate with nuclear imaging. Finally, because optical imaging affords better resolution and sensitivity than nuclear imaging for superficially localized disease, opportunity exists for optical imaging to detect lesions that would have been missed otherwise by nuclear imaging technique alone. Using a dual-labeled RGD imaging probe composed of both a radioisotope and an NIR dye, we have recently demonstrated that optical imaging is advantageous as compared to nuclear imaging in the detection of superficially localized tumors [35].
In summary, the ability to conduct fast fluorescence measurements at a low fluorophore dose level is one of the major advantages of NIR imaging. Using NIR dye conjugates with cyclic peptide targeted to αvβ3, we validated the targeting of the conjugates to tumors expressing integrin αvβ3 and demonstrated the feasibility of in vivo optical imaging of integrins. Our future studies will address characterization studies necessary for clinical translation, which include biodistribution, pharmacokinetics, and clearance of the imaging probe. With targeted therapeutics becoming more common alternatives for the treatment of cancer, there exists a need for a reliable technique capable of assessing the direct impact of such agents on the targets. Dynamic and delayed NIR imaging studies conducted using Cy5.5–c(KRGDf) suggest that NIR optical imaging may be one such in vivo technique.
Footnotes
Acknowledgments
We thank the National Institutes of Health (grants R01 EB00174 and U54 CA90810), Texas Higher Education Advanced Technology Program, and the John S. Dunn Foundation for financial support. We also thank Stephanie Deming for expert editorial assistance.