
Abstract
In vivo imaging methodologies allow for serial measurement of tumor size, circumventing the need for sacrificing mice at given time points. In orthotopically transplanted murine models of brain tumors, cross-section micro-MRI allows for visualization and measurement of the physically inaccessible tumors. To allow for long resident times of a contrast agent in the tumor, intraperitoneal administration was used as a route of injection for contrast-enhanced micro-MRI, and a simple method for relative tumor volume measurements was examined. A strategy for visualizing the variability of the delayed tumor enhancement was developed. These strategies were applied to monitor the growth of brain tumors xenotransplanted into nude mice and either treated with the antiangiogenic peptide EMD 121974 or an inactive control peptide. Each mouse was used as its own control. Serial imaging was done weekly, beginning at Day 7 after tumor cell implantation and continued for 7 weeks. Images obtained were reconstructed on the MRI instrument. The image files were transferred off line to be postprocessed to assess tumor growth (volume) and variability in enhancement (three-dimensional [3-D] intensity models). In a small study, tumor growth and response to treatment were followed using this methodology and the high-resolution images displayed in 3-D allowed for straightforward qualitative assessment of variable enhancement related to vascular factors and tumor age.
Introduction
The effects of antineoplastic agents are typically evaluated in rodents by growing the target tumor under the skin. Recently, it has been shown that the tumor microenvironment is crucial for tumor growth, invasion, and metastasis as well as for its response to various therapeutic regimens [1–12]. We have observed that the growth of human brain tumors xenotransplanted into nude mice only responded to the angiogenesis inhibitor EMD 121974 when implanted into the forebrain, but not when administered subcutaneously [12], demonstrating that the microenvironment has profound effects on tumor pathophysiology. Therefore, heterotopic tumor models are not appropriate to study treatment response of spontaneous tumors in patients, necessitating the use of orthotopic models. Tumors grown subcutaneously can be easily assessed by measuring the tumor dimensions with a caliper. Orthotopically grown brain tumors, due to their inaccessible location, require serial sacrifice to evaluate tumor size and response to treatment. In vivo imaging methodologies allowing for serial measurement of tumor size would circumvent the need for sacrificing the mice at given time points. Furthermore, MRI imaging allows for the measurements of other physiologically relevant parameters.
In the present study, we used contrast-enhanced micro-MRI to visualize human brain tumors xenotransplanted into the forebrain of nude mice in order to follow their growth and to measure their response over time to the angiogenesis inhibitor EMD 121974. Images were reconstructed on the MRI instrument, and the raw image files transferred off line to a PC-based workstation to be postprocessed. Tumor growth (measurement of tumor relative volume) and variability in enhancement (three-dimensional [3-D] intensity models) were assessed using Metamorph (Universal Imaging, West Chester, PA) and Amira (TGS, San Diego, CA) respectively. We demonstrate that micro-MRI at a resolution of 1 nL per voxel (approximately 1200 cells) is practical in animal cancer models.
Materials and Methods
Cell Line
The human brain tumor cell line U87MG (glioblastoma) was purchased from ATCC (Manassas, VA) and grown in RPMI (Roswell Park Memorial Institute) with 10% fetal bovine serum in 5% CO2 at 37°C. Cells for intracerebral injection were obtained by trypsinization from subconfluent cultures, washed twice with PBS, and suspended in serum-free RPMI medium at 106 cells/10 μL.
Mice
Female Balb/c nu/nu mice (Harlan Sprague Dawley, St. Louis, MO), 4–6 weeks old, were used. Animal studies including MRI scanning were done according to the NIH guidelines and were approved by the local animal care committee.
Brain Tumor Model
Details of the xenotransplant model in nu/nu mice have been described previously [12]. In brief, 106 tumor cells suspended in 10 μL serum-free RPMI medium were injected over 10 min into the forebrain at 1.5 mm lateral and 0.5 mm anterior to the bregma, at a depth of 2.5 mm. Mice were kept under general anesthesia with a mixture of xylazine (2.35 mg/mL) and ketamine (3.5 mg/mL) during the procedure. For histological studies, brains were removed after the last serial scan and either snap frozen in liquid nitrogen or fixed in 10% buffered formalin and embedded in paraffin for hematoxylin and eosin (H&E) staining. The tumor growth curve was established by sacrificing mice at specific weekly intervals after tumor implantation. Results are given as mean of the biggest diameter, obtained by serial sections, with five animals for each time point.
Brain Tumor Treatment
The active αv-integrin antagonist EMD 121974, cyclo (Arg-Gly-Asp-D-Phe-[N-Met]-Val), and the inactive control peptide EMD 135981, cyclo (Arg-β-Ala-Asp-D-Phe-Val), used in this study were kindly provided by S.L. Goodman, PhD, and A. Jonczyk, PhD (Merck, Darmstadt, Germany). Daily intraperitoneal treatment with the active or inactive pentapeptide was initiated on Day 3 after tumor cell injection.
Brain Tumor MRI
Ten mice were examined in this study with five animals being treated with the active peptide and five with the inactive peptide. The study lasted 8 weeks, and 32 separate imaging examinations were obtained. Mice (20–23 g) were sedated with 150 μL of a xylazine (2.35 mg/mL) and ketamine (3.5 mg/mL) mixture given intraperitoneally and wrapped in cellophane to prevent hypothermia via evaporative heat important in high surface area to volume animals [14] and minimize contamination of the MRI instrument. Note that recent upgrades to the commercially available systems make physiological maintenance easier. All images were obtained using a 500-MHz DRX MRI (11.7 T) system (Bruker Instruments, Billerica, MA) equipped with microimaging gradients (1 T/m maximum gradient strength, 2 kT/m/s maximum slew rate). A 25-mm internal diameter linear birdcage resonator was used for radio frequency transmission and reception. Mice were placed in a specially designed holder that positioned the mice vertically with the brain at the isocenter of the birdcage resonator. The cellophane also helped to minimize respiratory distress for the mouse in this orientation by providing us with many contact points for suspension of the mouse in this unnatural position. In all cases, 100 μL (50 μL Prohance 0.5 M diluted with 50 μL water) of the paramagnetic contrast agent Prohance (Bracco Diagnostics, Princeton, NJ) was administered intraperitoneally (regardless of individual weight 18–22 g) to enhance tumor visualization. Isofluorane gas (0.8–1.5% in air) was used for supplementary sedation as needed. Animals were typically maintained anesthetized for 1 hr, although in some cases, this was prolonged to approximately 1.5 hr to allow for higher-resolution scans. In order to perform six to eight examinations in a 10–12-hr period, we limited our overall examination times to approximately 1.5 hr. T1-weighted images with a TR/TE 450/15 were obtained using the modified version of standard Paravision MSME (Multi-Slice Multi-Echo) pulse sequence supplied by the manufacturer (Bruker Instruments). Resolutions obtainable in 1.5-hr total scan time were 80 μm in-plane and 200 μm slice thickness requiring 80-min scan times (16 averages). Twenty to twenty-five slices were obtained across the brain. Using the current coil configuration and limiting ourselves to 20-min scan times, images with good signal-to-noise ratio could be still be obtained (eight averages) with a resolution of 120 μm in-plane and 400 μm slice thickness.
Correlation MRI and Histological Measurements
For volume analysis, Metamorph software was used. The brain width to tumor width ratio both in one MR image (160 × 160 × 400 μm) and the corresponding scanned histological images were calculated in six mice. This ratio was used for comparison to minimize the systematic differences due to tissue shrinkage during fixation. Brain width was represented by a line segment passing through the tumor along the short axis of the brain at the point of injection, which was also perpendicular to the long axis of the brain. Tumor width was assessed in the same plane and was represented by a line segment that measured the maximum tumor width (Figure 3) Values obtained in Metamorph were automatically transferred through DDE data exchange to Excel (Microsoft, Redmond, WA).
Postprocessing Volume Assessment
For volume analysis, Metamorph software (Universal Imaging) was used. The tumor area was manually segmented and stored in the program. After tumor delineation, the number of pixels contained in the tumor area of each slice was automatically transferred through DDE data exchange to Excel including pertinent imaging data useful for database management. Volume was calculated by σ (pixels for each slice × pixel volume).
Postprocessing Enhancement Assessment
The image data were transferred off line for processing. Amira software was used for 3-D visualization of delayed enhancement, which occurred well after peak tumor concentration of the Prohance contrast agent. Areas of the tumor containing high concentrations of contrast material and thus exhibiting the most intensity in the MRI images, were assigned a color based on the their level of contrast enhancement. Yellow was the least enhancing area, brown being intermediate and red representing most enhancing areas. Six surfaces of the varying intensity values were created in Amira and assigned an appropriate color. The individual surfaces were made transparent with the yellow surfaces being made the most transparent and red the least transparent (see figure legend for more details).
Results
Tumor Growth and Histology
Growth of the tumors after intracerebral injection of 106 U87MG cells is shown in Figure 1. The size of the tumor cell inoculum does not change during the first 7–14 days, and then increases to 1 mm by Days 14–21, and, thereafter, an exponential growth occurs with tumor sizes up to 5.5–6 mm after 42 days.

Growth curve of intracerebrally injected U87MG cells. Cells (106) in 10 μL serum-free RPMI medium were injected as described in the Materials and Methods. Mice were sacrificed at the time points indicated and the biggest diameter determined in serial sections. Each time point shows mean diameter of five mice with SD.
Histological examination after 7 days shows a small nest of tumor cells (Figure 2, top). After 18 days, the tumor had increased to about 1 mm diameter (Figure 2, middle), and by Day 42, it was 5 mm in size (Figure 2, bottom).
Correlation of MRI and Histological Measurements
Our study was designed to determine relative temporal volume changes within individual tumors; less emphasis has been placed on the absolute quantitation of tumor sizes. However, to provide a confidence that our MRI measurements were reflective of true tumor size as inferred from the close correspondence between the shape seen in the histological sections and the MR images, we measured the ratio of the tumor to the brain in both images and plotted the results. A good correlation at .939 was seen (Figure 3). The correlation coefficient is strongly reduced by one outlier or it would be even higher (.997). The slope of the line was 0.93 with an intercept of 0.01.
Tumor Enhancement
Intraperitoneal injections of Prohance were used to maintain an elevated concentration of contrast in the blood and the enhancing tumors could easily be visualized up to 1.5 hr after injection. Peak concentration of the contrast agent occurred at 20 min after injection. All images collected were beyond this time point. Pooling of contrast agent in the tumor is mostly responsible for what we term delayed enhancement and was present within 15 min and lasted well over an hour.
The tumor showed no significant enhancement on Day 7 (Figure 4, top), but there was a clearly demarcated, small (<1.0 mm) tumor present on Day 14 (Figure 4, middle), which increased to 5 mm by Day 49 (Figure 4, bottom). The tumor shows areas of low and high enhancement, indicating presence pooling in certain areas. The effect of active treatment on tumor growth is shown in Figures 5 (B1-B4) and 6. While the control tumor (Figure 5, A1-A4), which grew into the ventricle, grew rapidly from Day 21 to Day 35, the tumor treated daily with EMD 121974 remained small during this period of observation with a diameter of less than 1 mm.
Calculation of Tumor Volume
The tumor volume data for a treated tumor are shown in Figure 6. Each column represents one of three rotations taken from the 3-D projection data at 0° (mouse prone), 30°, and 60°, respectively, and each row represents the projection data for Days 7, 14, 21, and 28 respectively. No tumor was visualized at Day 7 (see also Figure 4) due to lack of enhancement. At Day 14, two fingers of the tumor were visible as was true at Day 21, which had disappeared by Day 28. This finding is also reflected in the calculated tumor volume, which decreased from 2.6 μL at Day 14, to 2.1 μL at Day 21, to 1.1 μL at Day 28. Because the 3-D projection does not take into account tumor areas with different enhancement, alternative postprocessing methods were employed.
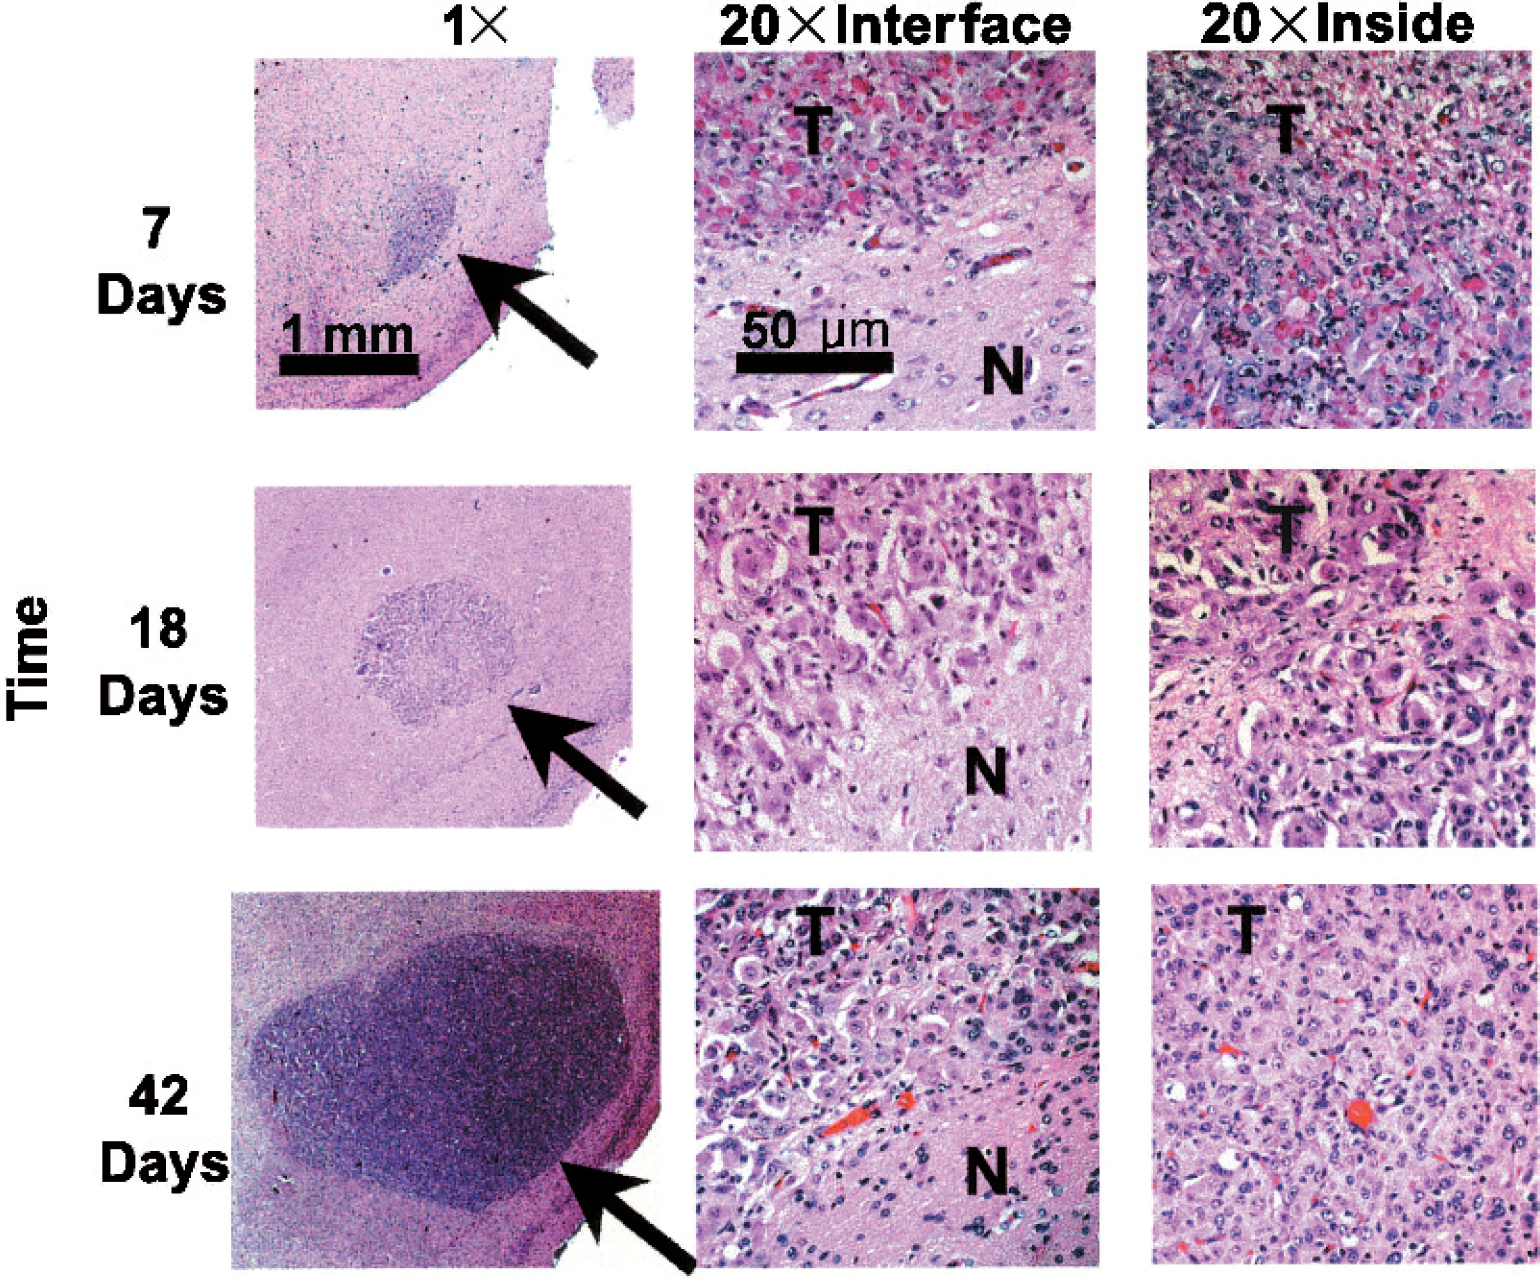
Histology (hematoxylin and eosin) of intracerebral tumor growth: Day 7 (top), Day 18 (middle), and Day 42 (bottom). (20×) Tumor/tissue interface and inside of tumor.
Analysis of Delayed Enhancement
Because heterogenous enhancement was observed in larger tumors (see Figure 4, 49 days) an alternate method of 3-D visualization (Figure 7), which focuses on the variability of the delayed enhancement within the tumor, was employed. This procedure allowed for the visualization of the entirety of the data as a semitransparent 3-D object. The data could be rotated and visualized from any angle as typical for a 3-D object. The trade-off was that transparency requires basic assumptions to be made about the importance of a particular subset of the data.

Validation of the MRI technique was performed by comparing the width of the tumors in relationship to the width of the brain (tumor/brain) ratio in the MR image and the histologically based image for a range of tumor sizes.
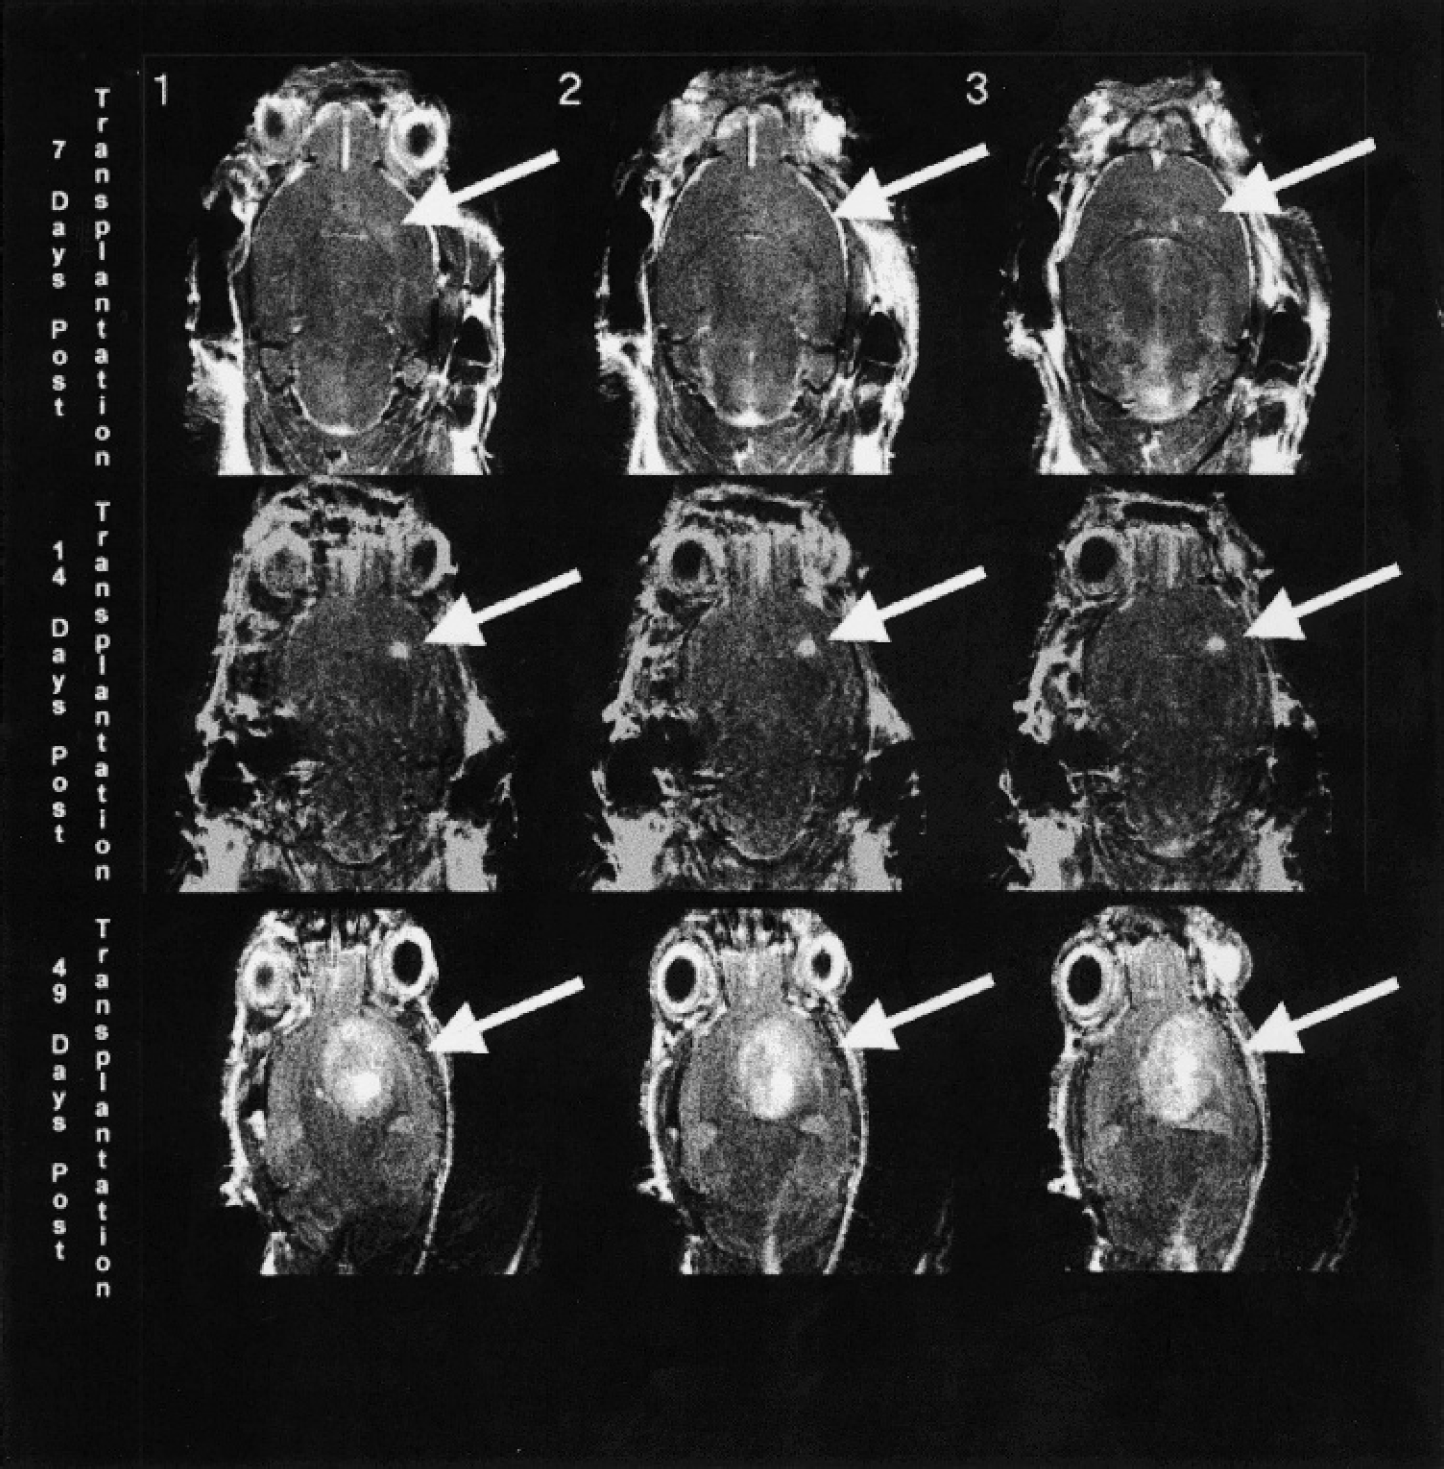
High-resolution images of control tumors at Day 7 (top), Day 14 (middle), and Day 49 (bottom). Numbers 1, 2, and 3 indicate different slice locations of the same tumor.
The Amira software was used for visualization (3-D) of the delayed enhancement. Areas of the tumor containing high concentration of contrast agent and thus exhibiting the most intensity in the MRI images, were assigned a color based on the their level of contrast enhancement. Yellow was the least enhancing area, brown being intermediate and red representing the most enhancing areas. Six surfaces of the varying intensity values were created in Amira and assigned an appropriate color. The individual surfaces were made transparent with yellow surfaces being made the most transparent and red the least transparent. In Figure 7, Panel A shows the depiction of the surface of the brain with the tumor location given in the inside. Panel B gives an example of the raw data for the tumor only. The tumor only is viewed from the top of the mouse, Panels C1-C4, and from the front and side, Panels D1-D4. Panels C1 and D1, the least intense surface and the most intense surface are “turned on.” In Panels C2-C4 and D2-D4, the intermediate surfaces are “turned on” sequentially.
This visualization technique allowed us to assess the variable enhancement in the entirety of the 3-D object (tumor) without viewing individual 2-D slices. In young tumors, the variability was not as pronounced as in older tumors, such as the one shown in Figure 7 (see also Figure 4), where the edges of the tumor were clearly less enhancing. Because these were relatively fast-growing tumors, apparently, vessels contained within areas of new growth were not very leaky. Thus, the leading edge of tumor growth does not show the variability in enhancement nor the intensity of enhancement. In comparison, red areas, mostly located at the site where the tumor cells were originally injected, show considerable variability, suggesting that older vessels were leakier.

High-resolution images of an untreated tumor and a treated brain tumor. Untreated Day 21 (A1-A2) and Day 35 (A3-A4) after tumor implantation, which grew into ventricles. Treated Day 21 (A1-A2) and Day 42 (A3-A4) after tumor implantation.
Discussion
Microimaging equipment have recently been developed, which allow for visualization of internal organs and structures in small animals [15]. In the present study, we used an 11.7-T micro-MRI to study the localization and growth of human brain tumors xenotransplanted into the forebrain of nude mice and to evaluate our delayed enhancement based method as a tool to judge the tumor's response to the antiangiogenic compound EMD 121974 [10],[12],[15]. The contrast agent Prohance was given intraperitoneally, because it gave similar imaging results as when given intravenously but with much longer resident times in the tumor. Caveat: Because MRI scans in the clinical setting are normally obtained soon after the administration of the contrast agent, when it is still present in the blood, there is less emphasis on enhancement due to pooling. In contrast, in our present study, imaging was done 30–60 min after intraperitoneal injection of contrast agent when only traces are present in the blood.
Our histopathology data demonstrate that the tumor size does not increase in size from the day of injection until Days 7–10 with an average tumor diameter of 0.75 mm (see Figures 1, 2, and 4). Although the resolution of our MRI scanner allows for the detection of structures of 0.1 mm diameter, only a faint enhancement signal was detected up to Day 7. This indicates that normal established vessels were within and around the tumor, or new vessels without the leakiness of pathological tumor vessels had been established. It is not known whether this lack of enhancement is true of spontaneously developing tumors as is the clinical relevant case.
It is well established that tumors of 1–2 mm diameter do not need neo-vascularization for survival, because sufficient nutrition is provided through diffusion [16]. Furthermore, Zagzag et al. [17] have recently shown that brain tumor cells injected into the brain migrate towards established microvessels that are abundant in the normal brain. Once the vessels are co-opted, a cascade occurs involving VEGF and probably Ang-2 [18], which profoundly affect the character of the vessels. Our data suggest that tumor enhancement begins before a significant increase of the tumor size is observed, suggesting that angiogenesis precedes the exponential growth of the tumor. We recently observed similar histopathological findings in a related study (Yamada, McComb, Gonzalez-Gomez, Bu, and Laug, manuscript in preparation). Studies focusing on the biology of this stage of tumor development and corresponding in vivo imaging studies are required to obtain a better understanding of the imaging related phenomena.
Serial scanning of a given mouse allowed following the tumor growth in an accurate manner and the establishment of a tumor growth curve for individual tumors (see Figure 6). Furthermore, repeat scanning may demonstrate a misplaced injection site, such as ventricle or olfactory bulb, growth of the tumor back up through the needle track to the brain surface or late penetration of the tumor into the ventricular system. This is important in evaluating brain tumor response to treatment, because intraventricular tumors or those growing on the brain surface normally do not respond to any treatment (Laug, unpublished data). Serial MRI scanning also allows for the evaluation of treatment response as shown in the present study. The tumors grow to an approximate size of 1 mm and then remain unchanged or get smaller, demonstrating a significant effect of the antiangiogenic compound EMD 121974. Similarly, we have previously reported that mice orthotopically injected with U87MG cells survive over 18 weeks when treated daily with this peptide [12]. The growth to 1 mm diameter, despite treatment with the antiangiogenic peptide from Day 3, supports the hypothesis that active angiogenesis occurs only after tumors have reached this size. Our resolution was much higher than necessary to follow tumor growth and response to treatment in this model. If tumor size is the main goal, reducing the resolution can save imaging time.

3-D Volumetric analysis of suppression of brain tumor growth with EMD 121974. Images were taken 7, 14, 21, and 28 days after tumor implantation and were reconstructed as described in the Materials and Methods. Pictures show brain with tumor at angles of 0° (left), 30° (middle), and 60° (right). Tumor volumes are given on the left.

Assessment of delayed enhancement using 3-D analysis of semitransparent surfaces (representing volumes) of a control tumor growing mainly in the ventricles. (A) Cutout of the 3-D surface of the mouse brain (ridges represent slice thickness) with the 3-D tumor inside. This panel shows the relative scale and position of the tumor compared to the whole mouse brain. (B) An example of the raw data for one slice of the tumor only. (C and D) Reconstruction of the tumor alone shown from two different angles, from the top of the mouse head down (Panel C), and rotated to give perspective (Panel D). Panels C1-C4 and D1-D4 contain progressively lower levels of thresholding starting from the most intense enhancement being red. Panel 1 with the lowest contrast threshold of 25 units (pale yellow), showing the tumor surface, and the highest threshold (dark red) of 225 units. (C2) The 175-unit threshold is added (brown). (C3) The 125-unit threshold is added (yellow). (C4) The 75-unit threshold is added (light yellow).
Postprocessing tumor volume assessment was easily performed in Metamorph after delineating the tumor contours by hand and was finalized in Excel. Thus, no special programming expertise is needed. There were no complications in volume assessment largely because the tumors were easily delineated. Serendipitously, the propensity of this particular cell in this model to form clear boundaries between the tumor tissue and the normal brain greatly aided us in this regard (note the well demarcated boundaries forming what appears to be a tumor capsule in Figure 2). 3-D Projection measurements could easily be produced in the program, which allows the assessment of the tumor growth pattern. However, more information was available, and alternative 3-D visualization techniques yielded more insight as discussed below.
We found intraperitoneal injection of the contrast agent to be a useful and reproducible method. Our studies are not directly comparable to most clinical studies but they are directly analogous to those clinical studies concentrating specifically on delayed enhancement.
Due to the large amount of information contained in the tumor images as a whole, 3-D visualization of the image data in terms of enhancement variability may prove useful. While our resolution does not approach that of light microscopy, it is sufficient to pick out large differences within even small tumors. This ability to assess the variability aided our comparisons with histology. The current limited study was only intended to assess the potential usefulness of our approach. Nevertheless, we suggest that this kind of data analysis may yield interesting results when compared to histochemical analysis of blood vessel or other techniques studying vessel pathophysiology.
Numerous studies have been carried out relating microvascular density and permeability to tumor “metastatic character” and grade, both in animal models [19]–[25] and in retrospective human studies [26]–[29]. The delayed enhancement seen in our mouse model is likely related to these vascular factors, those seen in clinical related studies, and those seen in rat models [30]–[32]. However, the exact relationship is both yet to be determined and beyond the scope of the present work.
The change of enhancement with time and the heterogeneity of enhancement seen in large tumors make a simple comparison between vascular factors and delayed enhancement difficult, and maybe dominated by the extra volume faction. During earlier stages of the development of the tumors, vascular factors change probably depending on both age and size of the tumor. In our study, intratumor enhancement began to show differences between Weeks 2 and 4, and it was clear that tumors exhibited considerable variability in enhancement, especially as they got larger and older. There is some indication in later stages that the growing edges of the tumor do not contain leaky vessels.
Based on the rat studies, changes in vascular properties are dependent on the age and/or size of the tumor [30]–[32]. Based on our results, we suggest that further spatially oriented tumor vascular studies can be guided by the onset of enhancement and the degree of variability in the delayed enhancement seen in the MRI images. Very spatially detailed data are available using our method. Ideally, it would be useful to compare results using our method to those based on standard time-resolved MRI methods like those accomplished in rats [30]–[32]. Two factors will make this difficult but not unachievable—the faster physiology of the mouse and its smaller size.
Footnotes
Acknowledgments
This work was supported by grants from the NIH (CA 82989), the T.J. Martell Foundation, and Merck (WEL). We thank George McNamara for independent measurement of tumor widths (histology).