
Abstract
Brown adipose tissue (BAT; brown fat) is the principal site of adaptive thermogenesis in the human newborn and other small mammals. Of paramount importance for thermogenesis is vascular perfusion, which controls the flow of cool blood in, and warmed blood out, of BAT. We have developed an optical method for the quantitative imaging of BAT perfusion in the living, intact animal using the heptamethine indocyanine IR-786 and near-infrared (NIR) fluorescent light. We present a detailed analysis of the physical, chemical, and cellular properties of IR-786, its biodistribution and pharmacokinetics, and its uptake into BAT. Using transgenic animals with homozygous deletion of Type II iodothyronine deiodinase, or homozygous deletion of uncoupling proteins (UCPs) 1 and 2, we demonstrate that BAT perfusion can be measured noninvasively, accurately, and reproducibly. Using these techniques, we show that UCP 1/2 knockout animals, when compared to wild-type animals, have a higher baseline perfusion of BAT but a similar maximal response to β3-receptor agonist. These results suggest that compensation for UCP deletion is mediated, in part, by the control of BAT perfusion. Taken together, BAT perfusion can now be measured noninvasively using NIR fluorescent light, and pharmacological modulators of thermogenesis can be screened at relatively high throughput in living animals.
Keywords
Introduction
In small mammals, especially rodents, brown adipose tissue (BAT) is central to the regulation of heat production and energy balance (reviewed in [1]). The control of BAT thermogenesis resides in the hypothalamus, which stimulates BAT directly through sympathetic neurons [2] and indirectly via the control of the thyroid axis [3]. Thermogenesis itself is mediated in large part by one or more uncoupling proteins (UCPs) in the inner mitochondrial membrane, which directly convert protons into heat [1]. The physiological effectiveness of this system is ultimately determined by vascular perfusion, which ensures the delivery of cool blood to, and the removal of warmed blood from, BAT.
Several methods have already been described for imaging BAT, and in some cases its perfusion, in living animals. Magnetic resonance imaging (MRI) has been used to monitor, noninvasively, BAT anatomy, hypertrophy, and chemical composition over time [4–8]. 123I- and 125I-metaiodobenzylguanidine (MIBG) has been used to image adrenergic neurons that innervate BAT [9]. Laser Doppler flowmetry [10], 133Xe clearance [11], 103Ru-labeled microspheres [11], and 46Sc-labeled microspheres [11] have all been used to measure blood flow to BAT. However, these methods either have inherently low resolution, require expensive equipment, have low sensitivity, require the use of radioactivity, require sacrifice of the animal and tissue dissection, or image only the neuronal compartment of BAT. In particular, none of these imaging methods actually measure the extraction of a molecule from the bloodstream into brown adipocytes, but instead sample either macroscopic blood flow or capillary size.
In this study, we present a relatively straightforward, noninvasive optical method for measuring BAT perfusion that exploits the high tissue penetration and low autofluorescence of near-infrared (NIR) light. When compared to visible light, photon penetration into living tissue is more efficient in the NIR (700–900 nm) due to lower absorption and scatter (reviewed in [12]). Because absorption is lower, tissue autofluorescence is also lower in the NIR and results in relatively low tissue background. By introducing an exogenous NIR fluorophore that localizes to the tissue of interest, sensitive and specific detection of the target is possible using relatively inexpensive equipment and without the use of radioactivity. Although penetration depth limits such studies in many cases [13,14], interscapular BAT is an ideal tissue for NIR imaging given its superficial location.
Heptamethine NIR fluorophores of the indocyanine class offer several advantages for in vivo imaging. Peak absorption in the 760–780 nm range, and peak fluorescence emission in the 795–815 nm range, provide high photon penetration through living tissue. Visible and far-red lipophilic cyanine dyes are known to exhibit differential subcellular localization, being targeted to mitochondria when applied at low concentration extracellularly, and to the endoplasmic reticulum (ER) when applied at higher concentration [15,16]. In this study, we show that the NIR indocyanine IR-786 also exhibits concentration-dependent mitochondrial and ER localization, and when injected intravenously, it is first-pass extracted into BAT as a function of tissue perfusion. IR-786 permits direct measurement of BAT perfusion, and it can be used in conjunction with transgenic animals to study the modulation of thermogenesis.
Materials and Methods
Reagents
IR-786 perchlorate (CAS no. 102185-03-5) and indocyanine green (ICG) were from Sigma-Aldrich (St. Louis, MO). The carboxylic acid form of IRDye78 (IRDye78-CA) was a generous gift from LI-COR (Lincoln, NE). Fluorophores were stored as 10-mM stock solutions in dimethylsulfoxide at −80°C in the dark. Rhodamine 123 and ER-Tracker were from Molecular Probes (Eugene, OR).
Cell Lines
Human (T24) and mouse (MBT-2) bladder transitional cell carcinoma cells were generous gifts from Michael A. O'Donnell (University of Iowa). Cells were grown in RPMI 1640 medium supplemented with 10% fetal bovine serum under 5% CO2. Rat neonatal cardiomyocytes (NCMs) were prepared and cultured, as described previously [17], in Ham's F10 medium (Gibco/Invitrogen, Carlsbad, CA).
Animals
Animal husbandry was provided by the AAALACcertified Harvard Medical School Animal Resources Center, and animals were used in accordance with an approved institutional protocol. Male hairless, 5 – 7-week-old (approximately 30 g) SKH1 mice were purchased from Charles River Laboratories (Wilmington, MA) and anesthetized with 50 mg/kg intraperitoneal pentobarbital. Transgenic mice harboring homozygous deletion of Type II iodothyronine deiodinase [18] have been described previously. Mice harboring homozygous deletion in both UCP-1 and UCP-2 were bred from a cross of UCP-1 −/− [19] and UCP-2 −/− [20] mice on a mixed background of C57BL/6J and 129/SVJ and will be described elsewhere (CZ and BBL, manuscript in preparation).
Spectral Measurements
Absorbance was measured in a 1-cm path length quartz cuvette on a Model DU-600 spectrophotometer (Beckman, Fullerton, CA). For 96-well plate experiments, fluorescence was measured with a SPECTRAmax Gemini XS microplate reader (Molecular Devices, Sunnyvale, CA) using Model 655076 black 96-well plates (Greiner, Lake Mary, FL) or Model 353949 optically isolated 96-well tissue culture plates (BD Biosciences, Bedford, MA). All other fluorescence measurements were made using a SPEX Fluoromax-1 (Jobin Yvon, Edison, NJ) spectrofluorometer. Emission scans were performed with a 7-nm slit width. Quantum efficiency in various solvents was measured by comparison to ICG in dimethylsulfoxide [21] under conditions of matched fluorophore absorbance. To determine photobleaching threshold, a 10-μL drop of fluorophore in 10 mM N-(2-hydroxyethyl)piperazine-N′-(2-ethanesulfonic acid) (HEPES), pH 7.4 was placed on waterproof black paper and was irradiated with a 770-nm laser light at the indicated fluence rate for a total of 10 sec. NIR fluorescence was measured continuously using the imaging system described below.
In Vitro Cellular Accumulation and Localization
For kinetics of IR-786 accumulation, cells grown in 96-well plates were incubated in 100 μL of either phenol red-free Dulbeco's modified Eagle's medium supplemented with 25 mM HEPES, pH 7.4 (DH buffer; T24 and MBT-2) or Ham's F10 medium (NCM) supplemented with 5 μM IR-786 for the time indicated at 37°C, washed three times with fluorophore-free buffer, and lysed in 100 μL of absolute methanol (MeOH). Total NIR fluorescence was compared to IR-786 standards in the same volume of MeOH. For cellular accumulation experiments, cells were incubated with IR-786 in the appropriate buffer, at the concentration indicated, for 30 min at 37°C. Cells were then washed three times with fluorophore-free buffer, lysed in MeOH, and quantitated as described for kinetic experiments. For cellular localization experiments, cells grown on 18-mm glass coverslips were incubated with the indicated concentration of IR-786 in the appropriate buffer for 5 min at 37°C, followed by the addition of 2.5 μM rhodamine 123 and/or 1 μM ER-Tracker for an additional 10 min. Cells were then washed three times with fluorophore-free buffer and were visualized directly using the fluorescence microscopy system described below.
NIR Fluorescence Microscopy
NIR fluorescence microscopy was performed on a four-filter set Nikon Eclipse TE-300 epifluorescence microscope equipped with a 100-W Mercury light source and NIR-compatible objectives (Nikon, Melville, NY). Standard blue, green, and red filter sets (Nikon) were comprised of the following excitation/dichroic/emission filter wavelengths: blue (340–360 nm/400 nm/430–490 nm), green (460–500 nm/505 nm/505–560 nm) and red (525–555 nm/565 nm/590–650 nm). The custom NIR filter set (Chroma Technology, Brattleboro, VT) was 725–775 nm/785 nm/790–830 nm. Filter sets used for ER-Tracker, rhodamine 123, and IR-786 were blue, green, and NIR, respectively. Images were acquired on a Photometrics Sensys CCD Camera (Model 1401, Roper Scientific, Tucson, AZ) with heat filter removed. Image acquisition and analysis were performed using IPLab software (Scanalytics, Fairfax, VA).
Biodistribution and Pharmacokinetics
For all in vivo experiments, IR-786 was diluted to 10 mM in phosphate-buffered saline (PBS) supplemented with 5% Cremophor EL (Sigma-Aldrich) and 5% absolute ethanol, and a total of 100 μL (1 nmol) was injected intravenously (iv) via the tail vein. Serum concentrations were analyzed fluorometrically as described previously [13]. To estimate tissue uptake, organs were removed and flash frozen in LN2, cut into 1-mm cubes, minced, extracted in absolute MeOH, and measured fluorometrically using fluorophore standards diluted in control organ extract. Laser Doppler flowmetry was performed on a Periflux System 5040 (Perimed, Stockholm, Sweden), using a no. 407-1 needle probe, and after calibration with the no. PF1001 Motility Standard.
Small Animal NIR Fluorescence Imaging System
For whole animal NIR fluorescence imaging, excitation light consisted of two 150-mW halogen light sources (Dolan-Jenner, Lawrence, MA) and custom excitation filters (750 ± 25 nm; Chroma Technology), which generated a fluence rate of approximately 8 mW/cm2 over a 10-cm-diameter field of view. For most experiments, IR-786 excitation was performed with a custom 770-nm, 250-mW, RS-232-controlled laser diode system (Laser Components, Santa Rosa, CA) using a fluence rate of 50 mW/cm2 over a 2.5-cm-diameter field of view. Emitted light was collected with a custom zoom lens system (Optem, Fairport, NY), which also housed the emission filter(s), and it was imaged using a NIR compatible Orca-ER camera (Hamamatsu Photonic Systems, Bridgewater, NJ) or Model HV-D27 color video camera (Hitachi, Tarrytown, NY). For fluence rates of 8 and 50 mW/cm2, exposure times were 125 and 25 msec, respectively. Other Orca-ER settings included 2 × 2 binning (672 × 512 pixels resolution) and gain of 9 (out of 9). Fluence rate was measured with a Model 2A-SH thermocouple probe and an Orion TH digital meter (Ophir Optronics, Danvers, MA).
In Vivo Quantitation of IR-786 Uptake in BAT
Except where indicated, IR-786 measurements were acquired using the above imaging system 5 min after intravenous injection of 1 nmol of IR-786 via the tail vein. Quantitation in hairless animals did not require a depilatory, however, because fur precludes the use of this technique; transgenic animals were treated with two sequential 2-min applications of Nair (Carter-Horner, Montreal, Quebec). For quantitation, the NIR signal from a region of interest was measured over BAT, the region of interest moved to adjacent non-BAT tissue for background measurement (described in Figure 4B), and a ratio calculated using IPLab software.
Results
Physicochemical Properties of IR-786
The perchlorate salt of the heptamethine indocyanine IR-786 (Figure 1A) was used in this study. IR-786 was found to have marginal solubility (10 μM) in neutral aqueous buffer (Table 1), consistent with the absence of charged groups and its hydrophobic structure. On the contrary, solubility of IR-786 in organic solvents, such as absolute MeOH, was 250 μM (Table 1). For comparison, Table 1 also shows the properties of a IRDye78-CA, a tetra-sulphonated, hence, highly soluble derivative of IR-786.
Photoproperties of IR-786
Absorbance wavelength scanning of IR-786 (Figure 1B) in aqueous and organic solvents revealed a peak absorbance at 768 and 774 nm, respectively, with a minor alternative resonance structure [13] approximately 60 nm below the major peak. As suggested by Figure 1B, formal determination of the extinction coefficient at λExcitation Max revealed a more than twofold enhancement in organic versus aqueous solvents (Table 1).
Because aggregation of hydrophobic fluorophores can affect their photoproperties, we tested the effect of concentration on the absorbance of IR-786 in aqueous (Figure 1C) and organic (Figure 1D) environments. As shown, IR-786 in aqueous solvent obeyed Beer's law until approximately 2.5 μM, at which the expected increase in absorbance for a given increase in concentration became nonlinear, likely due to aggregation. Indeed, the same experiment performed with IR-786 in absolute MeOH showed linearity (Figure 1D).
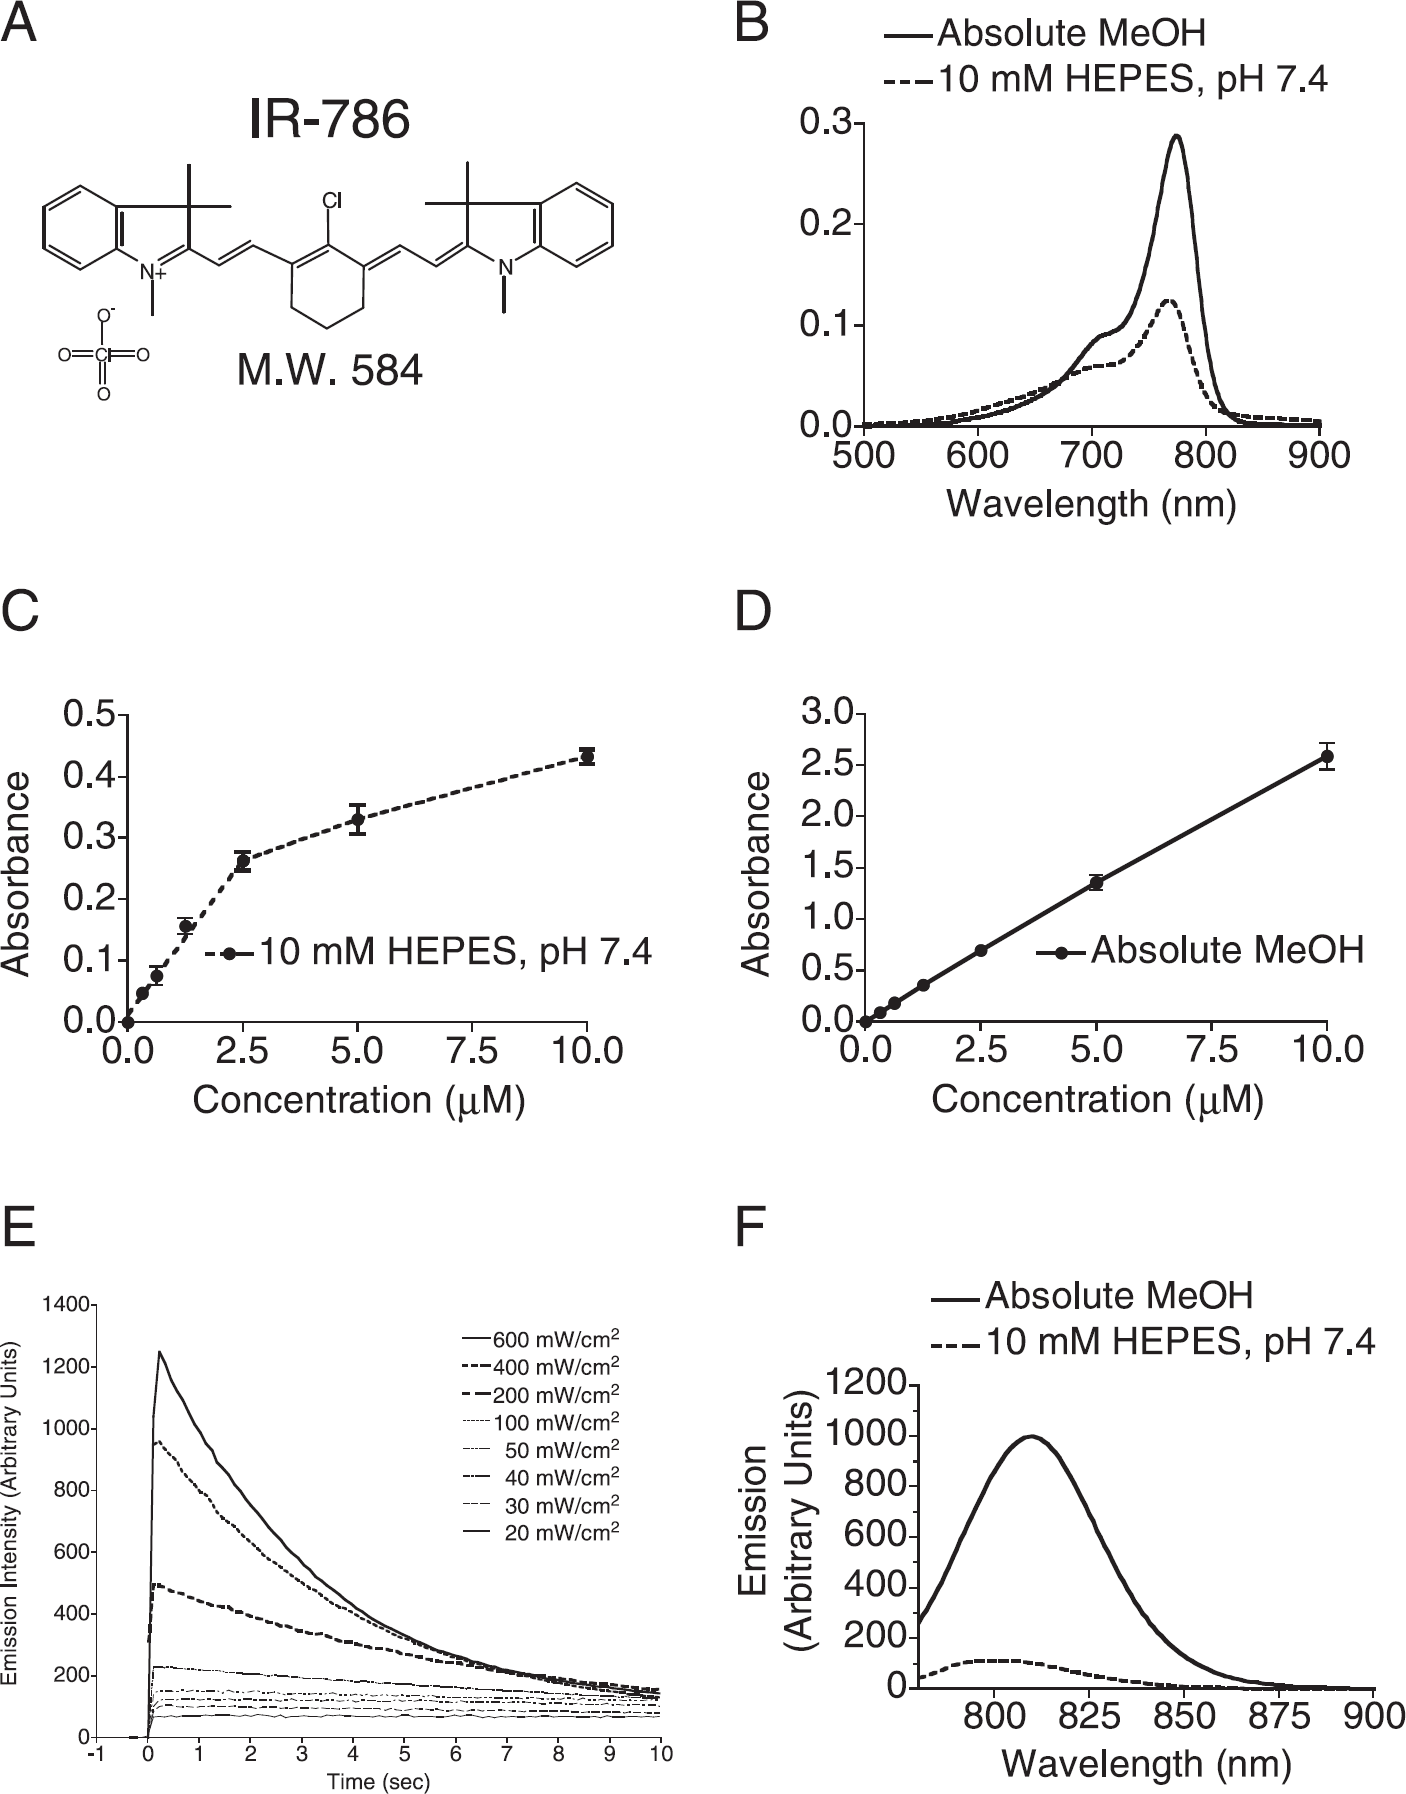
Chemical and optical properties of IR-786. (A) Chemical structure and molecular weight (M.W.) of the perchlorate salt of IR-786. (B) Absorbance wavelength scan of 1 μM IR-786 in absolute MeOH (solid line) or in 10 mM HEPES, pH 7.4 (dotted line). Wavelengths of peak absorption are summarized in Table 1. (C) Concentration dependence of IR-786 absorbance in 10 mM HEPES, pH 7.4. (D) Concentration dependence of IR-786 absorbance in absolute MeOH. (E) The photobleaching threshold of 2 μM IR-786 in 10 mM HEPES, pH 7.4, was measured as described in Materials and Methods using a 771-nm laser diode triggered at Time = 0. The fluence rate varied from 20 to 600 mW/cm2 as indicated. The ordinate shows fluorescence emission intensity measured using the small animal imaging system described in Materials and Methods. (F) Emission fluorescence wavelength scan of 500 nM IR-786 in absolute MeOH (solid line) or in 10 mM HEPES, pH 7.4 (dotted line). The peak absorption wavelength (B; Table 1) was used for excitation. Wavelengths of peak emission are summarized in Table 1.
Photoproperties of NIR Fluorophores IR-786 and IRDye78-CA

Because photobleaching of a fluorophore will lead to nonlinearities in measurement and decreased sensitivity, we determined the photobleaching threshold for IR-786 in neutral aqueous buffer. As shown in Figure 1E and Table 1, fluorescence emission of IR-786 is stable over time for excitation fluence rates less than 50 mW/cm2. However, above 50 mW/cm2, peak fluorescence does not increase linearly with increasing fluence rate, and there is rapid exponential decay of the signal. Given these results, all in vitro and in vivo imaging experiments were conducted with a fluence rate of 50 mW/cm2 or less.
Paralleling the effects seen with absorbance (Figure 1B-D) fluorescence emission intensity of IR-786 was strongly influenced by solvent (Figure 1F). Peak emission occurs at 803 and 809 nm, and quantum yields are 3.3% and 15.9%, in aqueous buffer and absolute MeOH, respectively (Table 1). These dramatic effects of chemical environment on the photoproperties of IR-786 must be considered when interpreting in vivo images obtained with this fluorophore (discussed below).
Cellular Accumulation of IR-786 In Vitro
Being a lipophilic cation, IR-786 might be expected to accumulate in subcellular compartments after application to culture medium [16]. Figure 2A shows quantification of cellular accumulation as a function of time in two bladder cancer (transitional cell carcinoma) cell lines of human (T24) and mouse (MBT-2) origin and spontaneously beating rat NCMs. For all cell lines, accumulation was rapid, reaching 50% of peak levels in 7.5–15 min and peak levels within 30 min. The capacity of each cell type to accumulate dye was tested over the full aqueous solubility range and is shown in Figure 2B. The capacity of cells for IR-786 is quite remarkable, and it is consistent with previous data in the literature [22]. For an applied concentration at the limit of aqueous solubility (10 μM), T24, MBT-2, and NCM cells were capable of incorporating up to 4.9 fmol (2.9 × 10⁹ molecules), 2.2 fmol (1.3 × 10⁹ molecules), and 6.1 fmol (3.7 × 10⁹ molecules) of IR-786 per cell, respectively.
Subcellular Localization of IR-786
Using a NIR-compatible epifluorescence microscope (see Materials and Methods), the intracellular accumulation of IR-786 in different subcellular compartments was visualized directly. Preliminary experiments determined that subcellular localization was a strong function of applied IR-786 concentration. For concentrations below a certain cell type-specific threshold, IR-786 localized exclusively to mitochondria and showed colocalization with the mitochondria-specific fluorophore [23] rhodamine 123 (Figure 2C). Subcellular fractionation confirmed that IR-786 was colocalized in the mitochondria-enriched fraction (Figure 2D). The threshold extracellular concentration for mitochondria-exclusive localization of IR-786 was determined to be 1, 0.25, and 0.25 mM for T24, MBT-2, and NCM cells, respectively.
Pretreatment of cells with 10 μM FCCP, which dissipates the mitochondrial membrane potential, abolished mitochondrial localization of both IR-786 and rhodamine 123 (Figure 3A). Staining of treated cells with a mitochondria-specific antibody (Chemicon mAb 1273) confirmed that mitochondria were structurally intact after FCCP treatment (data not shown). At extracellular concentrations above the threshold for mitochondria-exclusive localization of IR-786, intracellular accumulation of IR-786 continued to increase (see Figure 2B), showing an overlap with the ER-specific fluorophore ER-Tracker (Figure 3B). Interestingly, although FCCP changed intracellular localization from mitochondria to ER, there was no statistically significant difference in total cellular fluorophore accumulation of either IR-786 or rhodamine 123 (Figure 3C) with FCCP treatment. The implications of this result with respect to in vivo measurements are discussed below.
Biodistribution and Pharmacokinetics of IR-786 in the Mouse
Figure 4A shows the in vivo biodistribution and pharmacokinetics of IR-786 after intravenous injection into the mouse. At 1 min postinjection, a large fraction of the injected material is distributed to the lungs, and microscopic evaluation (data not shown) reveals trapping of aggregated fluorophore. Although solubilization in Cremophor EL and ethanol (see Materials and Methods) reduced intravascular aggregation, it could not eliminate it. Consistent with initial trapping by the lung and reticuloendothelial system, liver and spleen accumulation increased with increasing circulatory time, peaking at 1 hr postinjection. Moreover, lung accumulation decreased over 24 hr, likely secondary to continuous solubilization of trapped particles. Importantly, blood concentrations of IR-786 remain quite low (e.g., 20.6 nM at 1 min) due to rapid first-pass extraction by the reticuloendothelial system and specific organs such as BAT (see below). Indeed, an arteriovenous gradient is established after initial intravenous injection [14]. A detailed time course of IR-786 plasma kinetics has been published previously [14]. Uptake of IR-786 into the myocardium was rapid and significant, consistent with previously published results [14]. Uptake into other organs such as muscle, kidney, and brain was negligible. Hence, IR-786 acts as an optical tracer, being supplied to tissue as a function of vascular perfusion and rapidly extracted based on mitochondrial and ER mass.

Intracellular accumulation of IR-786 in bladder cancer cell lines T24 (human) and MBT-2 (mouse), and in freshly isolated rat NCMs. (A) The kinetics of cellular accumulation of IR-786 was measured as described in Materials and Methods and is expressed as femtomoles of fluorophore per cell. For each time point, the mean ± S.E.M. of six separate experiments is shown. (B) IR-786 accumulation as a function of extracellular concentration was measured as described in Materials and Methods and is expressed in femtomoles of fluorophore per cell. The abscissa shows the concentration of IR-786 (in μM) applied to cell medium. The ordinate shows the mean ± S.E.M. of six separate experiments. (C) NCMs were incubated with 0.25 μM IR-786 in the presence of 2.5 μM rhodamine 123 for 15 min as described in Materials and Methods. After washing, cells were visualized with the appropriate filter sets. A phase contrast image of the same field, with scale bar, is also shown. The data are representative of four independent experiments. (D) Subcellular fractionation of T24 human bladder cancer cells was performed after incubation with 0.5 μM IR-786 for 15 min. The ordinate shows IR-786 accumulation for the following fractions: total lysate (Total), nuclei (Nuc), mitochondria-enriched 10,000 × g pellet (P10), plasma membrane/ER-enriched 100,000 × g pellet (P100), and cytosol-enriched 100,000 × g supernatant (S100). The recovery from these four fractions was 92% of total lysate. The data shown are representative of three independent experiments.
Uptake of IR-786 into BAT and Quantitative In Vivo Imaging
During our initial studies utilizing IR-786 fluorescence for cardiac perfusion imaging [14], we noticed that a bright midscapular signal was variably present depending on the season and the temperature of the imaging room. Necropsy revealed BAT as the source of this signal, and tissue microdissection confirmed that brown, but not white, adipocytes extracted IR-786 from the circulation. Furthermore, microscopy confirmed that IR-786 was not partitioning into fat droplets in either cell type (data not shown). The increase in IR-786 extraction after BAT activation is illustrated in Figure 4B using treatment with the β3-specific agonist CL 316,243, with similar results obtained for other BAT activators (see data below). For quantitation of IR-786 uptake in the living animal and to reduce measurement error associated with variability of injected volume, particulate trapping by the lungs and reticuloendothelial system, and extraction by other tissues, the NIR fluorescence signal from BAT was compared ratiometrically to the signal from surrounding background tissues (Figure 4B; see Materials and Methods).

Concentration-dependent subcellular localization of IR-786 and the effect of mitochondrial membrane potential. (A) NCMs were preincubated with 10 mM FCCP for 5 min then 0.25 μM IR-786 and 2.5 μM rhodamine 123 were added for an additional 15 min. After washing, cells were visualized with the appropriate filter sets. A phase contrast image of the same field, with scale bar, is also shown. The data are representative of four independent experiments. (B) NCMs were incubated with 10 μM IR-786 in the presence of 1 mM ER-Tracker for 15 min. After washing, the same field of living cells was visualized with filter sets appropriate for each fluorophore. A phase contrast image of the same field, with scale bar, is also shown. The data are representative of three independent experiments. (C) T24 human bladder cancer cells were incubated with 1 mM IR-786 (mitochondria-localized), 10 μM IR-786 (mitochondria/ER-localized), or 5 μM rhodamine 123 (mitochondria-localized), either alone (Control) or with a 5-min preincubation period with 10 μM FCCP (+FCCP). The ordinate shows the mean ± S.E.M. fluorophore accumulation as a percent of control cells (N = 3 separate experiments). Also shown is the statistical significance of the difference between Control and FCCP-treated cells using the Student's t test.
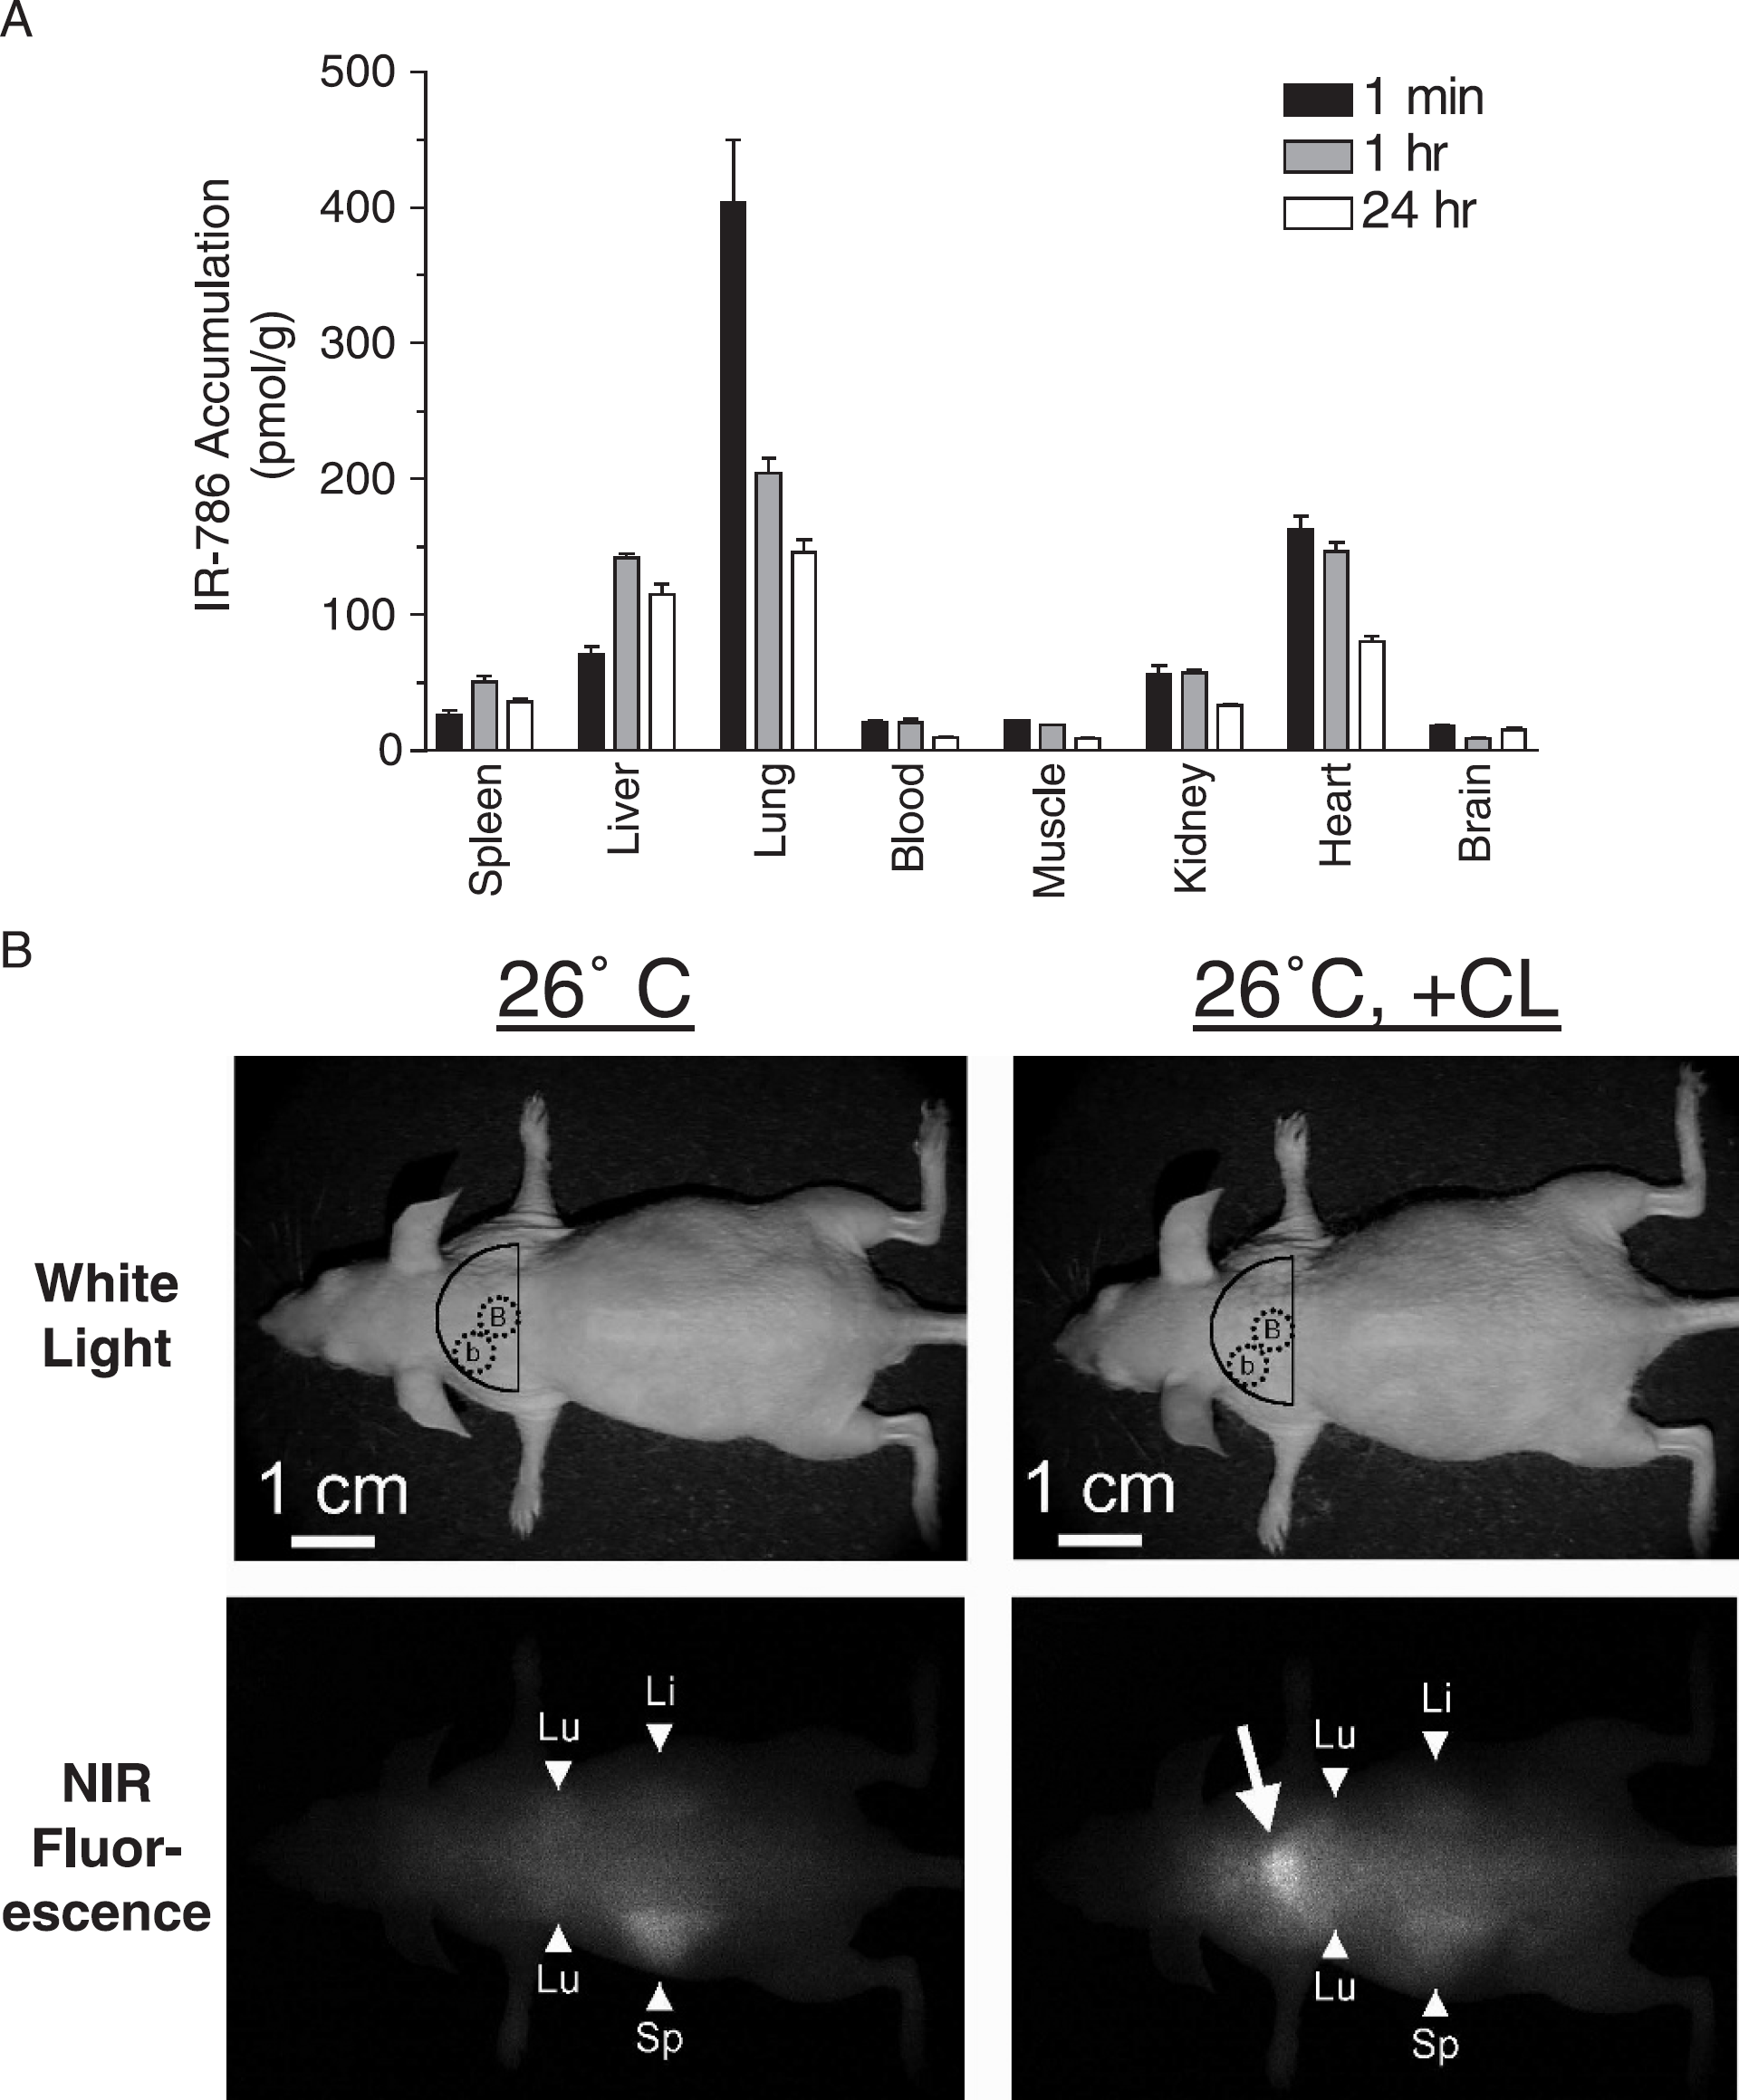
Biodistribution, pharmacokinetics, and in vivo NIR fluorescence imaging of IR-786. (A) The biodistribution and pharmacokinetics of IR-786 was measured as described in Materials and Methods after intravenous injection of 1 nmol into SKH1 mice. Animals were sacrificed at 1 min, 1 hr, or 24 hr after injection, major organs were isolated, and IR-786 accumulation was measured. The mean ± S.E.M. for three independent injections is shown for each time point. (B) NIR fluorescence imaging of BAT in living SKH1 mice using IR-786. Animals were acclimated to 26°C (left) or acclimated then injected intraperitoneally with 1 mg/kg of the β3-specific agonist CL 316,243 (26°C, + CL) 5 min prior to NIR fluorescence imaging using IR-786 injection (see Materials and Methods). For each animal, the white light image (top panels) and NIR fluorescence image (bottom panels) using a excitation fluence rate of 8 mW/cm2 is shown. On the white light image, dotted circles mark the measurement sites of BAT (B) and background (b) signals. Background signals were essentially the same throughout the area marked by the solid semicircle. NIR fluorescence images have identical exposure times (125 msec) and normalization. An arrow marks the high intensity, midscapular NIR fluorescence signal shown at necropsy to be emanating from BAT. Variable IR-786 signal emanating from the lungs (Lu), liver (Li), and spleen (Sp) can also be seen due to NIR light's high photon penetration into living tissue.
The IR-786 NIR fluorescence signal intensity in BAT, as a function of time postinjection, is shown in Figure 5A. Extraction occurs within the first few seconds after intravenous injection, and with repeated measurements, the BAT to background ratio decays over the first 30 min until a stable plateau is reached. This decay phenomenon is likely due to photoconversion of the fluorophore from repeated excitation because similar results have been obtained for repeated cardiac measurements [14] despite biochemical evidence of non-light-exposed fluorophore remaining in tissues for long periods (Figure 4A). Importantly, even after any number of repeat measurements, IR-786 is able to identify increases in BAT activation associated with β3-adrenergic stimulation, with the ratio between control and agonist-treated animals remaining constant at all time points (Figure 5A). For convenience, all subsequent BAT measurements were performed 5 min postinjection of IR-786 with a single light exposure.

Ratiometric quantitation of BAT perfusion in the living animal. (A) Signal characteristics of IR-786 after intravenous injection. The NIR fluorescence signals emanating from BAT and surrounding tissues were measured repetitively over time in the same animal after intravenous injection of 1 nmol of IR-786 at Time = 0. Animals were acclimated to 26°C (Control) or acclimated then injected with 1 mg/kg intraperitoneal CL 316,243 5 min prior to IR-786 injection. The data shown are representative of four independent experiments. (B) NIR fluorescence BAT to background ratio was measured continuously, before and after bolus injection of 1 nmol of ICG, in control animals (Control) or animals injected 5 min previously with 1 mg/kg intraperitoneal CL 316,243 (+ CL). The ordinate shows the ICG BAT to background ratio (mean ± S.E.M.). N = 3 mice for each condition tested. (C) The actual NIR fluorescence images from Figure 5B preinjection (T = 0) and at 5 sec postinjection (T = 5″) are displayed. Images are representative of three separate experiments and are normalized to the + CL, T = 5″ image. (D) Kinetics of CL 316,243 stimulation of BAT perfusion and the effect of overlying skin on NIR fluorescence quantitation. Animals were injected intraperitoneally with 1 mg/kg CL 316,243 for the period of time indicated and were then imaged using IR-786 as described in Materials and Methods. For each animal studied, measurements were made with the skin intact or removed. N = 3 mice per time point. For each time point, the ratios measured with skin intact or removed were compared statistically using the Student's t test, with all comparisons not significant (p < .3). Superimposed (thick line) is the typical laser Doppler flowmetry signal seen during the first 15 min of stimulation. (E) Dose-response curve of β3-specific agonist CL 316,243. The abscissa shows the concentration of CL 316,243 injected intraperitoneally 5 min before measurement with IR-786. The ordinate shows the IR-786 BAT to background ratio (mean ± S.E.M.) measured with the skin intact (black circles) or removed (open circles). Using the Student's t test, there was no statistically significant difference between each pair of measurements. N = 3 mice for each concentration tested.
To verify that IR-786 was partitioning into BAT as a function of tissue perfusion, continuous imaging was used to assess the vascular flush associated with the structurally similar, but di-sulphonated heptamethine ICG. ICG remains intravascular and cannot partition into cells due to its anionic charge. As shown in Figure 5B, when 1 nmol of ICG is injected intravenously, the BAT to background ratio in response β3-adrenergic stimulation increases like IR-786, but unlike IR-786, it peaks within 5 sec and returns to background levels within 30 sec as it is washed out of BAT. The actual NIR fluorescence images for this experiment are shown in Figure 5C. These data demonstrate that optical tracer techniques are capable of detecting changes in BAT perfusion, and that mitochondrial membrane potential is not the primary determinant of NIR fluorescence signal (discussed also below).

Measurement of BAT perfusion in response to modulators of adaptive thermogenesis. (A) SKH1 mice were acclimated to 26° C, exposed to various modulators of adaptive thermogenesis, then imaged using IR-786 NIR fluorescence as described in Materials and Methods. Modulators tested included: no modulator (Control), 1 mg/kg intraperitoneal CL 316,243 imaged at 5 min postinjection (+ CL), 0.3 mg/kg intraperitoneal norepinephrine imaged at 5 min postinjection (+ NE), 4°C exposure imaged at 60 min, and pretreatment with 20 mg/kg intraperitoneal propranolol immediately prior to 60 min of 4°C cold exposure. Images are representative of three separate experiments and are normalized to the highest signal in each group. (B) BAT from the experiment described in (A) was excised and quantitated for IR-786 content as described in Results. The ordinate shows the mean ± S.E.M. of IR-786 concentration (n = 3 mice per condition).
Although NIR light can penetrate several millimeters into living tissue, we wanted to ensure that the skin overlying BAT would not affect the measurement of BAT perfusion. Shown in Figure 5D is the kinetics of BAT perfusion after stimulation with the β3-agonist CL 316,243. BAT perfusion peaked at 10 min post agonist treatment, then decreased to a plateau level of approximately 50% peak perfusion. Measurements made in the same animal with the skin intact or removed were not statistically different (Figure 5D). Importantly, the kinetics of BAT perfusion as measured by IR-786 matched the pattern of increased BAT blood flow as measured by laser Doppler flowmetry, with peak effect seen after 10 min (Figure 5D). To prove that IR-786 NIR fluorescence could be used to measure all levels of agonist-induced BAT perfusion, a dose-response curve for CL 316,243 stimulation was constructed (Figure 5E). This curve was found to be identical to the previously published dose-response curve for glycerol release from brown adipocytes in response to CL 316,243 [18], and once again, measurements were statistically equivalent in the presence and absence of overlying skin (Figure 5E).
Activation of BAT in Response to Modulators of Adaptive Thermogenesis
To prove the general utility of this measurement technique, animals were exposed to various pharmacological and physiologic conditions known to modulate BAT (Figure 6A). All stimuli produced a robust increase in BAT perfusion as measured by IR-786 fluorescence, with excellent detail of BAT anatomy (Figure 6A), although images with the skin intact are slightly blurred due to the effect of photon scatter (also discussed in [13]). Of note, the cold-induced increase in BAT perfusion could be inhibited by a brief pretreatment with the β-adrenergic antagonist propranolol (Figure 6A). This latter result suggests strongly that vascular perfusion, and not mitochondrial membrane potential, is the predominant factor affecting IR-786 extraction into BAT because propranolol would be expected to cause little, if any, decrease in mitochondrial membrane potential or change in mass of the ER. In experiments that require absolute quantitation of IR-786 uptake, BAT can be excised and compared to a standard curve employing IR-786 diluted in control BAT extract (Figure 6B).

Measurement of BAT perfusion in response to modulators of adaptive thermogenesis in transgenic mouse models. (A) Wild-type C57BL/6-129SV mice (WT) were compared directly to C57BL/6-129SV mice harboring a homozygous deletion of the gene for Type II iodothyronine deiodinase (D2KO). Animals were acclimated to 26°C for 16 hr (26°C) or acclimated then exposed to 4°C for 16 hr (4°C). BAT perfusion was then quantitated using IR-786 as described in Materials and Methods. The ordinate shows the BAT to background ratio (mean ± S.E.M.). n = 3 animals for each condition. The different conditions were compared statistically using the Student's t test, with significance shown. (B) Wild-type C57BL/6J-129/SVJ mice (WT) were compared directly to C57BL/6J-129/SVJ mice harboring homozygous deletions for the genes encoding UCP-1 and UCP-2 (UCP-1,2 KO). Animals were acclimated to 26°C for 16 hr or acclimated then exposed 1 mg/kg intraperitoneal CL 316,243 for 5 min (+ CL). BAT perfusion was then quantitated using IR-786 as described in Materials and Methods. The different conditions were compared statistically using the Student's t test, with significance shown.
Measurement of BAT Perfusion in Transgenic Mouse Models
All of the above experiments were conducted in hairless mice. However, most of the interesting questions that can be addressed using the reflectance measurement technique described in this study would require transgenic mice that are not hairless. Hence, we developed a simple protocol for removing the fur overlying BAT (see Materials and Methods). We next determined whether such manipulation affected the measurement of BAT perfusion in response to physiologic and pharmacological stimuli. The change in BAT perfusion in response to cold using wild-type mice and those harboring homozygous deletion of Type II iodothyronine deiodinase is shown in Figure 7A. Knockout mice had similar BAT perfusion at rest, but a severely blunted increase in BAT perfusion after cold stimulation (discussed below).
Because it appeared that IR-786 NIR fluorescence could be used to measure BAT perfusion in transgenic animals, we next asked whether mice with homozygous deletion in both UCP-1 and UCP-2 had altered BAT perfusion. When compared to wild-type animals, knockout animals had a statistically significant increase in BAT perfusion at rest (Figure 7B). However, stimulation with the β3-agonist CL 316,243 resulted in a final level of BAT perfusion identical to wild-type animals (Figure 7B). These data suggest that a compensatory increase in BAT perfusion accompanies functional defects in mitochondrial UCPs.
Discussion
Vascular perfusion is of paramount importance for BAT function. In this study, we present an optical technique for the noninvasive measurement of BAT perfusion using IR-786 and NIR fluorescent light. IR-786 is a lipophilic cation with no other charged groups (Figure 1A). As such, it was predicted and subsequently demonstrated to partition into mitochondria (Figures 2 and 3). IR-786 shares structural homology with both the DiIC1(5) class of mitochondria-localizing fluorophores [24] and the DiIC16(3) class of ER-localizing fluorophores [25]. It is not surprising, therefore, that IR-786 partitions into mitochondria at concentrations below a cell-specific threshold, and into ER above this threshold.
What is surprising is that cellular uptake of IR-786 (and even rhodamine 123) is equivalent before and after dissipation of the mitochondrial membrane potential (Figure 3C); only the subcellular localization changes. This fact ensures that IR-786 is measuring BAT perfusion in vivo, a fact confirmed by comparison to ICG (Figure 5B,C) and laser Doppler flowmetry (Figure 5D). The relatively low concentration of IR-786 used in this study, as well as its rapid first-pass extraction by BAT and other well-perfused tissues (Figure 4A; [14]), also serve to ensure that perfusion, and not mitochondrial membrane potential per se, is the dominant determinant of NIR fluorescence signal. To the best of our knowledge, the mechanism by which cyanine dyes accumulate in the ER is not known precisely [15].
Although conceptually straightforward, the data presented in this study suggest a rather complicated pattern of intracellular uptake and concentration-dependent subcellular localization of IR-786 and a profound effect of chemical environment on its photoproperties. To summarize, after intravenous injection, IR-786 is extracted rapidly by tissue as a function of vascular perfusion and mitochondrial/ER mass. Although NIR fluorescence of IR-786 is affected significantly by chemical environment (Figure 1), BAT perfusion can apparently be measured quantitatively in either a ratiometric (Figures 4B, 5A,D,E, and 7) or absolute (Figure 6B) fashion, provided that measurements are taken at the same time after intravenous injection and provided that both fluorophore photoconversion (Figure 5A) and photobleaching (Figure 1E) are avoided. Ratiometric measurements are particularly convenient, provided that controls for baseline and maximal stimulation are measured during the same experiment. Measurements in animals and tissues having equivalent mass of mitochondria and ER are especially precise.
Another caveat is the potential toxicity of IR-786. Indocyanines are known to inhibit NADH-ubiquinone reductase [26], and in vivo cardiac toxicity has been seen with high concentrations of injected IR-786 [14]. However, we did not observe any apparent acute toxicity with the low concentrations used herein.
The optical imaging method described in this study permits quantitation of BAT perfusion in the living animal in just minutes, without the need for radioactivity, BAT excision, or animal sacrifice. It is the only method of which we are aware that measures the actual transport of a small molecule from the circulation to the intracellular compartment of brown adipocytes, and unlike laser Doppler flowmetry (Figure 5D), it permits measurement of absolute (Figure 6B) rather than just relative changes in perfusion. Coupled with the explosion in transgenics, this optical imaging method may prove useful for high throughput screening of pharmacological modulators of BAT and obesity. It may also prove useful for screening compounds that alter the perfusion of tumors. In our preliminary studies with subcutaneous xenograft tumors, IR-786 accumulation was not significantly different from surrounding normal tissue, providing a low background from which to assess drugs that might increase tumor perfusion.
Finally, we demonstrate the robustness of this method by exploring BAT perfusion in transgenic models of adaptive thermogenesis. Brown adipocytes isolated from transgenic animals harboring homozygous deletion of Type II iodothyronine deiodinase are known to exhibit a blunted response to cold exposure using biochemical assays such as oxygen consumption or glycerol release [18]. We now demonstrate that this knockout also appears to affect BAT perfusion (Figure 7A), suggesting possible synergy between perfusion and BAT biochemical activity along the thyroid axis.
Conversely, a compensatory change in BAT perfusion was found in mice harboring homozygous deletion of both UCP-1 and UCP-2 (Figure 7B). In this case, perfusion to BAT at rest was increased, likely in an attempt to maintain body temperature. The increased NIR fluorescence signal seen at rest was unlikely due to an increase in mitochondrial membrane potential given the results cited above and the fact that vascular agents such as ICG (Figure 5B,C), which do not partition into cells, given essentially identical results as IR-786, albeit with different biodistribution and kinetics. Interestingly, there was no statistically significant increase in perfusion in response to β3-specific agonist CL 316,243 in these animals (Figure 7B), which is consistent with previously published results showing a blunted response in isolated brown adipocytes from UCP-1 deficient mice [27]. These data suggest redundancy and/or independent control of mitochondrial uncoupling and BAT perfusion. Future studies will be needed to address the specific mechanisms underlying these observations.
Footnotes
Acknowledgments
We thank Leslie P. Kozak (Pennington Biomedical Research Center, Baton Rouge, LA) for UCP-1 knockout mice, Roger J. Hajjar (Massachusetts General Hospital) for rat NCMs, Michael A. O'Donnell (University of Iowa) for bladder cancer cell lines, Michael Chorev (BIDMC) for use of the SPEX spectrofluorometer, Muneed Ahmed and S. Nahum Goldberg for assistance with laser Doppler measurements, Alec M. DeGrand for technical assistance, and Grisel Rivera for administrative assistance. This study was supported by a Clinical Scientist Development Award from the Doris Duke Charitable Foundation (nonanimal experiments), Department of Energy (Office of Biological and Environmental Research) Grant DE-FG02-01ER63188, the Paul D. and Lovie S. Kemp Career Development Fund for Prostate Cancer, and the Hershey Family Foundation.