
Abstract
[18F]SynVesT-1 is a PET radiopharmaceutical that binds to the synaptic vesicle protein 2A (SV2A) and serves as a biomarker of synaptic density with widespread clinical research applications in psychiatry and neurodegeneration. The initial goal of this study was to concurrently conduct PET imaging studies with [18F]SynVesT-1 at our laboratories. However, the data in the first two human PET studies had anomalous biodistribution despite the injected product meeting all specifications during the prerelease quality control protocols. Further investigation, including imaging in rats as well as proton and carbon 2D-NMR spectroscopic studies, led to the discovery that a derivative of the precursor had been received from the manufacturer. Hence, we report our investigation and the first-in-human study of [18F]SDM-4MP3, a structural variant of [18F]SynVesT-1, which does not have the requisite characteristics as a PET radiopharmaceutical for imaging SV2A in the central nervous system.
1. Introduction
[18F]SynVesT-1 (a.k.a. [18F]SDM-8 or [18F]MNI-1126) is a PET radiopharmaceutical that binds to the synaptic vesicle protein 2A (SV2A) and is considered to be a biomarker of synaptic density [1]. This target is ubiquitous throughout neuron-populated brain regions [2], and studies using a carbon-11 labeled derivative, [11C]UCB-J, have found reduced SV2A binding across diverse disorders including depression [3], Alzheimer’s disease [4], cannabis use disorder [5], schizophrenia [6], and Parkinson’s disease [7]. First-in-human studies of [18F]SynVesT-1 conducted at the Yale PET Center yielded excellent brain volume of distribution (
To our surprise, a concurrent human pilot study conducted at the Centre for Addiction and Mental Health (CAMH) did not yield comparable results to the [18F]SynVesT-1 PET imaging studies carried out at the Yale PET Center (vide supra). Here, we report a subsequent investigation of the radiosynthesis and human imaging pipeline, supported by rodent imaging experiments, from which we concluded that a 4-methylpyridin-3yl precursor material had been provided to CAMH from a commercial supplier, instead of the expected 3-methylpyridin-4yl-based precursor. The structural differences between the radiolabeling precursors were subtle enough for the resulting new radiopharmaceutical, [18F]SDM-4MP3, to pass the routine quality control protocols, and it was not metabolized in a significantly different way from [18F]SynVesT-1. However, major differences were observed upon initial human brain PET imaging studies. Once the erroneous precursor was identified, pilot scans were undertaken in two additional participants using product synthesized from the correct precursor, producing results consistent with the original observations from PET imaging with [18F]SynVesT-1 [8].
2. Materials and Methods
2.1. Radiotracer Synthesis
The [18F]SDM-4MP3 radiolabeling precursor, identified as SDM-8 tin precursor according to the Certificate of Analysis (CoA) (product no. 3425.0002.500, manufactured June 2019), was obtained from ABX Advanced Biochemical Compounds GmbH (Radeberg, Germany). Radiopharmaceutical synthesis was performed on-site at CAMH according to the published method for [18F]SynVesT-1 [12]. Coinjections of radiolabeled product [18F]SDM-4MP3 with SynVesT-1 reference standard on reverse phase HPLC (Luna C18
2.2. Human Brain PET Studies
All human components of the study were approved according to the Research Ethics Board for Human Subjects at CAMH (CTA 125, REB 075/2019). All participants were recruited from the community and provided written informed consent. Participant inclusion criteria were self-report of good health. Exclusion criteria included any history of neurological or psychiatric disorder; cognitive impairment according to MoCA assessment (score less than 26); pregnancy and/or nursing; and disorders of coagulation, blood, or ongoing use of anticoagulant medication. Each participant’s height, weight, current medications, and smoking status was recorded. Participants abstained from taking dopaminergic medications, including aspirin [13], for 24 hours prior to the PET exam (see Table 1).
Participant information and injection parameters.
2.2.1. PET Imaging
Participants were scanned on a 5-ring GE Discovery MI PET/CT (GE Healthcare Technologies, Chicago, Illinois). Participants 1 and 2 (P1 and P2) were scanned with [18F]SDM-4MP3 (the radiopharmaceutical synthesized from the ABX precursor), and [18F]SynVesT-1 (synthesized from the Yale precursor) was used for PET imaging of participants 3 and 4 (P3 and P4). A thermoplastic facemask (Tru-Scan Imaging, Annapolis) was used to restrict head motion within the PET scanner bore. CT was used to acquire a scout scan, followed by a low-dose scan for attenuation correction. The radiopharmaceutical (target dose
2.2.2. Arterial Input Function Measurement
The arterial line was placed into the radial artery by a qualified respiratory therapist. Up to 160 mL of arterial blood was collected via automated blood sampler (ABSS, Comecer PBS-101) and via manual samples for plasma metabolite correction. The ABSS protocol was started ~15 s after emission scan start, and pump speed was set to 300 mL/h, to reduce dispersion in ABSS lines during maximum rate of change of arterial activity concentration, at 1 s sampling period for 5 min and 2 s sampling period for 136 s. Pump speed was decreased to 180 mL/h at a sampling period of 5 s for the following 360 s and a sampling period of 10 s for 540 s, for a total sampling time of 22 min and 16 s. Manual samples were collected at baseline, 2.5, 7, 12, 15, 20, 30, 45, 60, 90, and 110 min relative to emission scan start into PTFE tubes, followed by a saline flush for all except 2.5- and 7-min samples to avoid discontinuities in arterial data during peak uptake.
Baseline whole blood samples were centrifuged at 3100 RPM at room temperature for 5 min to extract plasma. Plasma supernatant was centrifuged for 20 min at 1100G at 22°C to extract filtrate for protein binding analysis. Each subsequent manual sample was centrifuged at 3900 rpm at 4°C for 5 min, and 0.3 mL of whole blood and 0.3 mL of plasma were extracted and measured on a gamma counter (Wizard 2480, Perkin Elmer, Turku, Finland) to quantify activity concentration.
(1) Column-Switching HPLC. Plasma analysis was adapted from a column-switching HPLC method developed by Luthra and Hilton and coworkers [14, 15], as previously described [16]. To separate parent compound from radiometabolites, plasma was treated with urea and centrifuged (3900 rpm, 4°C, 5 min) under experimental conditions described for [11C]UCB-J [17]. Samples were initially analyzed in capture mode with the capture solvent flow rate of 1.8 mL/min for 4 min before switching to analysis mode with the analysis solvent running at 1.8 mL/min for an additional 12 min. The metabolite-corrected arterial input function was calculated as the product of the dispersion-corrected, merged (automatic and manual), and smoothed plasma activity curve and the smoothed parent fraction curve using in-house software [18, 19].
2.2.3. Magnetic Resonance Imaging
A routine T1-weighted anatomical scan (BRAVO sequence, GE Healthcare, 3T Discovery MR750) was acquired for anatomical coregistration as part of a 1-hour MRI protocol. Resolution was 0.9 mm isotropic;
2.2.4. PET Image Processing
(1) Image Registration and Region of Interest. PET images were registered to the subject’s corresponding
(2) Quantitative Analysis. Regional standard uptake value ratio (SUVR) for each ROI was computed by measuring the frame-duration weighted average TACs between 60 and 90 min, divided by the value obtained for the CS. SUVR images were created from frame-duration weighted average activity between 60 and 90 min, the optimal window investigated in Naganawa et al. [8], using centrum semiovale as a reference region [11]. Regional volume of distribution (
2.3. Preclinical PET Imaging Studies
Preclinical PET imaging studies were approved by the Animal Care Committee at CAMH (Animal Use Protocol #838). Six adult Sprague-Dawley rats were scanned for 120 min on either a Mediso nanoScan PET/MR 3 T or PET/CT scanner (Budapest, Hungary), and the images were analyzed using VivoQuant® software (version 4.1, Invicro LLC, Needham, MA, USA), as described previously [20]. Five rats (3 M/2F,
2.4. Molecular Structure
Reverse-phase C18 and reverse-phase chiral HPLC analysis of [18F]SDM-4MP3 were performed as described (vide supra). LC-MS was performed on an Advion Expression L MS using atmospheric pressure chemical ionization (APCI). 1H and 13C NMR spectroscopy were carried out at the CSICOMP NMR Facility, University of Toronto, using either a Bruker Avance III 400 MHz or Agilent DD2 500 MHz NMR spectrometer.
3. Results and Discussion
Four healthy participants were recruited, of which two (70 F and 44 F) received [18F]SDM-4MP3 and two (50 F and 67 M) received [18F]SynVesT-1. Chronologically, the [18F]SDM-4MP3 human imaging with P1 occurred first, and the unexpected results triggered the imaging of the second pilot subject, P2, followed by the comparison experiments with [18F]SynVesT-1 precursor acquired from Yale or Pharmasynth. Retrospective investigations were undertaken using several methods to assess potential causes of the discrepancy in human imaging results. It was verified that the correct (
[18F]SDM-4MP3 was synthesized in radiochemical yields of
A static image of the 120 min dynamic scan showing the average activity concentration for the first [18F]SDM-4MP3 recipient (P1) is shown in Figure 1. Although, as expected, there was greater average activity concentration in the synapse-rich gray matter than the white matter, the contrast between gray and white matter in this subject can be explained by differences in blood volume alone [21]. The large difference in SUVR is apparent in a side-by-side comparison of the SUVR images from [18F]SDM-4MP3 and [18F]SynVesT-1 (Figures 2(b) and 2(c) vs. Figures 2(d) and 2(e)), where SUVR for [18F]SDM-4MP3 was under 2 throughout the brain, and greater than 7 in cortical regions for [18F]SynVesT-1.

120-minute static image (SUV units) for the first participant (P1), injected with [18F]SDM-4MP3, scaled to maximum observed SUV.

Average axial views in MNI space. (a) MRI shown for reference of SUVR, 60-90 min, centrum semiovale reference tissue, for subjects imaged with [18F]SDM-4MP3 (b, c), and [18F]SynVesT-1 (d, e).
Figure 3 shows the TACs for the frontal cortex, putamen, hippocampus, cerebellum, and centrum semiovale for a representative PET scan with [18F]SDM-4MP3 and [18F]SynVesT-1 in a participant (P1 and P3, respectively). Following injection of [18F]SDM-4MP3, despite high initial brain penetration (SUV of ~7) consistent with expectations, the peak occurred much earlier (2.5 min vs. 20 min), and the radiopharmaceutical showed rapid clearance from brain in sharp contrast to that based on previous human PET data observed (Figure 3; dotted line) and expected [8] for [18F]SynVesT-1. In fact, the [18F]SDM-4MP3 TACs appeared more like the blocking study data, suggesting that specific binding was minimal or absent. Nevertheless, the initial high peak activity concentration for [18F]SDM-4MP3 was evidence that the intended dose was delivered during injection and was able to reach the brain, albeit radiotracer binding to brain tissue vs. free in plasma was not determined.

Time-activity curves (SUV units) for an example human subject for [18F]SDM-4MP3 (solid line) and [18F]SynVesT-1 (dotted line). Data is from P1 and P3.
Once it was confirmed that there were no issues with radiopharmaceutical injection and PET image processing, physiological differences were considered. It was noted that P1 (70 y.o. female) was significantly older than the subjects previously reported with [18F]SynVesT-1 PET scans in healthy controls (males,
Differences in metabolism for both radiopharmaceuticals in blood were subsequently assessed. Radiometabolite peaks for [18F]SynVesT-1were qualitatively very similar at both of our laboratories (not expected to be identical at CAMH and Yale due to differences in equipment and procedure, but the number of peaks and relative proportions were quantified). We also compared the radiometabolites between [18F]SDM-4MP3 and later scans that were conducted with [18F]SynVesT-1 (Figure 4), which had similar results. The rate of radiometabolism was slightly slower with [18F]SDM-4MP3 (Figures 4(b) and 4(e)). Minor differences were ascribed to participant metabolism and pressure differentials affecting the retention times in the column-switching HPLC.

Example arterial blood results comparing [18F]SDM-4MP3 to [18F]SynVesT-1. (a) HPLC radiochromatogram from the 60 min discrete plasma sample, (b) parent fraction from all manual samples, (c) arterial plasma input function for [18F]SDM-4MP3. (d) HPLC radiochromatogram from the 60 min discrete plasma sample, (e) parent fraction from all manual samples, (f) arterial plasma input function for [18F]SynVesT-1.


The arterial input function was typical in appearance for [18F]SynVesT-1 [24] (Figures 4(c) and 4(f)). Overall, differences in blood were considered unlikely to account for brain uptake differences at this stage. To confirm this, kinetic quantification was performed using the arterial input functions generated for [18F]SDM-4MP3. A reasonable fit to the one-tissue compartment model was obtained, yielding
Having ruled out human factors in imaging (differences between participants, errors in acquisition and analysis), a preclinical PET imaging investigation was carried out. A 0-120 min static image of [18F]SDM-4MP3 uptake in rat, using precursor from the commercial supplier, showed very limited brain uptake (Figure 5(b)), which was barely above tissues outside of the brain. In contrast, images from [18F]SynVesT-1 acquisition, using precursor obtained from Yale, showed high brain uptake with SUVs close to 8 (see Figure 5(c) for an example), consistent with previously reported results in rodents [15]. The TACs for both radiotracers are compared in Figure 5(a). To a greater extent than the human data, the initial peak uptake in the rodent brain was reduced from

Preclinical comparison of [18F]SDM-4MP3 and [18F]SynVesT-1 in rats. (a) Whole-brain time activity curves from 0-120 min postinjection. Blocking study data from [18F]SynVesT-1 was acquired 15 min following injection of 30 mg/kg levetiracetam, summed 120 min images showing uptake of (b) [18F]SDM-4MP3, (c) [18F]SynVesT-1, and (d) [18F]SynVesT-1 under levetiracetam blocking condition.
An investigation comparing the precursor from ABX with precursor lots synthesized at Yale and PharmaSynth AS using LC-MS showed that all three precursors had a similar retention time (3.30-3.32 min), and the same molecular mass of 448 g/mol (

HPLC chromatograms (a) and mass spectrometry (MS) analysis (b) from precursors obtained from ABX and Yale. Precursor from an alternative commercial supplier (PharmaSynth) was also tested but was not appreciably different from the lot obtained from Yale (data not shown). The retention times for both samples were 3.30 min (ABX) and 3.31 min (Yale). The fragmentations seen in the mass spectra are similar, albeit with differing intensities,

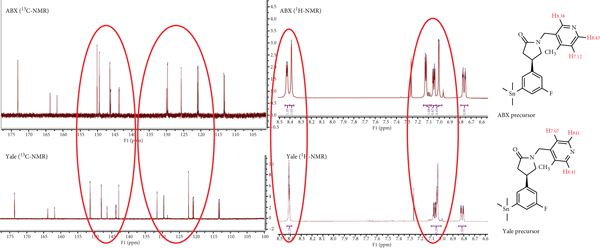
13C and 1H NMR spectra of precursors obtained from ABX and Yale (aromatic region shown with discrepancies outlined in red). Annotated protons for the pyridine ring for both precursors shown on the right. Precursor lot from PharmaSynth was also tested but was not appreciably different from the Yale lot (data not shown).

(a) Simplified synthesis route of the precursors by Yale and PharmaSynth and radiosynthesis of [18F]SynVesT-1 ([18F]SDM-8). Nitrogen in pyridinyl ring is shown in blue. (b) Simplified synthesis route of the precursor by ABX and radiosynthesis of [18F]SDM-4MP3. Differentiating pyridinyl nitrogen is shown in green. Reaction conditions for radiosynthesis: Cu(OTf)2, pyridine, [18F]KF, DMAc, 110°C, 20 min.

It was later confirmed by ABX that the wrong material was delivered due to an incorrect reagent being used during the synthesis of the precursor material ((4-methylpyridin-3-yl)methanol was incorrectly used instead of (3-methylpyridin-4-yl)methanol). Previously published in vitro binding assays had revealed a loss of affinity to SV2A for SDM-4MP3 (SynVesT-1
4. Conclusions
Anomalous imaging results from an [18F]SynVesT-1 PET study spurred the discovery of incorrectly synthesized precursor material from a commercial vendor, resulting in an inadvertent first-in-human trial of the 4-methyl-pyridinyl analogue of [18F]SynVesT-1, namely, [18F]SDM-4MP3.
Footnotes
Data Availability
Supporting data is available upon request by contacting the corresponding authors.
Conflicts of Interest
A.P.S. is a consultant for Hoffman La Roche and received honoraria from GE Health Care Canada Ltd. and Hoffman La Roche.
Acknowledgments
We thank the Michael J. Fox Foundation grant ID 15978 and the Weston Brain Institute for cofunding this project. C.U. was supported by the European Union’s Horizon 2020 research and innovation programme under the Marie Sklodowska-Curie grant agreement 888692. A.P. S. is supported by the Canadian Institutes of Health Research (CIHR) (PJT-173540) and the Krembil-Rossy Chair program. N.V. thanks the Azrieli Foundation, Canada Foundation for Innovation, Ontario Research Fund, and the Canada Research Chairs Program.