
Abstract
Disputes between retailers and manufacturers often result in the retailer delisting the manufacturer's products, which dramatically alters competition in the retail market. When rival products are temporarily delisted, the products remaining on retail shelves are expected to gain sales due to substitution. However, it is unclear how much sales gain of remaining products can be expected, how long the sales gain persists after the rival products are relisted, whether the sales gain varies in different product categories, and whether the sales gain spills over from the delisting retailer to nearby retailers. In this research, we exploit a natural experiment enabled by a dispute between a retail chain and a beverage manufacturer that resulted in a 4‐week delisting of all products by the manufacturer (the delisted manufacturer) across all of the retailer's U.S. stores. We focus on a manufacturer (the focal manufacturer) that directly competes with the delisted manufacturer and quantify the sales gain for this focal manufacturer during the delisting and after the relisting event. Interestingly, in a near‐duopoly market, the focal manufacturer only gained 12.2% of sales during the delisting. After the dispute was settled and competition restored, the focal manufacturer's sales fluctuated for about 2 months before returning to the pre‐delisting level. Additionally, we find a spillover in sales gain to nearby stores during the delisting, which was mainly to small‐box retail stores rather than big‐box stores. Moreover, at both delisting and nearby stores, we find the focal manufacturer's sugar‐sweetened, caffeinated, and star products gained sales during the event while other products did not. We check the robustness of our results with a machine learning nonparametric method, among a few other alternative methods, to measure the average treatment effects. Understanding the size and duration of these heterogeneous effects can help manufacturers and retailers better respond to changes in market competition and evaluate their delisting decisions.
Keywords
INTRODUCTION
Maintaining an adequate supply of products on the shelves is imperative to retail success. Products, however, may become unavailable for many reasons, such as inventory management failure, disputes between buyers and suppliers, and supply chain disruptions like the COVID‐19 pandemic. Among these, conflict delisting is an important yet understudied trigger of product unavailability. Most often, a conflict delisting is imposed by a retailer as an intentional means to pressure a manufacturer into a more favorable purchase agreement. For instance, in response to price increases by the manufacturer Unilever, Kaufland, a German retail chain, dropped all Unilever products at the end of 2018 and only restocked Unilever's products in November 2019 after reaching a new agreement (Askew, 2019; Prance‐Miles, 2019). In January 2020, French retail chains, Intermarche and Netto, temporarily delisted Coca‐Cola products until a new agreement was reached in March 2020 (Archyde, 2020).
Despite the importance of conflict delisting to the retailing and manufacturing industries, it has not been studied as extensively as other causes of product unavailability. Understanding the impact of the conflict delisting on products that remained on shelves provides critical information to the management of the delisting retail stores, their competing stores, and the manufacturers that supply products competing with the delisted products. In this paper, we consider a conflict delisting between a retail chain's stores (the delisting stores) and a manufacturer (the delisted manufacturer) and study the sales gain for manufacturers (the focal manufacturer) whose products (competing with the products of the delisted manufacturer) remain available during the delisting and the spillover from delisting stores to nearby non‐delisting stores. More importantly, we study the sales changes not only during the delisting but also afterward when the products are relisted and competition is restored.
We consider the influence of the delisting on the focal manufacturer that offers products competing with the delisted manufacturer. When the delisting occurred, affected consumers could switch to different stores or products from another manufacturer (such as the focal manufacturer in our study), postpone, or cancel their purchase. Intuitively, we expect the focal manufacturer to benefit from the conflict delisting due to the substitution. However, it is still worth exploring the sources of the sales gain for the focal manufacturer. Does the focal manufacturer gain sales equally across various product categories? Does it gain sales only from the delisting stores or also from nearby stores due to the spillover? Does it gain sales from nearby big‐box stores, nearby small‐box stores, or both retail formats? In addition, we examine whether the sales gain persists into the relisting period (after the delisting ends). After the delisting was settled and the delisted manufacturer's products were relisted, will the sales of the focal manufacturer's products return to or differ from the pre‐delisting level? Do sales after relisting change smoothly or fluctuate? These questions have not been addressed in the extant literature. To fill this gap, we study the changes in sales experienced by a manufacturer (the focal manufacturer) following a highly publicized conflict delisting between a major retailer (the delisting retailer) and a major beverage manufacturer (the delisted manufacturer). As a result of a disagreement over prices (more details are provided in Section 3), the delisting retailer delisted all of the rival manufacturer's products at all of its U.S. stores.
We study the sales changes experienced by the focal manufacturer following the conflict delisting of rival products. To quantify the impact of the delisting on the focal manufacturer, we undertake a thorough investigation via the difference‐in‐differences (DID) approach at the focal manufacturer's sales at the stock keeping unit (SKU) level in the periods before, during, and after the conflict delisting. Our research shows that the focal manufacturer gained 12.2% sales at the delisting stores while its rival was delisted. Given the rival manufacturer's dominant market share in the soft drink category, the focal manufacturer's sales gain in the absence of intense competition from the rival manufacturer is lower than expected.
Apart from quantifying the size of the sales gain for the focal manufacturer during the delisting, we examine whether the focal manufacturer's sales gain would linger after the conflict is resolved. Interestingly, the focal manufacturer's sales gain carried over into the relisting period. When unpacking the carryover effects into weekly measures, even after the rival products are relisted, the sales gain did not immediately disappear. Instead, the focal manufacturer's sales fluctuated for about 2 months before stabilizing at its pre‐delisting level. The duration of postevent fluctuation (7 weeks) was nearly twice as long as the delisting event itself.
In addition, as the conflict delisting may have led some shoppers to switch stores, we extend our analyses to the sales impact on the stores geographically close to the delisting stores. We define the local market with a circle of a 1‐mile radius (or a 5‐mile radius for robustness checks) around the delisting store and study the impact of conflict delisting at these nearby stores. We find a 3.0% increase in the focal manufacturer's sales at the nearby stores during the delisting, confirming the existence of spillover effects.
We also explore the heterogeneous impact of the delisting event across the focal manufacturer's products with different popularity, ingredients, and function. Our results show that the focal manufacturer's sugar‐sweetened products, diet (artificially sweetened) products, caffeinated products, and popular products at the delisting stores all had significant sales gains during the delisting. Moreover, we find a heterogeneous impact of the conflict delisting across retail types of nearby stores. Specifically, the focal manufacturer benefited mainly at the nearby small‐box stores during the delisting, whereas its sales at nearby big‐box retail stores did not change significantly. At the nearby stores, we again find that sales for sugar‐sweetened, caffeinated, and popular products all significantly increased during the delisting but eventually returned to pre‐delisting levels after the rival was relisted.
We check the robustness of our results with ample tests, including the application of a machine learning nonparametric method to measure the average treatment effects. We also test our findings with different time windows and with local markets of a greater radius. The preexisting time trends and confounding changes in prices and product variety are also examined and excluded.
Our findings provide a better understanding for both retailers and manufacturers regarding the size and dynamics of sales changes due to the conflict delisting. Our study sheds light on the influence of conflict delisting on the remaining products at the delisting stores as well as nearby stores, thereby enabling remaining manufacturers to fully utilize the sales opportunities at all affected stores. The affected manufacturers and retailers can improve their demand forecast and inventory management in response to the conflict delisting. Our study also offers insights into the heterogeneous effects depending on product characteristics and retail types, which are particularly helpful for manufacturers with a large portfolio of products who sell their products to stores with various product assortments.
RELATED LITERATURE
A common reason for product unavailability is inventory management failure (Zipkin, 2000), which has been extensively studied in the operations literature. Related topics include the bullwhip effect (Croson & Donohue, 2006; Lee et al., 1997; Wan & Evers, 2011), channel integration (Gallino & Moreno, 2014; Gallino et al., 2017), logistics (Cui et al., 2020; Wan et al., 2018), product assortment (Gaur & Honhon, 2006; Wan et al., 2012; Zhou & Wan, 2017), etc.
Conflict delisting gives rise to a unique type of temporary product unavailability, which differs from inventory management failure regarding information availability, duration, and affected SKUs. Stockouts at retail stores caused by inventory management are not easily observable by competing stores, have short‐term effects (i.e., an order replenishment cycle), and affect one or very few SKUs. However, a conflict delisting, if made public, may become known to all, takes a long time to settle, and removes all SKUs from a supplier. Therefore, compared to an inventory management failure, conflict delistings have a larger and longer impact on retail sales. Furthermore, investigating the effects of conflict delisting will enable retail stores and manufacturers to understand the size and duration of the delisting impact on their competitors.
The extant literature about conflict delisting is limited and mainly focuses on changes in market share and consumer behaviors of the manufacturers and retailers directly involved in the dispute. Van der Maelen et al. (2017) find that both the manufacturer and the retailer involved in a conflict delisting lose sales, and the retailer is more vulnerable than the manufacturer. After the delisting, the delisting retailer's market share eventually recovered to the previous level, but the manufacturer's share sustained a long‐term rise. Davies (1994) recognizes some influential factors in retailers’ delisting decisions, such as age, experience, and size of retailers and product types.
In this study, we extend the literature on conflict delisting by examining the size and duration of its impact on the products remaining on the shelves and its spillover effects to nearby stores. From the focal manufacturer's perspective, we examine its sales changes during and after the delisting of its rival manufacturer. We add substantive findings concerning the impact of conflict delisting on remaining products’ sales at the delisting stores. Additionally, we expand our analyses to the stores geographically close to the delisting stores and test whether a spillover effect exists from the delisting stores to nearby stores. We also report findings regarding the heterogeneous treatment effects across different product nutritions, functions, and popularity, and across different retailer types. Our empirical findings provide vital insights for similarly situated manufacturers and retailers to improve their marketing and inventory decisions.
CONTEXTUAL BACKGROUND AND THEORETICAL DEVELOPMENT
Contextual background
Our research focuses on the sales changes for a major U.S. beverage manufacturer (the focal manufacturer) resulting from the conflict delisting of a rival's products by a major retail chain. The rival beverage manufacturer competes head‐to‐head with our focal manufacturer. The focal and rival manufacturers both own large market shares in the U.S. soft drink industry (both of them account for more than 70% of the market share in the United States). Both manufacturers produce a variety of products that compete in various retail formats. Most U.S. retail stores carry products from both manufacturers.
The retail chain involved in the dispute is a members‐only wholesale club chain. In November 2009, a dispute occurred when the retail chain was dissatisfied with the wholesale prices offered by the rival manufacturer. As a result, the retailer decided to delist all SKUs produced by the rival manufacturer from its U.S. stores by not placing any new orders beginning on Monday in the third week of November 2009 (the 47th week of the year). The delisting retail chain posted notes on their shelves that used to store delisting products to notify consumers about the delisting. The rival manufacturer immediately confirmed the delisting in a public statement on the same day. The conflict delisting lasted for 4 weeks until an agreement was reached in the 50th week, and the delisting retail chain announced the rival manufacturer's products would be relisted on Monday in the second week of December 2009 (the 51st week of the year). Many national newspapers, websites, and TV channels reported this conflict delisting. During the 4 weeks of delisting, consumers could still purchase the delisted products by visiting other stores. The timeline of delisting and relisting is plotted in Figure 1. Based on the competition encountered by the focal manufacturer, we distinguish three time periods: a pre‐treatment (pre‐delisting) period with normal competition, a treatment (delisting) period with reduced competition, and a post‐treatment (relisting) period with restored competition.
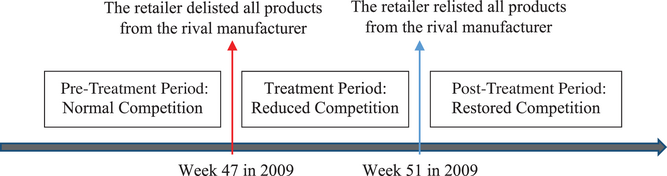
Timeline of delisting and relisting.
The temporary delisting and relisting of the rival manufacturer's products at the retailer chain generated a unique opportunity to study the impact of drastically changed competition on the sales of the focal manufacturer. The focal manufacturer's products were in “head‐to‐head” competition with the delisted manufacturer's products. The delisting led to an instant reduction of competition for the focal manufacturer's products in the delisting stores. Conversely, the relisting instantly restored competition. During the 4 weeks of conflict delisting, there were no other retail chains that delisted products of the focal or rival manufacturers. Therefore, the impact of the changed competition is not affected by any other delisting events. This conflict delisting enables us to investigate the short‐ and long‐term changes in the focal manufacturer's sales when facing temporarily reduced competition due to the absence of rival products.
Conceptual development
Two competing manufacturers are involved in our study, and we are interested in the sales changes at both delisting and nearby stores over three periods. To clarify the who, when, and where of the sales changes, in this subsection, we use streamlined models to illustrate consumer decisions at each pair of manufacturer and store in each period and link them to the consumer migration between manufacturers and stores.
First, we show the changes in the focal manufacturer's sales at both delisting stores and nearby stores in the three time periods: pre‐treatment (normal competition), during treatment (reduced competition), and post‐treatment (restored competition), as shown in Figure 2. For simplicity, we assume there are only two manufacturers on the market—the focal manufacturer and its rival. The consumer's preference falls on a Hotelling line (Hotelling, 1929), and the sales on switching shoppers are equally split between the focal and rival manufacturers. The length of the horizontal lines in Figure 2 represents sales. The pre‐delisting sales of both focal and rival manufacturers are set arbitrarily.
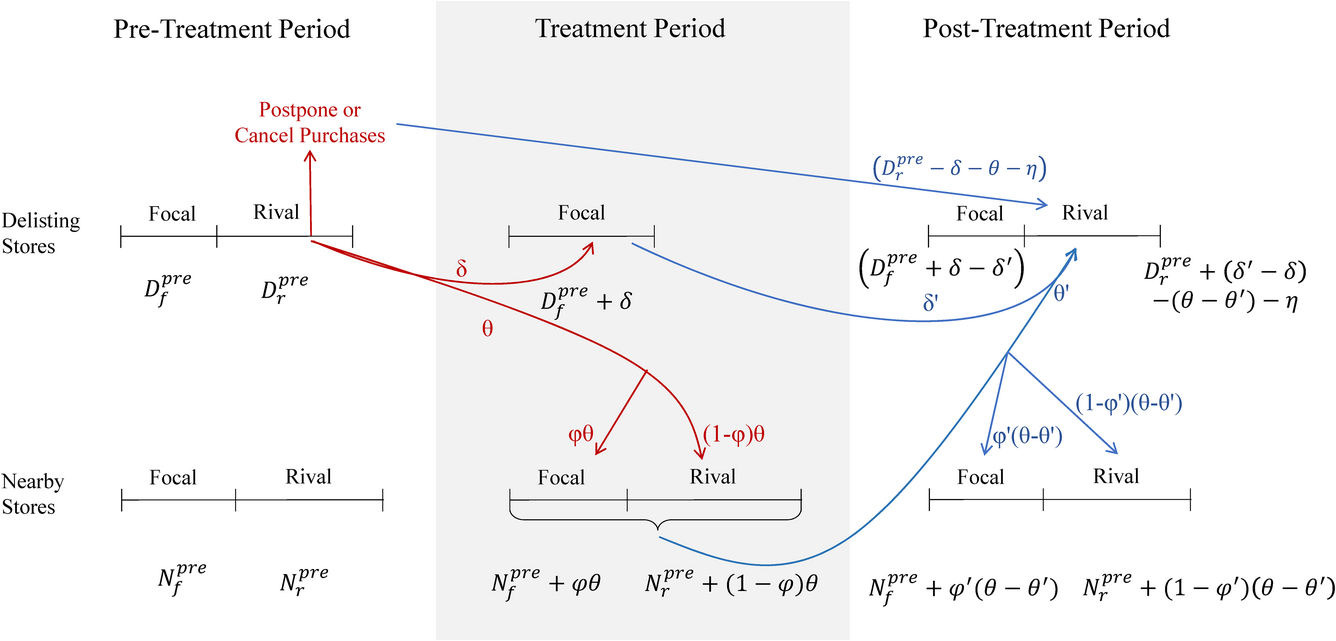
Theoretical illustration.
Period 1: Pre‐Treatment
We use


Sales in three periods
Period 2: During the treatment
After the dispute between the rival manufacturer and the delisting store occurred, all of the rival's products were delisted at all delisting stores. The consumers who once purchased the rival's products were forced into a decision among (1) switching to the focal manufacturer's products at the delisting stores, (2) traveling to nearby stores to purchase, and (3) postponing or canceling the purchase. We denote the sales made by consumers who switched to the focal manufacturer at the delisting stores with δ, the sales by consumers who traveled to nearby stores with θ, and, accordingly, the sales that were lost due to postponed or canceled purchase are 

For the consumers who traveled to nearby stores, most of them would purchase the rival products as planned. However, a small portion of them, marked with a percentage φ, would eventually purchase the focal manufacturer's products for two reasons: first, because the delisting stores only carry a small assortment of popular products, consumers once traveled to nearby stores would find a large assortment to choose from and may purchase a niche product from the focal manufacturer instead. Second, as the demand for the rival products suddenly surged at the nearby stores, the rival products could run out of stock, so that some of the loyal consumers to the rival products would be crowded out to purchase the focal manufacturer's products.
1
For both reasons, the focal manufacturer may gain sales at nearby stores due to the conflict delisting, denoted as φθ. The remaining sales from consumers who traveled to nearby stores are (1 − φ)θ, allocated to the rival manufacturer. If the traveling consumers facing stockouts decided to postpone or cancel their purchase, they are also merged into 


Period 3: Post‐Treatment period
When the rival manufacturer and the delisting retail chain reached an agreement, the delisting ended and the post‐treatment period began. At the delisting stores, the consumers who postponed or canceled their purchase of the rival products during the conflict delisting could resume their purchase, bringing back the sales of 


At the nearby stores, the permanent sales gain 


Hypothesis development
Our research focuses on the changes in the focal manufacturer's sales to the delisting retail chain and nearby stores. Such sales changes at the retailer level are rooted in consumer decisions due to the delisting and relisting. During the delisting (the treatment period), all of the rival's products were delisted and became unavailable at all delisting stores. Product availability affects consumer loyalty (Heim & Sinha, 2001). The consumers who previously purchased the rival's products can be grouped into one of three categories, those who (1) switched to the focal manufacturer's products at the delisting stores, (2) traveled to nearby stores to purchase products of the rival and/or the focal manufacturer, or (3) postponed or canceled the purchase.
The first category of consumers contributed to the sales changes of the focal manufacturer's products in the treatment and post‐treatment period. During the treatment period, the first category of brand‐switching consumers rendered a sales gain for the focal manufacturer at the delisting stores. Therefore, we expect a sales gain for the focal manufacturer at the delisting stores. When a competitor's products are delisted in some retail stores, the product sales of the focal manufacturer to these delisting stores increase.
After the rival manufacturer and the delisting retail chain reached an agreement, the rival products were relisted, marking the end of the treatment period and the beginning of the post‐treatment period. Although the focal manufacturer's sales are expected to decrease after relisting due to the return of rival products, it is still unclear that (1) whether the focal manufacturer's sales gain would completely disappear or even drop below the pre‐delisting level, (2) what is the pattern of the sales decrease (a smooth decline or a fluctuating decline), and (3) if the sales gain would eventually disappear, how long it carries over into the relisting period.
Some consumers who switched to the focal manufacturer's products might return to the rival manufacturer's products, but other consumers might remain with the focal manufacturer's products in delisting stores and/or nearby stores. One reason for staying with the substituted product is that consumers develop decision inertia after repeatedly buying a product (Cosguner et al., 2018). This consumer decision inertia leads a consumer to continue purchasing the substitute. Another reason is that when consumers have the impression that rival products are unavailable, they may not check whether the products have been restocked. Instead, they may continue to purchase the focal manufacturer's products until realizing their preferred products are in stock. Therefore, we expect that the sales gain for the focal manufacturer will persist for some time even after the rival's products are relisted. After a competitor's products are relisted, the sales gain of the focal manufacturer to the delisting stores will not disappear immediately.
When a manufacturer produces multiple products, those products’ contributions to the company's overall sales are generally uneven. Managers usually categorize a large portfolio of products into star products and other products in terms of their contribution to sales (Stevenson & Hojati, 2007; Zipkin, 2000). For example, star products are in the A category in an ABC classification system, while other products are included in the B and C categories. Based on the Pareto principle, star products typically account for the most sales (around 80%), while other products account for the remaining small portion of sales (Pareto, 1971). The sales distribution among the star and other products is denoted by sales dispersion (Gallino et al., 2017). After ranking products based on sales, the top 20% of products (in terms of the number of product SKUs) belong to the star category. The focal manufacturer's star products compete head to head with the rival's star products. Their star products have the same flavor category and similar combinations of sugar and caffeine ingredients. The substitution between the star products of two manufacturers becomes stronger when rival products are delisted. These star products from both the focal and rival manufacturers are widely advertised and sold nationwide, so that consumers have low search costs and low uncertainty in switching between the two manufacturers. Meanwhile, the other products from both manufacturers are more variable in their ingredients and flavors and, therefore, not as substitutable as their star products. These products are more differentiated and face lower competition (Brynjolfsson et al., 2010). Compared to star products, consumers of other products have fewer alternatives to select (Cui et al., 2020). In summary, when star products are delisted, consumers are more likely to switch to the focal firm's competing products. Thus, we propose: When a competitor's products are delisted in some retail stores, sales of star products of the focal manufacturer increase proportionally more than other products at delisting stores.
For the second category of consumers who traveled to nearby stores, most purchased the rival products as planned (Sloot & Verhoef, 2008). However, a small portion would eventually purchase the focal manufacturer's products as replacements for or in addition to the rival's products for two reasons. First, as more traffic migrates to nearby stores, these traveling consumers might purchase some of the focal manufacturer's products for variety seeking. Second, when demand for rival products suddenly surges at nearby stores, the rival products might run out of stock. When facing stockouts at nearby stores, some consumers of the rival products (including those migrating to nearby stores and those originally shopping in nearby stores) would switch to the focal manufacturer's products. Therefore, we propose the following hypothesis: When a competitor's products are delisted in some retail stores, the sales of the focal manufacturer to nearby stores increase.
Significant differences exist among different retail types (Hansen & Singh, 2009). Big‐box retailers (such as Wal‐Mart and Kroger) have the advantage of large inventories and ample shelf space over small‐box stores (such as 7‐Eleven and CVS). As discussed above, consumers may travel from delisting stores to nearby stores in search of the delisted rival's products. The demand for these rival products would largely increase at the nearby stores. Small‐box retailers usually accommodate lower demand and carry less inventory than big‐box retailers. When demand suddenly rises, the limited inventory and shelf space for rival products at nearby small‐box stores are more quickly exhausted than at nearby big‐box stores. Then, some consumers at nearby stores may instead purchase the focal manufacturer's products when rival products are not available. Thus, nearby small‐box stores are expected to have increased demand for the focal manufacturer's products during delisting. When a competitor's products are delisted in some retail stores, the sales of the focal manufacturer to nearby small‐box retail stores increase proportionally more than nearby big‐box retail stores.
DATA
Proprietary sales data
We collected data from a focal manufacturer that produces a variety of products in direct competition with the rival manufacturer's products. The focal manufacturer provided us with sales data to retail stores in four states on the east coast of the United States for 84 weeks in 2009 and 2010. Based on the nondisclosure agreement with the focal manufacturer, we are not allowed to share the company name, product names, U.S. state names, or retailers’ names and locations. The data covers 40 weeks before the delisting (pre‐treatment period), 4 weeks during the delisting (treatment period), and 40 weeks after the relisting (post‐treatment period).
Our research focuses on the carbonated soft drinks produced by the focal manufacturer, as they are the leading products for both the focal and rival manufacturers and also the focus of the dispute and delisting. Our data include 366 SKUs from the focal manufacturer to 8978 retail stores at the week‐store‐SKU level. The data consist of 37 stores of the delisting wholesale chain. We observe only the sales from the focal manufacturer to retail stores, not the sales from retail stores to consumers. Since retail stores can purchase these branded products only from our focal manufacturer, and our sample includes all retail stores that sell these branded products to consumers in the four states of study, the sales we observe still closely approximate the sales to consumers. As our research focuses on the sales changes concerning the focal manufacturer, which does not directly sell to individual consumers, the sales between the manufacturer and retail stores are the most direct observation for our research interest.
Delisting and nearby stores
We are interested in changes in the focal manufacturer's sales to retailers at both the delisting stores and the spillover to the stores geographically close to the delisting stores. For each delisting store, we define a local market containing nearby stores affected by the shock of the conflict delisting. Following the economics and management literature (Gowrisankaran & Krainer, 2011; Olivares & Cachon, 2009), we measure the distance between stores using their geographic locations. Specifically, we use the street addresses of retail stores to pinpoint them on a U.S. map and draw a circle with a Euclidean radius around a delisting store to define a market (Bennett et al., 2013; Ren et al., 2019). We use a 1‐mile radius around each delisting store. As illustrated in Figure 3, a red pentagon in the center of the circle represents a delisting store, and red squares mark the retail stores located within the circle (referred to as nearby stores). Retail stores outside the circle but belonging to the same state as the delisting store are considered control stores and are represented by blue dots. In Section 7.4, we increase the radius of local markets from 1 mile to 5 miles for a robustness check, and our results remain unchanged.
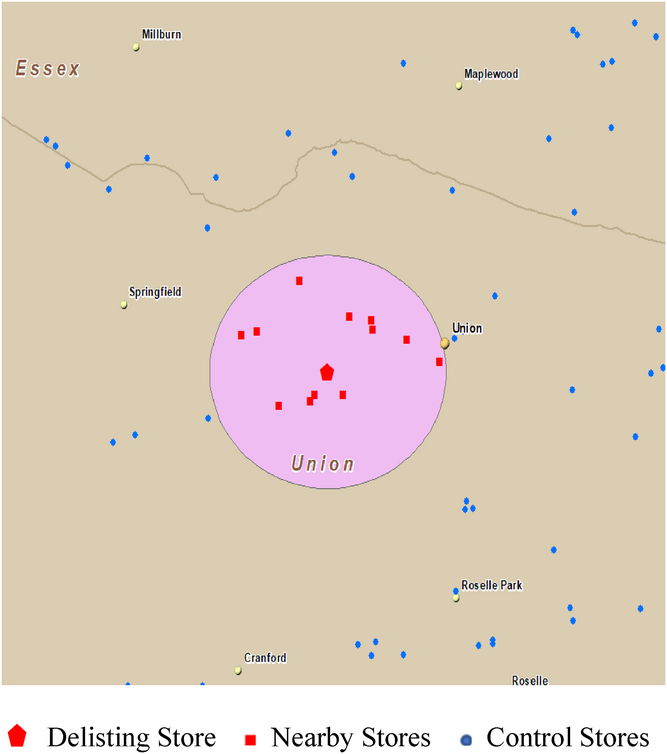
Nearby stores within a 1‐mile radius around the delisting store.
Both the delisting stores and nearby stores can be affected by the conflict delisting, and hence are of interest in this research. The products of the delisted manufacturer were delisted in the treatment period and relisted in the post‐treatment period in the delisting stores but were not delisted in nearby stores. Meanwhile, the focal manufacturer's products are always available in delisting and nearby stores. The number of delisting, nearby, and control stores across the four states in our data are presented in Table 2. Because the delisting stores are from a chain of wholesale clubs, when we conduct the DID analysis, we compare the sales changes at the delisting stores to a group of control stores that are also wholesale clubs (detailed in Section 5.2). In our analysis of the sales changes at nearby stores, we compare nearby stores against control stores and distinguish between three retail formats—wholesale clubs (such as Costco, Sam's Club, and BJ's Club), supermarkets (such as Wal‐Mart and Kroger), and convenience stores and drug stores (such as 7‐Eleven and CVS). Wholesale clubs and supermarkets are considered big‐box retailers, while convenience and drug stores are considered small‐box retailers.
Definition and description of stores
Demographic and weather data
We collected annual demographic and economic data from the 2010 U.S. Census, including population and median household income, which we matched with the proprietary data by zip codes. These variables control the demographic and economic factors in the area where retail stores are located.
We also collected daily weather data from the U.S. National Oceanic and Atmospheric Administration (NOAA), as weather conditions are documented to affect consumer demand (Gopinath et al., 2013). The weather data include daily precipitation, snow, and temperature, collected by weather stations all over the United States. We locate these weather stations using NOAA coordinates and match them to the nearest retail stores. Then, the daily weather data are aggregated to a weekly average level to be consistent with the proprietary sales data.
EMPIRICAL MODELS
Identification strategy for a three‐period DID design
We exploit a natural experiment setting and adopt a DID approach to identify the impact of a rival's delisting and relisting on the focal manufacturer's sales to the delisting retail stores and their nearby stores. Our research context is unique in that we can observe both the absence and return of the rival manufacturer. We consider the conflict delisting (the absence of the rival manufacturer's products) at the delisting retail chain as the treatment event and the 4‐week duration from the 47th to the 50th week of 2009 as the treatment period. Around this treatment event, our entire observation window can be categorized into three periods (as shown in Figure 1): 40 weeks of the pre‐treatment period, 4 weeks of the treatment period, and 40 weeks of the post‐treatment period. To test the sensitivity of our results to time windows, we replicate our analysis with three altered time windows in Section 7.3. Furthermore, we test preexisting time trends in Section 5.3 and eliminate potential confounders in Section 7.5.
Matching of the treatment and control groups
This subsection outlines our strategy to identify the control stores for evaluating the treatment effect on the delisting stores and the spillover effects on the nearby stores. To examine the treatment effect of delisting at the delisting stores, the treatment group contains 37 stores belonging to the delisting retail chain, as shown in Table 2. To measure the spillover effect of delisting to nearby stores, the treatment group includes 199 nearby stores. The remaining 8742 stores are categorized into the control group.
We recognize that the treated stores may differ from the control stores in terms of their store formats, geographic locations, or local demographic features, which may, in turn, affect sales and lead to selection bias. For example, the wholesale club stores in the treatment group tend to offer soft drinks in larger packages and are often situated in more densely populated areas, compared to an average convenience store in the control group. To remove the potential selection bias, we execute a three‐step matching procedure. First, we categorize all stores into three formats: wholesale clubs, supermarkets, and convenience stores. In our matching for the delisting stores that belonged to a wholesale club chain, we only consider wholesale clubs from the control group. Please note control stores are all outside the 1‐mile radius (5‐mile radius in robustness checks) of the treated stores. For nearby stores, that is, those inside the 1‐mile radius (5‐mile radius in robustness checks), we match them with control stores for each of the three store formats. Second, we constrain the matched control stores to be located in the same designated market area (DMA; defined by Nielsen company) with a treated store, so that consumers in both groups are exposed to the same TV advertising and similar demand shift in the local markets. Third, within the retail format and DMA based on the preceding two steps, we apply the coarsened exact matching (CEM) to pair the treated stores with stores in the control group.
CEM employs the monotonic imbalance bounding method to generate matches with smaller estimation errors than the equal‐percent bias‐reducing method used by propensity score matching (Iacus et al., 2012; Stuart, 2010). Specifically, a store is represented by characteristics coarsened to discrete values, so that each treated store is given a combination of bin values that will be used to exactly match control stores with the same combination of bin values. CEM alleviates sample selection bias and reduces the sensitivity of the regression results to specific functional forms (Iacus et al., 2012; Singh & Agrawal, 2011). The store characteristics we use as matching criteria include the average wholesale price per case, the average number of SKUs per week, and the population and median household income in the zip code where the stores are located. Regardless of the delisting, these characteristics may affect product sales. If so, changes in sales could be caused by these factors instead of the delisting. We thus include these variables in the matching procedure to control their influences on sales.
In CEM, we allow multiple control stores to be matched to the same treated store. From the 37 delisting stores in the treatment group, our procedure matches 30 of them with 38 control stores. From the 199 nearby stores, our procedure matches 169 of them with 1180 control stores. As shown in Table A1 in Supporting Information Appendix A, the store characteristics of the matched treatment and control groups are similar according to the t‐tests.
We summarize the descriptive statistics of variables in Table 3, with two columns for the delisting stores and their matched control stores and two columns for the nearby stores and their matches. Since the delisting stores and their control stores are all wholesale clubs, the focal manufacturer's sales to them are greater than those to the nearby stores and their control stores, which contain many small‐box stores. In the meantime, the wholesale prices to the delisting stores and their control stores are lower than those to the nearby stores and their control stores. The weather variables are similar for all stores in Table 3.
Descriptive statistics for variables associated with the matched treated and control stores
Time trend
Before the model estimation, we examine whether the changes in sales can be explained by time trends that may have existed in the pre‐treatment period (Wan, 2022). That is, we aim to rule out the possibility that the changes in sales result from some consistent time trends in the pre‐treatment period. The models and estimated results are presented in Supporting Information Appendix B, where we find parallel time trends in sales between the treatment and control groups prior to the conflict delisting.
Average treatment effect
Using a DID framework, we estimate the average treatment effect of the delisting and relisting by comparing the focal manufacturer's sales between the matched treated and control stores. Our regression makes two comparisons: one between the treatment and pre‐treatment periods, and the other between the post‐treatment and pre‐treatment periods. In Model (1), 

The variable 


Other than the main variables of interest, we use 


Heterogeneity in treatment effects
To explore the heterogeneous effects between the star and other products in delisting stores (Hypothesis 3) and between small‐box and big‐box nearby stores (Hypothesis 5), we add the indicator for star products (Starj
) and for small‐box stores (SmallBoxi
) to Model (1). The following two models are developed to test the moderating effects of star products and small‐box stores.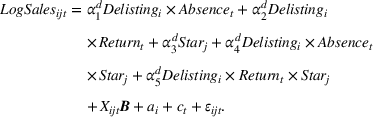
Positive 


An alternative approach is to break down the data into subsets by star and other products and then conduct the DID analysis in Model (1) on these two subsets. That is, we produce the estimates corresponding to α1 and α2 in Model (1) in two separate DID regressions. The estimated results of this alternative approach are also reported in Section 7.1. They are consistent with the estimated results for Models (2) and (3).
Dynamics in the post‐treatment period
After 4 weeks of conflict delisting, the dispute was resolved, and the rival's products were relisted. To investigate how long the treatment effect of the temporary delisting persisted, we follow the literature (Zhou & Wan, 2022) to estimate the weekly effect at the delisting stores in all 40 post‐treatment weeks. Again, Delistingi
represents delisting stores and Nearbyi
for nearby stores. In Model (4), we represent each treatment week by Absence1t
through Absence4t
, respectively. Likewise, Return1t
, Return2t
,…, Return40t
indicate the first, second, through 40th week after relisting, respectively. The control variables and fixed effects are the same as those in Model (1). As discussed before, the 4 weeks of delisting might have permanently converted some of the rival manufacturer's customers to the focal manufacturer, adding to the latter's sales. Meanwhile, some of the focal manufacturer's customers can also switch to the rival driven by reactance motive or sympathy with the rival manufacturer (Berger et al., 2010; Van der Maelen et al., 2017), taking away the focal manufacturer's sales. β5 through β44 measure the total impact of these opposite drivers on the focal manufacturer's sales week by week in the post‐treatment period.
EMPIRICAL RESULTS
Average treatment effects at the delisting stores
First, we explore the overall treatment effect on the focal manufacturer's sales at the delisting stores. The coefficient estimates of Model (1) for delisting stores are reported in Table 4. We have added weather and price stepwise into the model, and the last column shows the full model. The lagged precipitation and snow are significant, whereas the present measures are not. Thus, we include the lagged weather conditions as control variables in the full model and use them in the following discussion.
Impact of the reduced and restored competition on sales quantity at the delisting stores
Note: This table reports the estimated coefficients and standard errors (in parentheses) of Model (1) for delisting stores with control variables added into the model stepwise. The dependent variables are the sales in cases for store i SKU j in week t after log‐transformation and scaling up by 0.001.
p < 0.001;
p < 0.01;
p < 0.05.
The coefficient for 
The coefficient of the post‐treatment term, 
The lagged weather variables are all significant, showing a higher sales level when there is less precipitation, less snow, or higher temperature, but all coefficients are in a relatively small magnitude. The prices are camouflaged wholesale prices after accounting for all promotions and discounts. The coefficient of price, however, is not significant, indicating it is not predictive of the focal manufacturer's sales. Given the wholesale club chain's extensive network and negotiation power, the focal manufacturer provides relatively low and stable wholesale prices to their stores. It is not surprising that the sales to retail stores are not sensitive to stable wholesale prices.
The dependent variable is sales quantity in cases. At the focal manufacturer, all packages can be converted to sales cases. For example, 12 containers of 12‐ounce cans and nine containers of 16‐ounce bottles are equal in terms of the number of cases. When we use sales volume in fluid ounces to replace the sales cases in Model (1), the treatment effects are consistent with those in Table 4.
Heterogeneous effects on product categories in delisting stores
In this section, we estimate the heterogeneous treatment effect on the focal manufacturer's sales of different products. We first differentiate star products from other products. Specifically, we divide the focal manufacturer's products into star products and other products in accordance with the 80–20 Pareto rule. The subset of star products contains 18 SKUs and accounts for 76.6% of the sales at delisting stores and their control stores. The estimated results of Model (3) are reported in the first column of Table 5. The baseline is other products. As expected, star products have more sales than other products. Furthermore, the sales gains of star products in the delisting and relisting period are higher than those of other products. These results support Hypothesis 3.
Heterogeneous impact of delisting on sales of different products at delisting stores
p < 0.001;
p < 0.01;
p < 0.05.
An alternative approach to investigate the difference between the star and other products is to estimate Model (1) using two separate subsets of data (one for star products and the other subset for other products). The coefficient estimates are shown in the last two columns of Table 5. The sales of the focal manufacturer's star products increased significantly during the delisting period. Upon relisting the rival's products, the sales gain for star products decreased from the delisting period but were still significantly higher than those in the pre‐delisting period. Meanwhile, the sales of other products remained at the pre‐delisting level for both the delisting and relisting periods. As a result, the treatment effect during the delisting is positive and significant for the focal manufacturer's star products, but insignificant for its other products. These results are consistent with the results for Model (2) in the first column of Table 5, supporting Hypothesis 3.
In addition, we expect heterogeneous treatment effects at the SKU level for products with different sweeteners and caffeination. We distinguish sugar‐sweetened products (labeled as sugary) from artificially sweetened products (labeled as diet), and the former account for two‐thirds of the focal manufacturer's SKUs. We use Model (1) to estimate the average treatment effects during and after the delisting on both subsets. Table 6 reports the coefficient estimates for the sugar‐sweetened products in Column 1 and artificially sweetened products in Column 2. We find both sugar‐sweetened products and diet products gained sales during the delisting of the rival manufacturer. Whereas sugary products gained 12.7%, diet products gained 11.4%. The treatment effect even lingered for the focal manufacturer's diet products after the rival products were relisted. This lingering effect could imply a relative strength of the focal manufacturer's diet products.
Heterogeneous impact of delisting on sales of different products at delisting stores
p < 0.001;
p < 0.01;
p < 0.05.
Likewise, we conduct analyses using subsets for the focal manufacturer's caffeinated products and noncaffeinated products and report their coefficient estimates in Columns 3 and 4, respectively. We find the sales for caffeinated products increased by 15.5% during delisting, whereas those for noncaffeinated products were not significantly different from the pre‐delisting level. When the rival products were relisted, the treatment effect decreased but remained significant for caffeinated products.
Spillover effects at nearby stores
We anticipate that a proportion of the rival's consumers would go to nearby stores to purchase the rival's products. Such increased traffic to nearby stores may lead to a spillover effect on the focal manufacturer's sales to the nearby stores. We define a local market as a 1‐mile circle around a delisting store. All stores inside the circle, except for the delisting stores, are considered nearby stores. Using the matched sample for nearby stores, we study the average treatment effect spilled over from the delisting stores to the nearby stores, whether this spillover lingered into the relisting period and the heterogeneity in the spillover effects across different product categories.
The coefficient estimates of the spillover effects on the nearby stores are reported in Table 7. The coefficient for 

Spillover effects on nearby stores
p < 0.001;
p < 0.01;
p < 0.05.
To investigate the heterogeneous spillover effects between big‐box and small‐box nearby stores, we estimate Model (3) and report the results in the first column of Table 8. The nearby big‐box stores are used as the baseline. As expected, sales to small‐box stores were less than big‐box stores but increased more than nearby big‐box stores during the delisting period. The result supports Hypothesis 5.
spillover effects on nearby stores by different retailer formats
p < 0.001;
p < 0.01,
p < 0.05.
We also classify retailers into one of three formats: (1) wholesale club, (2) supermarket and mass merchant, or (3) convenience store. The first two formats are considered big‐box retailers, and the last is considered small‐box retailers. We conduct a DID regression for each subset of the retailer format and report the coefficient estimates in the last three columns of Table 8. We find the focal manufacturer only gained sales at the nearby convenience stores during the delisting, but not at wholesale clubs or supermarkets. As some consumers traveled to nearby stores, the focal manufacturer may gain sales due to the surge in traffic, variety seeking, or stockout of the rival's products. However, the possible sales gain from the increased traffic and variety‐seeking is limited at the wholesale clubs due to their club membership requirement and small assortment. Thus, it is not surprising to observe no significant changes at the nearby wholesale clubs during or after the treatment periods. On the other hand, a trip to supermarkets would incur more time costs for consumers to travel to and locate the desired products, although they usually offer lower unit prices for soft drink products than convenience stores. The sales gain at supermarkets was thus not significantly higher than the pre‐delisting level. The 3.5% sales increase for the focal manufacturer at the convenience stores may be a combined effect of the increased traffic and possible stockouts of the rival's products, which is stronger for retailers with lower inventory, such as convenience stores.
We also estimate the heterogeneous treatment effect on the focal manufacturer's sales of different product categories at nearby stores compared to control stores, reported in Supporting Information Appendix C. We find sales gains for the focal manufacturer's sugar‐sweetened, caffeinated, and star products, similar to our findings regarding the sales changes at the delisting stores.
Dynamics in the post‐treatment period at the delisting and nearby stores
The results in Table 4 show the average treatment effect on the focal manufacturer's sales to delisting stores carried over into the post‐treatment period, which is calculated based on a relatively long observation window of 40 post‐treatment weeks. It is interesting and important to explore how the positive treatment effect in delisting stores persists and fluctuates after the relisting. Using Model (4), we estimate the dummy variable for each week after delisting. We plot the estimated coefficients of these weekly dummy variables and their 95% confidence intervals in Figure 4.
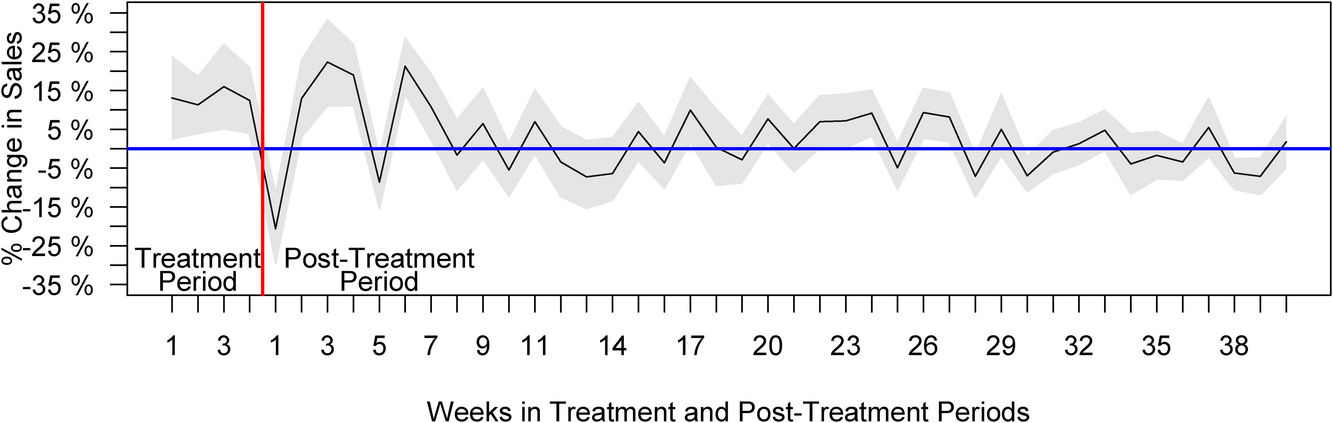
Treatment effect at the delisting stores.
The week‐by‐week estimates in Figure 4 depict how the focal manufacturer gained sales during and after the event—it suggests that a sales gain occurred during the 4 weeks of the delisting and carried over into the relisting period. Right after the relisting, the focal manufacturer's sales to the delisting stores immediately fell, rebounded, and then fluctuated for another cycle until settling back closer to the pre‐delisting level, represented as 0 on the y‐axis in Figure 4. The pulses at the beginning of the post‐treatment period can be attributed to the dynamic interplay between the carryover treatment effect and consumers’ reactance shopping behaviors, stockpiling of the rival's products, or sympathizing with the delisted rival manufacturer. The last positive and significant sales change occurred on week 27 post‐treatment. We note the weekly treatment effects are significant at the 5% level for the first 7 weeks, but not for weeks 8–16. If we look only for any variation greater than one standard deviation (i.e., 14.9% of sales), the carryover wears out by the seventh week post‐treatment. Thus, we would consider the first 7 weeks after relisting are still affected by the treatment but not afterward. Nevertheless, the post‐treatment fluctuation lingered much longer than the delisting duration. Meanwhile, the positive carryover, averaged over the entire 40 post‐treatment weeks, is still 3.4% greater than the pre‐delisting level. Although we expect the focal manufacturer's sales to drop upon the relisting, the long‐lasting pulses and the degree of fluctuation still provide valuable insights for managers regarding the demand and inventory management during the relisting period. It is possible that the sales may fluctuate over an even longer window than our observation. However, it is increasingly unlikely that sales fluctuation beyond these 40 weeks after the relisting directly results from the delisting.
We also explore the dynamics of the spillover effect. We estimate the dummy variable for each week in the treatment and post‐treatment periods and plot the estimated coefficients and the 95% confidence intervals of these weekly dummy variables in Figure 5. The spillover to nearby stores during the treatment period is significantly positive. In the post‐treatment period, however, the focal manufacturer's sales to nearby stores quickly returned to the pre‐delisting level, that is, 0 on the y‐axis.
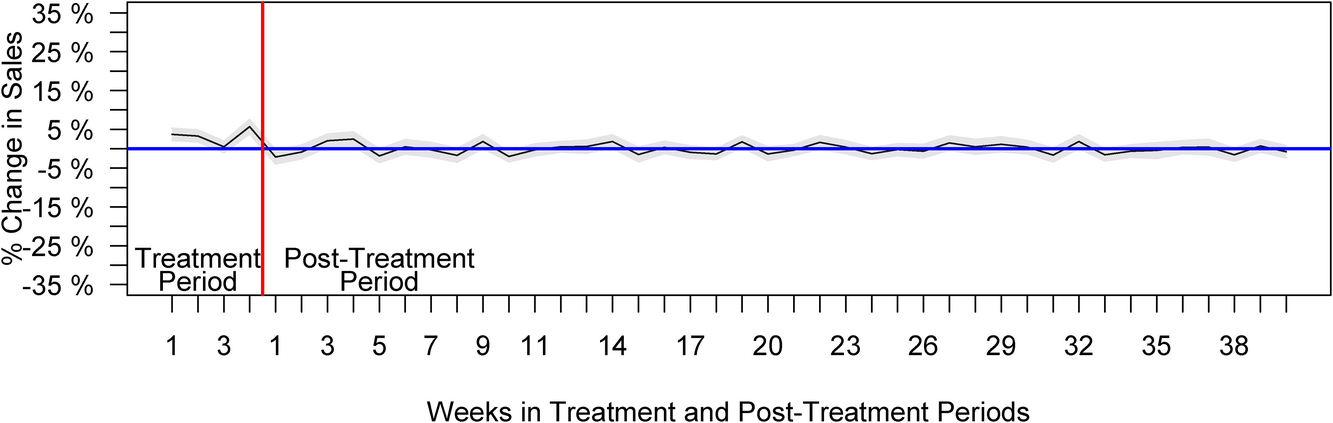
Treatment effect at the nearby stores.
ROBUSTNESS CHECK
Alternative DID specifications
Two DID approaches can be used to test the effects in the treatment period and the post‐treatment period (Cui et al., 2020). The first one is specified in Model (1), where we combine pre‐treated, treated, and post‐treated periods in one regression model (Parker et al., 2016). The second approach compares each period to its corresponding period in separate DID models (Cui et al., 2019). Following Cui et al. (2019, 2020), we also investigate the effects of delisting and relisting in separate models. Specifically, we consider the delisting as the first treatment and the relisting as the second treatment and run separate DID regressions to measure the effect of the first treatment by comparing the delisting period with the pre‐delisting period and the effect of the second treatment by comparing the relisting period with the pre‐delisting period. The results of these separate DID regressions, reported in Supporting Information Appendix D, are very close to those from an integrated DID regression.
Forest‐based nonparametric approach
In our main analysis presented in Section 6, we match the treated stores with control stores using CEM. To alleviate any concerns about the influence of parametric specifications in our matching process, we instead use a nonparametric machine learning approach, specifically, the generalized random forest algorithm (Athey et al., 2019), for both matching and estimation of the average treatment effect. We report the preprocessing procedures and detailed results in Supporting Information Appendix E. The average treatment effect on delisting stores is 11.4%. In the post‐treatment period, the focal manufacturer still gained 3.0% sales for an average store‐SKU pair, compared to the pre‐treatment level. Both estimated average treatment effects are positive and significant, and their magnitudes are close to those from our main DID model in Table 4 (also close to the results of separate DID regressions in Supporting Information Appendix D). We also find a marginally significant spillover effect, a 2.1% increase in sales, at nearby stores. Once the rival manufacturer was relisted, the spillover effect to nearby stores was no longer significant, consistent with our main findings.
Time sensitivity
We conduct a sensitivity analysis on the number of weeks included in the treatment period. Since the delisting store may still have remaining inventory on the first day of delisting, a consumer may still find the delisted products in the first few days of the 4‐week treatment period. The delisting stores belong to a warehouse club chain, where the sales are larger than in regular stores. Without replenishment, their inventories typically do not last for more than 1 week. Likewise, if there is any delay due to management or logistics, the rival's products may not return to the shelves immediately after the announcement of relisting. Thus, we test the robustness of our findings by excluding the first week during the delisting, the first week after the relisting, and both. The coefficient estimates for delisting stores and their control stores are reported in Table F1 of Supporting Information Appendix F, and those for the nearby and control stores are reported in Table F2 of Supporting Information Appendix F. Our empirical findings still hold. The signs and significant levels are the same as the main results.
Nearby stores within greater local markets
As the literature suggests various radii for local markets (Brynjolfsson et al., 2009), we test the robustness of our findings regarding the spillover effect to nearby stores by increasing the radius of a local market from 1 mile to 5 miles. We find a 2.3% sales increase from the focal manufacturer to nearby stores during the treatment period and no significant changes in sales after the relisting. The finding is close to the 3.0% sales increase based on the 1‐mile radius and consistent with the underlying mechanism we propose in Section 3. The coefficient estimates are reported in Supporting Information Appendix G.
Excluding alternative explanations of sales changes due to altered prices and SKUs
We conduct robustness checks to exclude alternative explanations of the changes in sales. In particular, we consider whether changes in sales of the focal manufacturer might be caused by factors other than the delisted rival products. In addition to the reduced competition, product price and product variety can also affect product sales. Our models already include the wholesale price as a control variable to capture the influence of price on sales. To ensure the price strategy of the focal manufacturer did not change during or after the treatment period, we estimate a DID model with price as the dependent variable. The wholesale prices did not change at the 0.05 significance level when the rival's products were delisted or relisted. Regarding the focal manufacturer's product variety, we do not find the delisting retail chain introduced new SKUs from the focal manufacturer during or after the delisting. Therefore, the focal manufacturer's product price and product variety at the delisting stores are not driving the treatment effects recovered in our study.
MANAGERIAL IMPLICATIONS
The temporary disappearance of products from shelves is common in the retail industry. Conflict delisting, however, creates a unique type of product unavailability. A better understanding of the impacts of conflict delisting is necessary to maximize the benefits of reduced competition during this time. This study provides a comprehensive and diverse evaluation of the impact of a rival's delisting, in both the short‐ and long‐term, which can assist managers in making informed decisions and adjusting their marketing and operational strategies.
Our findings show that when a rival's products were delisted, the sales of the focal manufacturer increased by only 12.2% at the delisting stores. This result is lower than expected, given the rival manufacturer's large market share in the carbonated soft drink market. The low rate of brand‐switching could be attributed to consumers’ strong loyalty and preference for the rival's products. If the conflict delisting were taking place in another product category with less consumer brand loyalty, the remaining manufacturers might see a larger increase in sales during a rival's absence. Therefore, manufacturers should consider adjusting their inventory models to accommodate the sales changes during the delisting of a rival's products.
Moreover, the sales gain did not immediately dissipate after the rival's products were restocked. On average, the focal manufacturer's sales in the post‐treatment period were 3.4% higher than the pre‐delisting level. In addition to the sizable sales gain revealed from our study, we have also revealed intriguing dynamics in the focal manufacturer's post‐treatment sales. Before returning to the pre‐delisting level, the focal manufacturer's sales experienced large fluctuations over 7 weeks—almost double the length of the delisting period. While many managers might expect a sudden drop in demand once the rival's products are relisted, a ripple effect may continue, affecting both the delisted and the remaining products. Thus, our empirical findings of the significant and interesting dynamic patterns during the relisting period are valuable insights for both manufacturers and retailers seeking to maintain stable inventory.
Our research adds to the extant literature with substantive findings regarding the spillover effects from the delisting stores to nearby stores. In particular, we find the focal manufacturer's sales increased by 3.0% at nearby stores during the delisting period. However, this gain did not persist after the delisting. Intuitively, one might expect the spillover would mostly occur at nearby wholesale clubs and supermarkets, as they are most similar to the delisting stores. Interestingly, our empirical results show that the focal manufacturer's sales gain in nearby stores mainly came from convenience stores, not wholesale clubs or supermarkets, suggesting a complementary relationship between wholesale clubs and convenience stores. This finding highlights the importance of retailers anticipating potential sales gains and preparing with increased inventory when neighboring complementary stores delist products.
To unpack the heterogeneous effects on the focal manufacturer's different product categories, we examined product popularity, sweetener type, and caffeination. We find significant substitution between the focal manufacturer's star products and the rival's. In addition, sugar‐sweetened and diet products increased sales during the delisting. The sales gain for diet products even carried over into the relisting period, indicating the strength and opportunity of the focal manufacturer's diet products. Moreover, we have also found significant sales gains for caffeinated and star products during the delisting, revealing interesting heterogeneous treatment effects related to the product's features. These findings may result from the competition between the delisted manufacturer's products and those of the focal manufacturer. Noncaffeinated products were trending towards healthier options in the industry during the data windows. The relatively new noncaffeinated offerings from the focal manufacturer faced less competition from the delisted manufacturer's products. Both manufacturers were in the early stage of developing these non‐caffeinated products and had less head‐to‐head competition. Thus, the weak competition softens the substitution effect caused by the delisting. This finding highlights the importance of product variety management for manufacturers and retailers. When making product variety decisions, managers should consider product functions, competition level, and the number of SKUs. These heterogeneous effects also affect the inventory strategies for the manufacturer that faces the delisting of rival products. More inventories should be allocated to the products with more intense competition.
Our results show that a manufacturer can expect a sales increase during a rival's delisting, which can persist for an extended period at the delisting store and may vary among different products. This is a result of the reduced competition faced by the manufacturer when its rival's products are no longer available. Our empirical findings also uncover an interesting sales fluctuation after the competition was restored—the focal manufacturer's sales experienced two cycles of decline and rebounding before eventually settling close to the pre‐delisting level. Our study enriches the empirical evidence for the discussion of the “new normal” after a sudden and drastic shock to the market, such as the COVID‐19 pandemic. Our findings align with those of Oblander and McCarthy (2022) that the new normal in many product categories post‐COVID‐19 is similar to the old normal. Moreover, our results reveal the sources of the sales increases: the focal manufacturer gained sales on its sugar‐sweetened products, caffeinated products, and star products at both delisting stores and nearby stores, and the sales gains at nearby stores mainly occurred at convenience stores. By gaining a comprehensive understanding of the impact of conflict delisting, manufacturers can fully maximize their sales enhancement opportunities. Our findings can provide manufacturers with valuable information to inform their strategic decisions in marketing forecasting and inventory management in response to unexpected changes in market competition. Our results can also assist retail managers in evaluating the changes in competing products when making decisions about delisting products.
CONCLUSION
We exploit a dispute between a major retail chain and a leading soft drink manufacturer, which resulted in the temporary delisting of all of the manufacturer's products from the retailer's stores in the United States. We focus on a manufacturer that competes directly with the delisted manufacturer and examine the changes in the focal manufacturer's sales. The key questions we investigate are: Did the sales of the focal manufacturer return to the pre‐delisting level after the rival's products were relisted, and if so, how? Additionally, did the impact of the delisting spillover from the delisting stores to nearby stores, and if so, what was the extent of this spillover?
We utilize a DID design to study the impact of a conflict delisting between a rival manufacturer and a retail chain on a focal manufacturer's sales to the delisting stores and nearby stores. We study the dynamic influence in both delisting and relisting periods. As the impact on different products from the focal manufacturer can vary to a large extent, we also explore the heterogeneous effects on the sales of the focal manufacturer's various product categories and its sales to retailers in different formats. To remove the selection bias, we employ CEM to match the stores in the treatment and control groups. We have also measured the treatment effects with a nonparametric forest‐based algorithm as an alternative and tested the robustness of our empirical findings by altering the time windows and broadening the radius for nearby stores. Alternative explanations regarding the preexisting time trends and confounding changes in prices and product variety are also excluded. Our findings expand our understanding of the sales opportunities that manufacturers of remaining products can capitalize on due to a conflict delisting between a retailer and a rival manufacturer.
We recognize that the 12.2% sales increase of the focal firm may not replicate in any delisting contexts. Like many empirical findings, the effect size could vary when the empirical context varies. In our study, we observed 12.2% sales migration from the delisted manufacturer to the focal manufacturer during the delisting, indicating the substitution between the delisted and focal manufacturers. In the long run, we find no sales gain after a few weeks of sales fluctuation, showing the strength of the delisted manufacturer in maintaining its customer base even after a 4‐week large‐scale delisting. Should these conditions change, the new short‐term and long‐term sales changes would depend on the substitution between delisted and remaining products as well as consumers’ loyalty to the delisted products.
Our study has several limitations. First, the studied conflict delisting occurred at a wholesale club chain, and both parties involved in the dispute have strong press visibility and negotiating power. It is worth examining whether the conflict delisting would impose similar changes on retailers in smaller formats and manufacturers with smaller market shares. Second, given our data source and research focus, we do not measure the damage of delisting on the rival manufacturer's sales, which has been studied in the literature (Mishra & Raghunathan, 2004). Third, we do not focus on individual shopper‐level transactions, which are usually studied in the marketing literature with scanner panel data. Future research is encouraged to quantify the substitution patterns using scanner data, such as the Nielsen scanner data.
Footnotes
ACKNOWLEDGMENTS
The authors are grateful for the valuable feedback provided by the DE, Dr. Bradley Staats, the anonymous AE, and two reviewers, which greatly improved the paper. Additionally, the authors would like to thank the participants of seminars held at the Ohio State University, Carnegie Mellon University, University of Wisconsin ‐ Milwaukee, and Nanyang Technological University.
1
The consumers who were buying the rival products only at the nearby stores could also be affected by such demand surge. When the rival products went stockout at nearby stores, these consumers were also forced to switch products or postpone or cancel purchases. For simplicity, we do not include the discussion of these consumers in our theoretical illustration. However, our empirical data include the sales from these crowded‐out consumers if they purchase the focal manufacturer's products.
References
Supplementary Material
Please find the following supplemental material available below.
For Open Access articles published under a Creative Commons License, all supplemental material carries the same license as the article it is associated with.
For non-Open Access articles published, all supplemental material carries a non-exclusive license, and permission requests for re-use of supplemental material or any part of supplemental material shall be sent directly to the copyright owner as specified in the copyright notice associated with the article.