
Abstract
Accountable care organizations (ACOs) are responsible for the quality and cost of care of specified patient populations, including the cost of referrals. Motivated by this environment, we study care coordination for healthcare referrals. We consider an ACO that refers an uncertain number of patients from its attributed population to a preferred external provider for specialized health services. ACOs are typically paid under the Medicare Shared Savings Program (MSSP). Under the MSSP, the payer sets a spending benchmark for the beneficiary population during a fixed time period and shares any gains (losses) relative to it with the ACO. During the billing period, all services delivered to the attributed population by the ACO and external providers continue to be reimbursed under fee‐for‐service. Gains (losses) are determined at the end of the period by comparing the actual spending, which includes all care expenses (regular visits, referrals, and failed treatments) incurred by the payer in the period to the predefined benchmark. In this environment, the ACO and external providers—the latter not compensated under the MSSP—lack incentives to invest enough in care coordination initiatives. We study financial incentive mechanisms between the ACO and its preferred external provider to achieve integrated care coordination in referral markets under the MSSP. We show that traditional fee‐for‐service and capitation agreements do not provide sufficient incentives for care coordination in referral markets. However, a risk‐ and cost‐sharing mechanism can induce integrated care coordination efforts while satisfying the ACO and provider's participation constraints. We characterize a family of such mechanisms and numerically study the variability of the ACO and the external provider's profit. We demonstrate that this type of agreement can be used not only to induce integrated care coordination but can also result in a Pareto improvement in profit variability. We also illustrate the impact of the different MSSP risk tracks parameters on the performance of this care coordination mechanism, including their effect on the quality of care and the payer's mean spending.
Keywords
INTRODUCTION
Accountable care organizations (ACOs) are one of the flag initiatives impulsed by the Centers of Medicare and Medicaid (CMS) since the Affordable Care Act (ACA) was signed into law in 2010. Under the ACO model, healthcare providers voluntarily work together to take care of a specific patient population and are accountable for their cost and health outcomes. To achieve this goal, the model is accompanied by a change in reimbursement. The Medicare Shared Saving Program (MSSP) holds ACOs accountable for the care quality, cost, and service experience for the assigned beneficiary population by linking reimbursement to performance. As of January 2021, there were 477 ACOs enrolled in the MSSP, which combined covered over 10.7M Medicare fee‐for‐service (FFS) beneficiaries (CMS, 2021c).
At the outset of the ACA, lack of care coordination was widely observed in healthcare delivery. In particular, Mehrotra et al. (2011) documents widespread problems with the referral process. An earlier survey by Gandhi et al. had found that 63% of primary care providers (PCPs) and 35% of specialists were dissatisfied with the referral process in the United States. One of the problems discussed was the lack of timely and accurate information sharing among providers. “Many referrals do not include a transfer of information, either to or from the specialist; and when they do, it often contains insufficient data for medical decision making” (Mehrotra et al., 2011).
Indeed, a key goal of the ACO initiative and MSSP is to promote the coordination of health services through the entire care continuum. Care coordination can take many forms. Examples include facilitating the exchange of data between PCPs and specialty departments and creating networks of post‐acute care partners to support the ACO's mission of improving the quality and effectiveness of care. As such, it also involves managing health services delivered outside of the ACO providers' umbrella. CMS (2021a) states the benefit of care coordination as to “ensure that patients get timely and appropriate care, while avoiding unnecessary duplication of services and preventing medical errors”. Incentives for care coordination activities within health providers that are part of the ACO are well‐aligned under this model (Hearld et al., 2019). However, this is not fully the case for providers that are not integrated with the ACO.
In this paper, we study incentives for care coordination in the delivery of referral services between an ACO and a preferred external provider. Specifically, we propose a mechanism that allows the ACO to achieve integrated care coordination outcomes that strengthen the clinical relationship with its preferred external providers.
In our model, we consider the centralized—also known as vertically integrated—care coordination solution as the target coordination outcome. Nonetheless, we note that in practice the vertically integrated care coordination decisions may not necessarily be ideal. The economics literature has long debated about the potential impact of vertical integration on healthcare expenditure and outcomes. Providing a definite answer is difficult because it requires balancing the gains in clinical integration against the downside of potentially excessive market power from the hospital‐physician vertical integration. Empirically, it has been shown that under FFS vertically integrated healthcare systems can indeed exert their market power when negotiating hospital and physician prices with commercial insurers (Baker et al., 2014; Capps et al., 2018; Curto et al., 2022; Lin et al., 2021) while also inducing a higher utilization of diagnostic tests and procedures (Whaley et al., 2021). For Medicare, vertical integration may result in patient severity up‐coding under a risk‐adjustment reimbursement model (Post et al., 2022) and thus higher payments (Post et al., 2021). These negative effects of vertical integration and how they manifest in the ACO and external provider clinical integration decisions are not captured in our model.
The MSSP works as follows. It establishes a
The program has two main risk tracks for ACOs to choose from, called one‐sided track and two‐sided track, respectively. In the MSSP one‐sided track, the ACO only shares gains relative to the benchmark with the payer, provided that the ACOs satisfies minimum quality metrics. In the early days of the ACO model, most organizations—99% of ACOs in 2013—chose to participate under this track as it presented a fairly safe option for providers who were then learning to navigate the new reimbursement model. Having said that, ACOs in the one‐sided track have not shown significant savings and some have even increased their Medicare spending (CMS, 2018). In the MSSP two‐sided track, the ACO takes downside risk and not only shares gains with the payer but also losses relative to the benchmark. To compensate for the added downside risk, the two‐sided tracks include a share of gains that is larger than the one in the one‐sided tracks (CMS, 2021b).
The adoption of the MSSP two‐sided track has been rather slow, suggesting that most ACOs are not ready to face the level of downside financial risk proposed by the existing tracks. An alternative interpretation of this observation is that ACOs are not confident they can avoid losses under their current practices and the shared‐gains proportion is not set to a large enough level to justify the added risk. CMS has responded by introducing various modifications to the program. In 2018, CMS introduced the Pathways to Success rule, where, among various changes to the tracks, the shared‐gains proportion was increased with the goal of speeding up the ACOs' transition to performance‐based compensation programs. By 2021, 41% of existing ACOs had moved into MSSP two‐sided tracks of various risk levels (CMS, 2021c).
One of the many challenges that ACOs face when joining an MSSP two‐sided track is how to mitigate the level of financial risk they are exposed to (Barnes et al., 2014). Simultaneously, while some networks offer the whole spectrum of care (from primary to tertiary care), many of them do not have all the in‐house expertise to do so. As a consequence, these ACOs have to rely on external providers to refer patients for advanced services (e.g., inpatient procedures, surgical care, etc.). Indeed, 37% of ACOs are physician‐led ACOs only providing preventive and low‐complexity care (Tu et al., 2016), and refer their high‐complexity patients to other health systems, such as Academic Medical Centers. Hence, the referral volume between ACOs and external providers can be significant; McWilliams et al. (2014) report that 66.7% of visits to specialists are provided outside the assigned ACO, while Kuraitis (2011) quotes that only 35%–45% of adult inpatient care, as measured by revenue, is served within the ACO network.
Referrals are therefore an important source of financial risk for ACOs (Nathan & Dimick, 2016). Managing referrals has been listed as one of the key factors for successfully transitioning into two‐sided risk models (Hefner, 2019). However, managing referrals has proven challenging for ACOs. First, Medicare patients have flexibility on where to seek care from, hence, they might not necessarily follow the ACO's referral recommendation. Second, care coordination between the ACO and external providers requires both parties to invest in costly resources and activities to support their clinical collaboration during referral episodes. The ACO and the external providers, however, are not necessarily sufficiently motivated to invest enough in care coordination activities because these are not typically reimbursed by the payer.
Motivated by this context, we consider a low care complexity ACO (e.g., physician‐led ACO) that does not have the capability to treat patients who need highly specialized services, hence it refers them all to external providers (e.g., Weisman (2012)). The ACO and its preferred provider decide on the level of care coordination they will engage on. Care coordination refers to both costly activities and resources that are invested prior to and used during the referral episode. Examples include adding case coordinators, designing protocols and guidelines, and the IT infrastructure to support smooth referrals. These are initiatives that the ACO and the provider can invest in to (1) increase the chances patients will follow the referral recommendation to the preferred provider and (2) increase the chances of a successful referral treatment from a closer clinical collaboration.
Inefficiency arises in this context in the form of lack of care coordination because the ACO and the preferred provider do not share the benefits nor the high costs of improving the referral process. In particular, the provider continues to be reimbursed under the FFS schedule—and does not face any penalties for excessive spending—thus has few incentives to participate in costly coordination activities. The cost associated to achieving coordinated care may also prevent the ACO from investing enough, or at all, in them. To tackle this issue, we study financial incentives mechanisms between the ACO and the external provider with the goal of improving care coordination for referral services. In particular, as summarized in Subsection 1.1, we focus on the role of the gain‐ and loss‐sharing proportions in the MSSP two‐sided tracks as an incentive to induce the participation of the ACO and their preferred provider in risk‐ and cost‐sharing agreements that can coordinate the referral network.
Importantly, before the ACA providers were primarily reimbursed under the Medicare FFS model. Moreover, monetary transfers between providers were legally forbidden. However, under the ACA, a special waiver exempts ACOs and participant providers from the physician self‐referral law and the Federal anti‐kickback statute in order to facilitate the implementation of the MSSP (Department of Health and Human Services, 2015). Specifically, the partnership between an ACO and an external provider studied in this paper qualifies under the purpose of promoting cost accountability and curving expenditure growth, as well as increasing access to advanced care services for the ACO's covered population.
Main contributions
We now summarize the main contributions of this paper.
Overall, our results shed light on the trade‐offs that emerge when designing risk‐sharing pricing contracts for healthcare referral services. Specifically, our results highlight the challenges faced by the payer when incentivizing not only the ACO to join the MSSP but also its provider network to coordinate care. In addition, we provide some theoretical support for novel strategies that are being implemented by ACOs to improve care coordination with their network of external providers.
The rest of the paper is organized as follows. In Section 2, we review related literature. In Section 3, we present the model. In Section 4, we derive our main analytical results. In Section 5, we present and discuss numerical results that unveil additional insights. Section 6 concludes and provides final remarks. The Supporting Information to this paper contains several appendices. Appendix A provides preliminary results, Appendix B contains all the proofs, and Appendix C considers several model extensions and robustness checks.
LITERATURE REVIEW
In this section, we detail how our work relates to research on financial incentives in health care in the operations management and economics literature.
Agency problems abound in health care. Often, these problems involve a payer (e.g., insurer) and a provider (e.g., hospitals or physicians). A main research question in this area is how payment agreements (e.g., FFS, pay‐by‐performance) can help balance the efficiency and quality trade‐off under different information settings (Newhouse, 2002). For instance, cost‐sharing contracts can result in higher quality (Ellis & McGuire, 1986), however they can also result in lower efficiency (Chalkley & Malcomson, 1998).
The proliferation of new payment models impulsed by the ACA has fostered healthcare research within the operations community. Bundled payments (BP), Hospital Readmission Reduction Program, and MSSP are just a few examples of programs implemented by CMS in the last decade that have led to new research insights. For instance, Gupta and Mehrotra (2015) study the optimal design of BP, where providers are reimbursed on the basis of the expected cost of an episode of care. Adida et al. (2016) and Guo et al. (2019) compare the performance of BP and FFS.
The Hospital Readmission Reduction Program seeks to penalize hospitals for excess readmissions relative to a risk‐adjusted benchmark. Gupta (2021) empirically evaluates the effectiveness of this program and Arifoğlu et al. (2021) analyze the design flaws of this model. Zhang et al. (2016) argue that a different benchmarking process could prevent the current trend of many hospitals choosing to pay penalties. Using a yardstick competition model, Savva et al. (2019) study the design and effectiveness of competition‐based benchmarks. They propose a simple benchmark to remedy some of the undesirable outcomes—ER long wait time—observed in practice.
The article of Aswani et al. (2019) is one of the few articles studying the effective design of the MSSP. Because under the MSSP initiatives to deliver more effective and coordinated care are financed by providers, the extent of their efforts is in many cases insufficient to reduce overall spending. Aswani et al. (2019) propose a performance‐based subsidy scheme to partially reimburse the provider's investment. In contrast, we consider a different mechanism where the ACO shares part of the MSSP risk payment and care coordination costs with its preferred external provider.
More generally, pay‐by‐performance contracts have gained significant attention because they can align incentives in different healthcare settings (Selviaridis & Wynstra, 2015). Mannion et al. (2008) study the case where the payer cannot track performance back to the provider's intensity of care. Andritsos and Tang (2018) combine BP and performance‐based contracts to reduce readmissions when care is co‐produced between providers and patients. Zorc et al. (2021) use outcome‐based contracts to address collusion and free‐riding, and Jiang et al. (2012) propose a performance‐based contract for outpatient services under capacity considerations. For more examples of healthcare payment models we refer the reader to the review by Fainman and Kucukyazici (2020).
Research on healthcare referral markets is of particular interest for our work. This research area has recently received more attention since healthcare providers are becoming accountable for the cost and quality of care throughout the entire care continuum (e.g., ACO model, BP model, etc.).
Early research on the role of gatekeepers focused on the efficiency of the referral decision on which patients to refer and the effectiveness of various compensation mechanism (e.g., Shumsky and Pinker (2003); Malcomson (2004); Brekke et al. (2007)). With the goal of reducing waste and congestion, Liu et al. (2015) consider a two‐way (non‐ACO) referral system and show that a cost‐sharing contract can coordinate the referral decisions. Wang et al. (2021) study financial schemes in a hospital two‐tier system where the comprehensive hospital refers patients to a primary hospital and patient revisits are possible. Adida and Bravo (2019) study quality coordination in a one‐way referral system (between a health network and an external provider); they show that a penalty contract can coordinate preventive and follow‐up care effort decisions. Our work is different from this stream of research in that we explicitly model the MSSP as the mechanism by which the ACO is compensated, while the external provider is still compensated by FFS—hence, in our model the ACO does not pay for the referral service. Furthermore, we consider the preferred provider's referral volume as uncertain and both ACO and provider's care coordination efforts can stochastically increase it.
Rajagopalan and Tong (2021) analyze the impact of a payer's reimbursement scheme choice—FFS with each provider separately or a BP model for jointly compensating the providers—on the efficiency of the generalist's referral and specialist's care intensity decisions. Our work differs in that we consider an ACO that is compensated under the MSSP by the payer. The payer in our model does not set the internal contract terms, it is the ACO who define the terms of the care coordination agreement with its preferred provider. We find that a risk‐ and cost‐sharing mechanism can align care coordination efforts to integrated values under the MSSP.
Finally, Ghamat et al. (2021) study the Comprehensive Care for Joint Replacement Model (CJR)—an episode‐based payment model. Under CJR, the hospital retains all gains (losses) relative to an episode payment benchmark for the afflicted sub‐population. Ghamat et al. (2021) find that the CJR can reduce payer's spending but it results in worse quality. This result holds because efforts in their model represent a reduction in billing (i.e., a sign of treatment intensity), as opposed to improvements in care coordination as in this paper. There are several model differences. For instance, we consider effort‐dependent uncertain referral volume—where efforts represent investments that support continuous clinical collaboration—and we assume efforts are complements. Our results illustrate the importance of the MSSP gain‐sharing and loss‐sharing proportions for inducing downstream clinical collaboration, and their impact on care quality and payer's spending.
To summarize, we contribute to the literature on financial incentives in health care by providing various insights for the design of the MSSP—specifically the design of shared‐gains and shared‐losses—trough the analysis of the impact of these parameters on the ACO's and provider's care coordination efforts, the resulting expected profit and its variability as well as the quality of care and the payer's mean spending.
MODEL
In this section, we describe our model to study care coordination efforts in the healthcare referrals market between ACOs and external providers. For reference, Table A1 in Appendix A in the Supporting Information provides a summary of all the model parameters and their definition.
We consider an ACO that refers patients to external providers for a specific service that is outside the ACO's expertise. Examples include services offered by skilled nurse facilities, emergency rooms, and specialist practices—this is especially relevant for physician‐led ACOs. For instance, consider referrals to post‐acute care facilities. Patients referred to these facilities are at the highest risk for readmission, afflicted by multiple chronic conditions. The fluid communication between patients, PCPs and specialists is key for ensuring successful outcomes. Our model can also capture agreements between an ACO and its associated specialty practices and surgeons under episode‐base payment models, for example, joint replacement BP (see Johnson et al. (2021) for an example of such agreements in Urology).
Care coordination efforts help set up and better utilize the IT infrastructure and governance processes to improve communication and information sharing between the ACO and external providers during referral episodes. For instance, the ACO can exert effort to “standardize the referral process between physicians and practices, and improve physician relationships within, and with awareness of, the network” (Robeznieks, 2018). The providers' effort can target compliance with clinical pathways and quality reporting. The ultimate goal of these initiatives is to allow a smooth collaboration and information exchange between the ACO and its preferred providers. This collaboration is set prior to, and used during, the referral episode, such that the clinical care and collaboration processes are already in place when patients seek care.
While in principle the ACO could establish care coordination with many external providers, in practice a high concentration of referrals are directed to a single care provider. For example, Exhibit 4 from Sahni et al. (2020) illustrates that the referral volume to the same provider has a median between 60% and 70%. Accordingly, we focus on care coordination between an ACO and a single 

The coordination efforts of each party are combined into a single measure, the joint effort, which captures the interaction between care coordination activities. Following the service design framework in Roels (2014), we consider a Cobb–Douglas
1
type of joint effort function, namely,


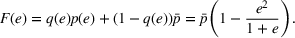
A larger joint care coordination effort not only results in higher chances that patients will follow the ACO's referral recommendation and schedule an appointment with the preferred external provider, but they also boost the chances of ultimately successful healthcare outcomes. Accordingly, we define 

We isolate the effect of care coordination on care quality by assuming that, in the absence of coordination efforts, the preferred and nonpreferred providers are homogeneous and have the same failure probability 
Furthermore, we assume 
We further assume that as a result of coordination efforts between the ACO and its preferred provider, the preferred provider's probability of treatment failure can be made smaller and reach a value 


Exerting coordination effort is costly for each of the parties. Indeed, coordination activities may be time consuming, resource intensive and/or require the implementation of information technology applications to support them. We denote by 

Under the ACO model, the ACO is under the MSSP with CMS. We refer to CMS as the payer throughout in our model. The MSSP is a risk‐sharing contract between the ACO and the payer. Specifically, the ACO receives a portion 


The MSSP operates as follows. During the billing period, typically a year, the payer continues to reimburse all providers who deliver care to the Medicare patient population under FFS and then consolidates these payments at the end of the period. That is, at the end of the year, the payer adds up all the healthcare costs paid during the billing period for the population under consideration and compare it to its spending benchmark to determine the realized gains/losses. We note that the total spending includes not only the care delivered by the ACO, but also the cost of any other health services provided outside the ACO.
In practice, the spending benchmark is determined based on historical costs and adjusted based on beneficiary risk scores.
2
The benchmark is periodically updated to include changes in regional costs as well as changes in severity and case mix of the population assigned to the ACO. Aligned with ACO's practical setting, in our model we assume
In our model, we abstract away from other sources of randomness in the system and focus on the likelihood that patients follow the ACO's referral recommendation and the associated failure rate probability. Specifically, we assume that the ACO is responsible for a population of size 


In case of treatment failure, the payer incurs an additional payment 


Assuming the decision of whether to follow the referral and its associated potential treatment failure is independent and identically distributed for each patient, the number of failed referrals 


With these expressions in hand, we define the payer's For any 


Namely, Lemma 1 shows that a higher joint coordination effort from the ACO and the provider not only reduces the expected amount to be spent by the payer on healthcare costs associated to treating the patient population, but it also reduces the uncertainty of the payment faced by the payer. This reduction in payer's expected costs and cost uncertainty allows for better planning based on future cash flows. As a result, the payer benefits from costly coordination activities adopted by the ACO and the provider, and is interested in incentivizing them.
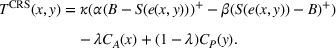
We first define the components of the payer's incentive scheme. Given the payer's spending function 
Let 


We conclude the model description section by defining a set of practically motivated admissible payer's spending benchmarks. Namely, consistent with the spending benchmarks considered by CMS in practice, we restrict our attention to spending benchmarks that at the very least cover the average spending under no joint coordination effort, plus some notion of additional safety budget to address random fluctuations of the spending amount. Specifically, throughout our analysis, we consider the following lower bound on the spending benchmark considered by the payer,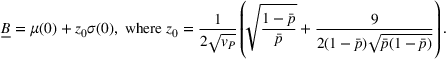


In this regime, the expected risk‐based payment For any payer's spending benchmark 


Lemma 2 states that as long as the payer's spending benchmark
ANALYTICAL RESULTS
In this section, we first characterize the outcomes that would be achieved by a centralized system where the ACO and the provider make integrated decisions for their common benefit. Then, we consider a decentralized system and show that FFS and capitation—the standard contracts in health care—cannot induce integrated care coordination efforts from both parties simultaneously. We conclude this section by introducing a family of cost‐ and risk‐sharing contracts that do achieve integrated coordination efforts for both the ACO and the provider.
While in principle one could consider the social welfare maximizing effort levels as a target benchmark—including the impact on patients and other stakeholders that are not the primary decision makers in the system—it is unclear why the ACO (as opposed to the payer) would be interested in attaining such an equilibrium. In particular, in the MSSP the payer lacks a mechanism to induce the ACO and its preferred provider to attain social welfare maximizing coordination efforts. In Appendix C4 in the Supporting Information, we numerically analyze the gap between the integrated and the socially optimum care efforts. We find that the patient utility gained from a successful treatment modulates the gap in care coordination efforts between the two benchmarks. If the patient utility is low—for example, low risk health service or diagnostic services—the integrated efforts result in
Integrated system outcomes
In this section, we characterize the optimal integrated coordination efforts between the ACO and the provider. Namely, we consider the case where the ACO and the provider act as a centralized entity. This could be the case if the ACO makes the provider part of the ACO care network (e.g., the ACO and a specialty practice forming a joint entity for an episode‐based payment program). The joint entity formed by the ACO and the provider seeks to maximize their integrated profit by choosing the right level of coordination effort by each party.
We start by formalizing the decision problem of the integrated entity. Its ex ante objective is

Recall that under the MSSP the integrated entity continues to be paid under FFS throughout the year, while the risk‐based payment is determined at the end of the billing cycle depending on the realized spending. Thus, the integrated expected profit given in Equation (8) includes the expected risk‐based payment, the ACO's FFS profit on the whole patient population, the preferred provider's FFS profit on the referred patients that follow the ACO's referral recommendation (including the profit margin from failed treatments), and the cost of effort of each party.
We emphasize that the profit associated with patients that do not follow the ACO's referral recommendation is not included in the integrated profit in Equation (8). These are accounted for in the expected risk‐based payment though, as these payments, and the additional expense in case of failure, are still faced by the payer and compared to the spending benchmark.
As commonly done in the literature, for the sake of tractability we make assumptions that ensure that the integrated coordination effort of each party, Under Assumption 2 the integrated profit 


From Lemma 3, it follows we can find the integrated ACO and provider's efforts by solving the first‐order conditions (FOCs) of Equation (8), and comparing the unconstrained optimal solution with the feasible set. Again, as is standard in the literature, we focus on the case where the centralized solution is an interior solution. In order to ensure so, we impose the following sufficient condition. The minimum and maximum marginal cost of effort satisfy:

Intuitively, Assumption 1 states that a small effort is not too costly—hence there is incentive to exert at least some effort—but a large effort can become very costly relative to its marginal gains. The integrated coordination efforts 


where The integrated efforts 


As Lemma 1 establishes that the payer benefits from higher care coordination—because quality improves and spending decreases—then Lemma 4 justifies the payer being interested in motivating the ACOs to move into two‐sided risk tracks under the MSSP. Indeed, the Pathways to Success rule, implemented by CMS in 2018, increased the values of both the shared‐gains and shared‐losses proportions to strengthen ACOs' cost and quality improvements (CMS, 2018).
In particular, Lemma 4 shows that the traditional FFS payment model between the payer and the ACO, where there is no risk‐sharing, that is, 

Decentralized system outcomes
We now consider the decentralized system where the ACO and the provider make effort decisions to maximize their own profit. Inefficiency, that is, lack of care coordination, arises in this setting due to the ACO and the provider not internalizing the cost associated with poor health outcomes.
As a result of this lack of care coordination, in the decentralized system the resulting payer spending is larger in both mean and variance, and the ACO receives on average a lower risk‐based payment from the payer, when compared to the integrated outcomes. The preferred provider may also be negatively impacted because a potentially smaller patient volume would follow the ACO's referral recommendation. Our goal is to characterize a coordination mechanism between the ACO and the preferred provider that can attain the integrated care coordination efforts by both parties.
Let These payments can help to align incentives for healthcare providers to coordinate care, improve quality and efficiency of care, and partner in the improvement of care delivery. (MITRE, 2011, p. 21).
This transfer is paid at the end of the billing cycle once the payer's spending, and the associated gains or losses with respect to its spending benchmark, have been realized.
The ex ante ACO's expected profit is then given by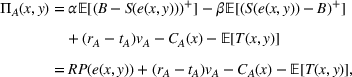

Recall that the payer continues to pay the provider under FFS yielding a profit margin of 

We model the equilibrium effort decisions as the resulting outcomes of a full‐information simultaneous game between the ACO and the provider.
We conclude this section by defining the status quo and then analyzing standard contracts used in decentralized systems in health care, namely, FFS and capitation. We show that neither can induce integrated coordination efforts for both the ACO and the provider simultaneously. With this motivation, we then introduce a family of cost‐ and risk‐sharing contracts that attain integrated coordination efforts while satisfying the participation constraints of both parties.
Status quo
In this section, we define the status quo. Before the implementation of the ACO payment model, the traditional model between the ACO team (hospitals and physicians) and the payer was either a FFS model or a diagnosis related group model (DRG)‐like model, where the ACO team were reimbursed on a per patient volume basis. “The federal Anti‐Kickback Statute (AKS) (42 U.S.C. §1320a‐7b.) is a criminal statute that prohibits the exchange (or offer to exchange), of anything of value, in an effort to induce (or reward) the referral of business reimbursable by federal health care programs” (Cornell Law School, 2021). Under the ACO model, and the bundle payment model, there is a process for waiving some of these requirements, or for obtaining an official opinion that the requirements will not be enforced in a specific scenario (MITRE, 2011).
Therefore, by default the status quo in the traditional FFS model between the ACO and the payer was characterized by the ACO making no payment to the external provider, that is, setting 


Using FFS as transfer payment
Consider a FFS payment model between the ACO and the provider, that is, the ACO transfers a fixed amount 

The following lemma shows that a FFS payment can achieve the provider's integrated effort whenever the ACO also exerts integrated effort. Consider 


Lemma 5 states that if the ACO chooses a specific FFS rate to pay the provider, it is possible to achieve the provider's integrated care coordination effort Consider 


Lemma 6 establishes that an FFS contract between the ACO and the preferred provider cannot achieve integrated efforts by both parties simultaneously. Namely, the ACO will exert strictly less coordination effort than the integrated level whenever the provider is exerting integrated effort, that is, if 

Using capitation as transfer payment
We now consider the transfer payment between the ACO and the provider to be a capitation payment. Specifically, assume 
The following lemma shows that no capitation payment between the ACO and the provider can possibly achieve integrated coordination efforts. A capitation transfer payment cannot achieve integrated coordination efforts. Specifically, the provider exerts insufficient effort, that is, 

In particular, Lemma 7 shows that under the status quo it is not possible to achieve integrated coordination efforts, regardless of the ACO and the provider's participation constraints.
As the most common referral contracts between ACOs and providers, namely FFS and capitation, cannot achieve integrated care coordination efforts by both parties, we explore more advanced payment mechanisms. The motivation for considering these payment models is founded on the observation that any transfer payment model that only depends on the joint effort
Coordinating contract: Cost‐ and risk‐sharing
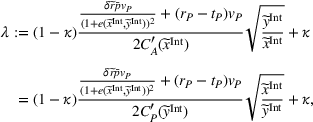
We turn our attention to performance‐based mechanisms that allow the ACO to transfer some of its payment risk, gains, and losses, to the provider. We note that achieving integrated outcomes requires not only sharing gains and losses, but also sharing the effort costs, 

Under this transfer payment model, the ACO faces a fraction 


Therefore, the ex ante expected transfer between the ACO and the provider is
As a result, the ex ante expected profit for the ACO and the provider can then be written as Let 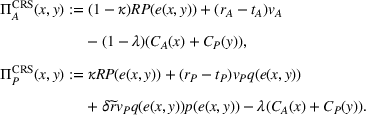


Assumptions 1 and 2 ensure that the cost‐sharing proportion satisfies 

NUMERICAL RESULTS
In this section, we design numerical experiments to unveil additional insights about the MSSP program and the proposed cost‐ and risk‐sharing contract. Although this contract is more complex than FFS, we note that the benefits it reports over the latter are substantial. Indeed, we numerically illustrate how an optimally designed FFS contract fails to achieve the integrated system's outcomes and quantify the performance gap in terms of the induced treatment failure probability and payer's mean spending, see Appendix C.3 in the Supporting Information for the details.
We start by describing the parameters considered in the experiments. Then, we study the impact of the payer's MSSP parameters, that is, the gain‐sharing proportion α and loss‐sharing proportion β, on several dimensions. Specifically, we first investigate the effect of α and β on the integrated joint effort exerted by the ACO and the preferred provider, as well as on quality (i.e., treatment success rate) and the payer's average spending. We find that the effect of α is much larger than β in inducing a higher joint coordination effort, thus increasing the treatment success probability at a lower payer's mean spending. Second, we analyze the impact of α and β on the participation constraints of the preferred provider and the ACO in the proposed cost‐ and risk‐sharing contract. We find that increasing α reduces the likelihood of participation of both parties, while increasing β increases the likelihood that the ACO participates in the contract and has a small effect on the participation of the preferred provider. Finally, we show that for small values of the payment‐sharing proportion κ, the proposed cost‐ and risk‐sharing contract can satisfy the participation constraints of both parties and achieve a Pareto improvement in profit variability. Moreover, increasing the value of α (β) increases (preserves) the likelihood of this Pareto improvement.
Overall, the numerical results in this section (summarized next in Table 1) identify the gain‐sharing proportion α as the main
Summary of the impact of the MSSP parameters α and β
Experiments design
Due to the lack of publicly available data to calibrate all the parameters in our model, we instead follow a robustness approach in our experiments design. Specifically, we created a large set of instances for the problem parameters that reflect a wide range of potential applications in healthcare referral services. Across all these instances we assume that the ACO's market size is constant, that is, we set 


Overall, we consider a set of 11,364 instances of our model for each combination of 
Summary of parameters values


Impact of α and β on the integrated effort, quality, and Payer's spending
We start by analyzing the impact that the payer's gain‐ and loss‐sharing proportions α and β have on the integrated joint coordination effort by the ACO and the preferred provider, as well as on quality (measured by treatment success probability) and the payer's mean spending. This is important, as choosing the values of α and β are the main levers the payer has available in the MSSP to incentivize the ACO and its external providers to coordinate care in the referral market.
Figure 1 illustrates the absolute change in the integrated joint care coordination effort driven by varying the payer's gain‐ and loss‐sharing proportions α and β, respectively. Each data point in the boxplots represents an instance of the model, that is, specific values of the model parameters (


Impact of % gain‐sharing α and loss‐sharing β on the integrated joint effort. (a) Impact of % gain‐sharing α. (b) Impact of % loss‐sharing β. Data points correspond to problem instances (


To be precise, as by Lemma 4 the joint effort is increasing in both α and β, then for each value of loss‐sharing β in the y‐axis, in Figure 1a we vary the gain‐sharing proportion α in the range [β, 0.7] and compute the difference in net effort as 

The numerical results from Figure 1 strongly suggest that the gain‐sharing proportion α has a dominant effect on the integrated joint effort 
We next analyze the impact of α and β on the main metrics of interest for the payer: quality, measured by the treatment success rate, and the payer's average spending. Our results are summarized in Figure 2, where we plot the median percentage change in success rate and mean spending achieved by the integrated efforts relative to the status quo. First, Figure 2 reinforces the importance of the gain‐sharing proportion α, as opposed to β, in this case in driving quality and the payer's mean spending. In particular, note that the quality and the payer's mean spending slightly decrease as β increases. Having said that, in the numerical results in Subsection 5.3 we show that a larger value of β is the main lever available in the MSSP for the payer to incentivize the ACO to coordinate care with the preferred provider. Second, Figure 2 illustrates that when failed treatments are profitable, that is, for larger values of δ, then the treatment success rate is larger (higher quality) at a smaller payer's mean spending. The underlying mechanism that explains the latter results is that, for larger values of δ, the integrated coordination efforts are larger (see the discussion in Appendix C.2 in the Supporting Information for the details).

Impact of α and β on outcomes quality and spending each
To summarize the results in this section, in the MSSP the payer has two main mechanisms to influence spending and care coordination: a carrot (α) and a stick (β). Our results suggests that the carrot mechanism is more effective at incentivizing joint coordination effort between the ACO and its provider network (i.e., the integrated efforts are larger) overall delivering a higher quality of care at a lower mean payer's spending. In 2018, CMS modified the MSSP risk‐sharing tracks by introducing Pathways to Success. This program modification offers new risk participation options for ACOs. The new alternatives seek to accelerate the transition for ACOs to adopt performance‐based risk reimbursement by accepting downside risk, that is, a larger loss‐sharing proportion 
By providing stronger incentives to improve quality and reduce spending, policymakers expect ACOs to exert higher efforts to achieve tighter care coordination and better outcomes. This observation is based on previous ACOs' performance: first generation ACOs under two‐sided risk tracks (i.e., shared‐gains and shared‐losses) have shown better cost and quality performance than those in one‐sided tracks (with shared‐gains only) (CMS, 2018). Our model suggests that although the downside risk size, β, is effective at driving care coordination efforts, the size of the upside risk, α, is much more effective for that purpose. As a larger joint coordination effort leads to more savings in the payer's mean spending (cf. Lemma 1) and a higher probability of treatment success, we refer to the gain‐sharing proportion α of the MSSP contract as the main
Properties of the cost‐ and risk‐sharing coordinating contract
In this section, we numerically study some interesting properties of the proposed family of cost‐ and risk‐sharing contracts. First, we illustrate that it is often the case that one can design such a cost‐ and risk‐sharing contract that satisfies the participation constraints of both the ACO and the preferred provider. We additionally show the impact of the MSSP gain‐ and loss‐sharing proportions α and β on the participation of each party. Second, we quantify the risk, in terms of profit variability, that both the ACO and the preferred provider typically face under the proposed family of cost‐ and risk‐sharing contracts, and compare it to the risk faced in the status quo. We numerically demonstrate that a Pareto improvement in terms of profit variability is achievable for small values of the payment‐sharing proportion κ via a cost‐ and risk‐sharing contract that satisfies the participation constraints of both parties and attains integrated coordination efforts.
Likelihood to satisfy participation constraints
In this section, we analyze how frequently the integrated system's optimal coordination can be attained through the proposed cost‐ and risk‐sharing contract. Additionally, we study the impact of the MSSP payer's parameters, α and β, on the ACO and the preferred provider's willingness to participate in such a contract. Specifically, our analysis focuses on the
We find that a cost‐ and risk‐sharing coordinating contract exists for approximately 91% of the instances we consider. Notably, the MSSP design can have a significant effect in the likelihood of attaining integrated coordination. Indeed, Figure 3 shows that the gain‐sharing proportion α can deter the participation in the proposed cost‐ and risk‐sharing coordinating contract, while the loss‐sharing proportion β can induce more participation in it.

Proportion of instances that achieve integrated care coordination Each combination of
We now look deeper into the individual participation of the preferred provider and the ACO in the proposed cost‐ and risk‐sharing contract.
Preferred provider's participation hindered by higher gain‐sharing α
Our results indicate that the preferred provider's participation constraint is 

In terms of the role of α and β on the preferred provider's participation, in the set of instances where the preferred provider's participation can constrain the collaboration, our results suggest that increasing α can make it 
ACO's participation incentivized by higher loss‐sharing β
Intuitively, when the gain‐sharing proportion α is small, the MSSP does not provide strong incentives for the ACO to try to reduce the payer's spending by coordinating care with external providers. As a result, achieving integrated coordination is more likely in this regime because the integrated efforts are relatively small. Indeed, exerting integrated efforts does not significantly increase the ACO care coordination cost.
As the gain‐sharing proportion α increases, however, integrated care coordination becomes
To understand the impact of the loss‐sharing proportion β on the ACO's participation constraint, we first analyze the impact on the ACO's profit in the status quo. When β is large, there are two forces at play. On one hand, the ACO faces larger expected losses, which imply a lower expected risk payment. On the other hand, the ACO induced effort is (mildly) larger (see Figure 1b), which in turn increases the ACO's expected risk payment while also increasing the effort costs. Our numerical results in Figure C1(b) in Appendix C.1 in the Supporting Information suggest that the first force dominates. In other words, for large β it is
Pareto improvement in profit variability
To conclude this section, we numerically analyze the proposed cost‐ and risk‐sharing coordinating contract from a different perspective: profit variability. Remarkably, our results show that the contract can benefit both the ACO and the provider by simultaneously improving their expected profit and reducing profit variability. This Pareto improvement in profit variability is attained by selecting small values of κ, and is more common for large values of α. Table 3 provides evidence of this finding. Specifically, we consider a subset of 5000 problem instances, simulate the profits for different values of 
Instances that satisfy participation and Pareto improvement in profit variability


To gain perspective on the impact of the MSSP gain‐ and loss‐sharing parameters, α and β, Table 3 shows that these parameters have a different impact on driving the Pareto improvement in profit variability. Specifically, the gain‐sharing proportion α increases the likelihood of the Pareto improvement in profit variability for the small values of κ that concentrate the highest likelihood of a Pareto improvement on profit variability, that is, 
SUMMARY AND FINAL REMARKS
Motivated by the extensive adoption of the ACO model in the United States, we proposed and analyzed a stylized model of the MSSP between ACOs and CMS. This program is designed to better align the incentives of ACOs by transferring to them part of the payer's risk associated with high treatment costs. The ACOs can share part of this risk with their external provider network to expand the incentives to reduce spending and improve health outcomes. The external providers in turn can benefit from having a closer relationship with the ACO by receiving additional referral volume. This is a new and understudied program in the healthcare industry, that is becoming more relevant as more care networks adopt shared‐savings contracts with payers by following the ACO model.
Our model consists of an ACO referring patients to a preferred external provider where the volume of patients that follow the referral and their treatment outcome are stochastic. Moreover, both the ACO and the preferred provider can exert costly effort to improve care coordination between them, which increases the probability that patients will follow the referral and reduces their treatment failure probability. The payer engages the ACO in a shared‐savings program, where the ACO receives a proportion α of the payer's savings with respect to a spending benchmark, and a proportion 
This paper sheds light on two important questions for ACOs: (
We show that FFS and capitation, the standard contracts in the healthcare industry, cannot achieve integrated coordination efforts for both the ACO and the provider simultaneously. Thus, we propose a cost‐ and risk‐sharing contract that allows the ACO to share with the provider a fraction κ of the payer's risk‐based payment and a fraction λ of the total cost of coordination efforts. We characterize a family of such cost‐ and risk‐sharing contracts, parameterized by κ, that satisfy the participation constraints and attain integrated coordination efforts from both parties.
Our numerical analysis reveals further insights. We find that the payer's gain‐sharing parameter α has a much larger effect than its loss‐sharing counterpart β on the induced joint coordination effort, as well as on quality (i.e., treatment success rate) and the payer's average spending. Hence, we identify the payer's gain‐sharing proportion α as the main value‐driver in the MSSP. However, we also find that increasing α reduces the likelihood that the participation of both parties can be guaranteed, while increasing β increases the likelihood that the ACO participates in the contract and has a small effect on the participation of the preferred provider. Thus, we identify the payer's loss‐sharing proportion β as the main participation‐driver in the MSSP.
Then, for sufficiently large values of the payer's gain‐ and loss‐sharing parameters α and β, the ACO's payment‐sharing proportion κ of the proposed cost‐ and risk‐sharing contracts modulates the participation and profit variability of the ACO and the preferred provider. Namely, we show that for small to moderate values of the payment‐sharing proportion κ, the contract can satisfy the participation constraints of both parties and achieve a Pareto improvement in profit variability. Further, increasing the value of α increases the likelihood of this Pareto improvement, while increasing the value of β has a small effect on its likelihood. In other words, our results show how under the MSSP a coordinated referral network can not only improve health outcomes (through more referrals to the preferred provider) but also improve financial outcomes for the ACO and the preferred provider as long as they coordinate care.
We now discuss some of the major limitations of our model, which could be addressed in future research. First, for the sake of parsimony we have isolated the effect of coordination efforts in the rate of failed treatments from additional drivers of patient health and their associated costs. In particular, the intensity of care is exogenous in our model. Additionally, the referral volume is also exogenous, that is, only patients who need a referral get one and referral treatment is always provided, hence referrals cannot be exploited for the purpose of increasing revenues. The latter feature is consistent with the literature. Indeed, van Dijk et al. (2016) study Medicare patients compliance with referrals and report that 86.6% of patients follow up with the specialist. Although our model provides a reasonable approximation, endogenizing the intensity of care and the referral volume while simultaneously considering coordination efforts is an interesting avenue for future research. Second, we consider a full information model. This approach is common in the literature even though effort costs are typically private information. Having said that, we emphasize that care coordination effort levels are observed by both the ACO and the provider—both parties need to interact in order for care coordination to occur—thus each party has a good estimate of the effort the other party is exerting while the costs are typically well‐understood and known (e.g., salary of a care coordinator, etc.). Third, in practice, the implementation of the MSSP includes minimum quality requirements for the ACO to qualify for share‐savings, and also caps on how much gains or losses the ACO may face in a given billing cycle. In our model, we relax these aspects for the sake of tractability, thus allowing the ACO to collect gains and pay losses regardless of their size and quality requirements. In this sense, our model is likely to make effort coordination incentives more salient than what they are in practice.
The MSSP includes several risk‐sharing tracks (CMS, 2021b). Each track has specific values of gain‐sharing and loss‐sharing, which correspond to the payer's parameters α and β in our model. The ACO can choose the track according the the risk its willing to assume. For instance in the basic tracks, the gain‐sharing proportion can vary from 40%–75% and the ACO may retain gains up to 10% of the payer's spending benchmark. The loss‐sharing proportion is set to 30% and the ACO can be responsible for losses up to 4% of the payer's spending benchmark. Our results illustrate that the design of the MSSP can have a significant impact on care coordination efforts, care quality and payer's mean spending. One of the goals of the MSSP is to promote coordination of health services for Medicare beneficiaries. Such coordination can only achieve its highest potential when both the ACO and the provider are willing to participate in costly coordination activities.
Our analysis suggests that the ACO's risk‐sharing track choice can set the appropriate (or inappropriate) environment for this care coordination to arise. It is important that policymakers consider this observation in the design of the different risk‐sharing tracks in the program, as certain transfers of risk between the payer and the ACO, for example, too small a gain‐sharing proportion α, or too large a gain‐losses proportion α without an appropriate loss‐sharing proportion β, can deter ACOs and providers from exerting enough coordination effort, and ultimately put one of the goals of the ACO model—delivering coordinated care across the care continuum—at risk.
Footnotes
ACKNOWLEDGMENTS
The authors thank Sergei Savin (the department editor handling the paper) as well as the anonymous senior editor and reviewers for their comments, which helped to substantially improve the content and exposition of this work. The research of the second author was partially supported by National Science Foundation (NSF), Grants CMMI‐0846554 (CAREER Award) and CMMI‐1537536 and an AFOSR award FA9550‐11‐1‐0150. The research of the third author was partially supported by the MIT Energy Initiative Seed funding as well as NSF, Grant CMMI‐1162034. The research of the fourth author was partially supported by the Natural Sciences and Engineering Research Council of Canada (NSERC) Discovery, Grant RGPIN‐2018‐04561.
1
2
CMS uses the CMS Hierarchical Condition Category (CMS‐HCC) prospective risk adjustment model for this purpose.
References
Supplementary Material
Please find the following supplemental material available below.
For Open Access articles published under a Creative Commons License, all supplemental material carries the same license as the article it is associated with.
For non-Open Access articles published, all supplemental material carries a non-exclusive license, and permission requests for re-use of supplemental material or any part of supplemental material shall be sent directly to the copyright owner as specified in the copyright notice associated with the article.