
Abstract
We used multimodal magnetic resonance (MR) techniques [brain diffusion-weighted magnetic resonance imaging, diffusion-weighted imaging (DWI), proton MR spectroscopy (MRS), 1H-MRS; and skeletal muscle phosphorous MRS, 31P-MRS] to investigate interictal brain microstructural changes and tissue energy metabolism in four women with genetically determined familial hemiplegic migraine type 2 (FHM2), belonging to two unrelated families, compared with 10 healthy women. Brain DWI revealed a significant increase of the apparent diffusion coefficient median values in the vermis and cerebellar hemispheres of FHM2 patients, preceding in two subjects the onset of interictal cerebellar deficits. 31P-MRS revealed defective energy metabolism in skeletal muscle of FHM2 patients, while brain 1H-MRS showed a mild pathological increase in lactate in the lateral ventricles of one patient and a mild reduction of cortical N-acetyl-aspartate to creatine ratio in another one. Our MRS results showed that a multisystem energy metabolism defect in FHM2 is associated with microstructural cerebellar changes detected by DWI, even before the onset of cerebellar symptoms.
Keywords
Introduction
Familial hemiplegic migraine (FHM) is an autosomal dominant subtype of migraine with aura (MA), characterized by some degree of transient hemiparesis in addition to visual, somatosensory or dysphasic symptoms (1). Some patients also develop cerebellar signs (2). The disease is genetically heterogeneous. Half of the families carry missense mutations in the CACNA1A gene on chromosome 19p13 encoding the pore-forming α1A subunit of a neuronal voltage-gated P/Q type calcium channel (FHM type 1: FHM1) (3). More recently, missense mutations in the ATP1A2 gene on chromosome 1q23 encoding the α2 subunit of the Na+/K+ pump have been shown to be causative for FHM type 2 (FHM2) in up to 20% of FHM families (4,5), and a mutation in the neural voltage-gated sodium channel gene SCN1A on chromosome 2q24 has been identified in three FHM families (6). So far, three studies have shown that FHM2 may have a similar clinical variability to FHM1. In particular, progressive or episodic cerebellar symptoms may also be a clinical feature of FHM linked to chromosome 1q23 (5,7,8) and not only of FHM1 patients as initially supposed.
Phosphorous magnetic resonance spectroscopy (31P-MRS) studies measuring high-energy phosphates have demonstrated interictal impairment of energy metabolism of brain and skeletal muscle in patients with different subtypes of migraine (9,10), including two FHM families (11). The reduced energy potential was construed to be indicative of a reduced mitochondrial reservoir and was hypothesized to be one of the biochemical substrates of the susceptibility to attacks in migraine subjects (9). 31P-MRS studies also showed that the degree of brain metabolic deficit was positively correlated to the severity and/or duration of migraine aura (9,10,12,13).
In localized brain areas of interest, proton magnetic resonance spectroscopy (1H-MRS) allows the quantification of several metabolites including N-acetyl aspartate (NAA), a marker of neuron viability/density, myo-inositol (mI), a marker of glial cell proliferation and lactate, an index of anaerobic metabolism (14). 1H-MRS studies have yielded conflicting results in migraine patients (13,15). One 1H-MRS study (15) demonstrated a significant reduction of NAA and increase in mI in the superior cerebellar vermis of FHM1 patients. A combined 31P-MRS and 1H-MRS study (13) showed a reduced phosphocreatine/inorganic phosphate (PCr/Pi) ratio in the grey matter of the symptomatic hemisphere of patients with hemiplegic migraine and persistent aura (> 7 days), but 1H-MRS failed to disclose any metabolic changes in the cerebral white matter in patients or any association with duration or severity of symptoms. Among advanced MR techniques, diffusion-weighted imaging (DWI) and diffusion tensor imaging (DTI) have been extensively used to search for microstructural changes in neurodegenerative disorders (16). In particular, DWI/DTI allows a spatially localized calculation of the apparent diffusion coefficient (ADC) to quantify the random movements of water molecules (17). ADC values in neurodegenerative diseases are typically increased in the brain areas where modifications of the microstructural integrity occur (18).
The aim of the present study was to investigate brain microstructural integrity and metabolism, and skeletal muscle bioenergetics in patients with FHM2 using DWI and MRS.
Methods
Subjects
Clinical features of FHM2 patients at the time of MR scan

A, aphasia; Au, aura; BL, bilateral; H, hemiplegia; HA, headache; HA vs. ND, relation to HA side to side of neurological deficit; HM, hemiplegic migraine; IL, ipsilateral; MA, migraine with aura; MoA, migraine without aura; NS, not specified; N/V/P/P, nausea/vomiting/photophobia/phonophobia; S, sensory disturbances; TR, temporal relationship of aura and headache; UL, unilateral; V, visual disturbance; (−), not present; (+), present; (>), prior to.
MR studies
The MRI and MRS studies were carried out on a 1.5-T clinical whole body magnet (General Electric Medical Systems, Milwaukee, WI, USA). All patients underwent the same MR protocol on the same day, and all were scanned in the interictal period at least 1 month after the last hemiplegic migraine attack. Ten healthy age-matched women (34 ± 10 years) with no history of neurological diseases, in particular migraine or cerebrovascular accidents, were also studied.
The institutional review board of the Department of Neurological Sciences of the University of Bologna Medical School approved the project. All subjects gave written consent to participate in the study.
Brain MR
Brain MR was performed with a quadrature birdcage headcoil (25 cm in diameter). Conventional MRI included axial and sagittal T1-weighted spin-echo (SE), axial fluid-attenuated inversion recovery and axial fast spoiled gradient echo sequences.
Brain DWI
As previously reported (19), DWI images were obtained from axial slices with 5 mm thickness and 1 mm interslice gap. DWI was conducted using a SE single-shot echo planar imaging (EPI) technique with a pair of Stejskal–Tanner diffusion weighting gradient pulses. The EPI sequence was performed with α = 90°, TR = 10 s, TE = 100 ms, an in-plane resolution of 2.5 mm and phase encoding in anterior-posterior direction. The diffusion weighting gradients were applied on each of the three physical axes x, y and z in separate scans. Three different gradient strengths were chosen corresponding to b-factor values of 300, 600 and 900 s/mm2. In addition, images without diffusion weighting were acquired corresponding to b = 0 s/mm2 and exhibiting a T2 contrast. The ADC in each direction was determined pixel-wise using a least-squares fit, assuming a signal attenuation depending mono-exponentially on the b-value. By calculating the mean of three directions, the ADC map was generated (19). Regions of interest (ROIs) were defined bilaterally to include: dentate nucleus, cerebellar white matter, medium (MCP) and superior cerebellar peduncle (SCP), thalamus, basal ganglia, posterior limb of internal capsule, cerebral hemispheric white matter, optic radiation, and corpus callosum (genu and splenium). In order to include brain areas suffering from partial volume effects in the analysis without introducing significant operator dependence, histograms of ADC were generated for all pixels in the cerebral hemispheres, brainstem, vermis and cerebellar hemispheres, defined by manual segmentation (20,21). To exclude spaces containing only cerebrospinal fluid (CSF) from the ADC map histograms, we adopted a threshold value of 2.4 × 10⁻³ mm2/s following previous published work (21). The non-Gaussian ADC distribution was assessed by finding the 50th percentile values (medians) along with the mean (21). The evaluation of DWI data was performed by two raters (C.T. and G.R.), each blinded to the subjects' diagnoses.
Brain 1H-MR spectroscopy
Single voxel spectroscopy was performed using the point resolved spectroscopy sequence. In order to maximize the detection of lactate (22), a volume of interest (VOI) ranging from 5.1 to 5.9 cm3 was selected in the lateral ventricles to include mostly the CSF (TE = 288, TR = 1500, number of acquisitions = 384) (Fig. 1A). Two additional VOIs were prescribed in the medial parieto-occipital grey matter (TE = 35, TR = 4000, number of acquisitions = 32, volume = 18 cm3) and in the left parieto-occipital white matter (TE = 35, TR = 4000, number of acquisitions = 64, volume = 8 cm3).
Axial fast gradient echo image showing voxel localization in the lateral ventricles (A). Spectra (TE = 288 ms; TR = 1500 ms) from a healthy control (B) and from patient C1 (C) showing a mild pathological lactate accumulation. NAA, N-acetyl-aspartate; Cho, choline-containing compounds; tCr, creatine and phosphocreatine; Lac, lactate; ppm, parts per million.
Spectra were fitted in the frequency domain by a linear combination of a set of model spectra using the LCModel software package (23). Peak areas were calculated for NAA, creatine and PCr, choline-containing compounds (Cho) and mI. Peak integral values were expressed relative to the Cr peak.
Skeletal muscle 31P-MRS
31P-MRS investigations were performed as previously described (24). Subjects lay supine with a 6-cm diameter surface coil centred on the maximal circumference of the right calf muscle. Spectra were acquired with a repetition time of 5 s at rest (one spectrum with 128 averages), during an aerobic incremental exercise (individual number of spectra with 12 averages each), and the following recovery (32 spectra with two averages each). The muscle was exercised by plantar flexion at 0.66 Hz against a pedal using a pneumatic ergometer, and the force resistance of the pedal was 10% of lean body mass. After two spectra, the resistance was increased by 5% of lean body mass for each subsequent spectral acquisition. As soon as the last 12-average exercise spectrum was collected, the exercise was stopped and data were collected for an additional 5 min 20 s. Exercise was stopped when the PCr level was ≤ 50% of the resting level, as evaluated by eye from the scanner screen. Spectra were post-processed by a time-domain fitting program (AMARES/MRUI, http://www.mrui.uab.es/mrui/) and the concentrations of Pi and PCr were calculated by assuming a normal adenosine triphosphate (ATP) concentration of 8 m
Statistical analysis
Statistical analyses were performed using
Results
Brain MR
No signal intensity and morphology changes were present in any patients on conventional brain MRI.
Brain DWI
Right- and left-side ADC values were not statistically different for any of the selected ROIs and are reported as mean values. A good level of agreement was found between the two raters, without significant bias or trends in the ROI analysis: the mean difference ±
The ROI analysis demonstrated a significant increase of the mean ADC values in the cerebellar white matter (0.86 ± 0.05, mean ±
Histogram analysis (Fig. 2) showed higher median ADC values in the vermis (1.01 ± 0.03 vs. 0.93 ± 0.04; P = 0.002) and in the cerebellar hemispheres (0.90 ± 0.02 vs. 0.83 ± 0.03; P = 0.002) in FHM2 patients compared with healthy controls. Moreover, all the vermis and cerebellar hemisphere ADC values in the FHM2 patients exceeded the highest value in the healthy controls.
Scatterplot of median ADC values of both cerebral hemispheres, brainstem, cerebellar vermis, and both cerebellar hemispheres in patients with familial hemiplegic migraine (FHM) and healthy controls (Ctrl). Horizontal lines indicate the mean values. ***P < 0.01. ADC, apparent diffusion coefficient.
No significant differences (Fig. 2) were found in the median ADC values in the brainstem between patients (0.92 ± 0.08) and healthy controls (0.87 ± 0.04, P = 0.24), nor in the cerebral hemispheres (0.86 ± 0.02 vs. 0.85 ± 0.01, P = 0.45).
Brain 1H-MRS
In the FHM2 patients, NAA/Cr, Cho/Cr and mI/Cr in the cortex (1.37 ± 0.11, 0.16 ± 0.01, 0.72 ± 0.13) and in the white matter (1.80 ± 0.16, 0.30 ± 0.05, 0.87 ± 0.20) localizations showed no statistical difference from healthy controls (1.38 ± 0.09, 0.18 ± 0.03, 0.73 ± 0.08; and 1.76 ± 0.16, 0.34 ± 0.04, 0.84 ± 0.09, respectively) (P = 0.79, 0.11, 0.89 and P = 0.65, 0.23, 0.72, respectively). Cortical NAA/Cr (1.20) was just below the normal range (1.21–1.55) in patient B2 and a mild pathological increase in lactate content was detected in the lateral ventricles of patient C1 (Fig. 1B,C).
Skeletal muscle 31P-MRS
31P-MRS findings in patients and control subjects at rest, at the end of exercise and during the post-exercise recovery
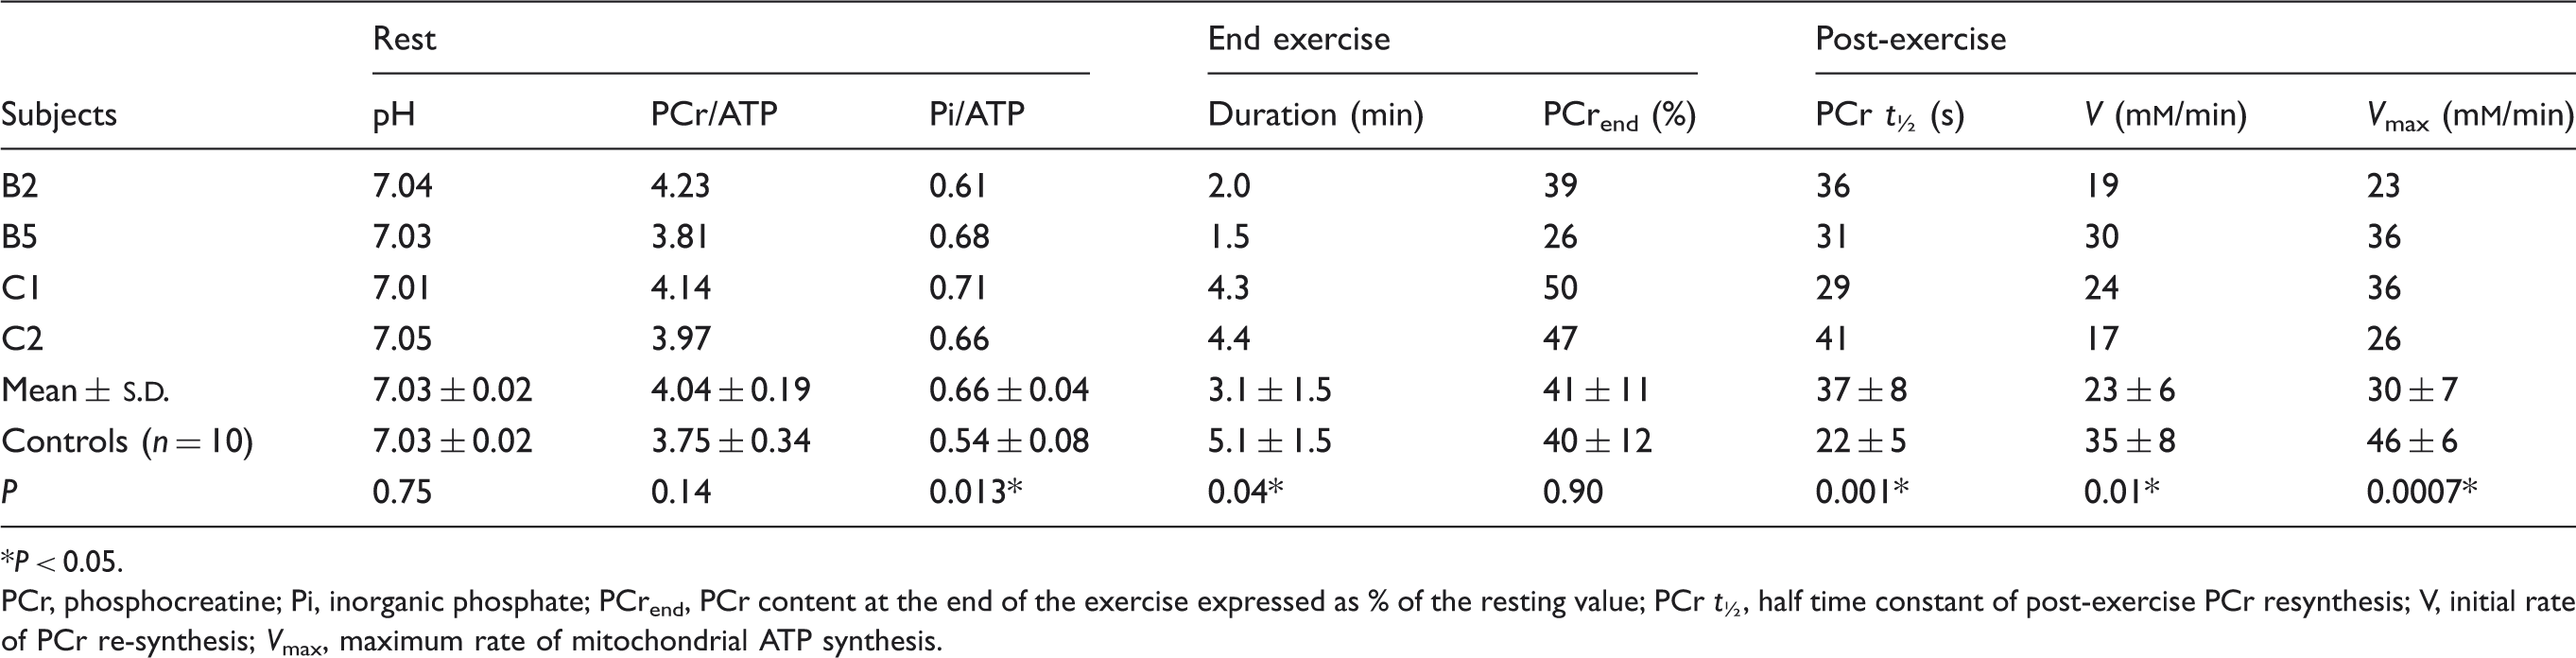
P < 0.05.
PCr, phosphocreatine; Pi, inorganic phosphate; PCrend, PCr content at the end of the exercise expressed as % of the resting value; PCr t ½, half time constant of post-exercise PCr resynthesis; V, initial rate of PCr re-synthesis; V max, maximum rate of mitochondrial ATP synthesis.
Clinical follow-up
Four years after the MR scans, follow-up neurological examination of patients B2 and B5 was unchanged, confirming interictal cerebellar deficits. However, mild interictal cerebellar dysarthria was disclosed in both patient C1, who presented ictal dysarthria at the time of the MR scan, and C2, who also reported ictal dysarthria in hemiplegic attacks occurring in the last 2 years. None of the patients developed skeletal muscle symptoms or signs.
Discussion
This study used multimodal MR techniques to investigate concomitant interictal brain microstructural changes and tissue energy metabolism in four patients with FHM2 belonging to two unrelated families. Our main finding was the significant increase in ADC values in the cerebellum and middle and superior cerebellar peduncles of FHM2 patients detected by DWI. Moreover, FHM2 patients showed a deficit of skeletal muscle energy metabolism and, in one case, increased brain ventricular lactate content.
31P-MRS confirmed the defective energy metabolism in skeletal muscle detected in two FHM patients (11) and in other non-familial subtypes of MA or migraine without aura (MoA) (27). To our knowledge, this is the first report on patients with the type 2 FHM secondary to mutation in the 1q23 chromosome ATP1A2 gene.
Brain 1H-MRS did not disclose any significant abnormality in the grey and white matter of FHM2 patients when compared as a group with controls. These results are in line with the findings of Schulz and colleagues (13) on MA patients. Their study population also included six patients with hemiplegic aura diagnosed on the basis of the International Classification of Headache Disorders: 2nd edn, criteria but they lacked a genetic profile and data on disease duration were not reported.
We found isolated brain 1H-MRS alterations in two patients: a mild reduction of NAA to Cr ratio in the parieto-occipital cortex in patient B2 and a mild increase in lactate content in the lateral ventricles' CSF of patient C1. The reduction in cortical NAA/Cr has been described in MA patients during the interictal period (28), and interpreted as consequence of less efficient mitochondrial function in MA patients. In our study, a mild reduction of cortical NAA to Cr ratio was found in the oldest patient with the longest disease duration.
Elevated interictal levels of cerebral lactate have been described in the visual brain of a few migraine patients (29,30), more evidently in migraine patients who had experienced an attack within the previous 2 months (30). CSF lactate is not detectable in healthy controls at 1.5 T (22) and its accumulation is related to energy metabolism impairment, typical of mitochondrial diseases (22,31).
The main finding of this study was the detection of cerebellar DWI alterations in all FHM2 patients examined (Fig. 2). DWI changes also affected the middle and superior cerebellar peduncles, main cerebellar afferent and efferent pathways, respectively. The existing literature on DWI studies in FHM patients is limited and confined to case reports conducted on patients without a genetic characterization of the disease (32,33) or in one case (34) on a patient with FHM associated with CACNA1A gene mutation. All these studies were performed during the ictal phase of the hemiplegic aura and after clinical recovery to investigate changes associated with the prolonged neurological deficits of the aura phenomenon. Two studies (33,34) found reversible decreased water diffusion contralateral to the clinically affected side in two patients with FHM, which, however, was not confirmed in a single FHM patient by Oberndorfer and colleagues (32). Our results are hardly comparable with these previous findings because the study was conducted during the interictal period. Our FHM2 patients showed interictal DWI abnormalities in the vermis and cerebellar hemispheres consistent with neurodegenerative changes, suggesting that the cerebellar interictal dysfunction observed in these patients could be the result of microstructural changes in cerebellar structures. At the time of MR investigations, some degree of cerebellar involvement was present in three out of four FHM2 patients during HM attacks and in two as a permanent neurological deficit. Only one patient (C2) did not present cerebellar deficits either ictally or interictally (Table 1). However, clinical follow-up revealed that after 4 years all patients showed cerebellar involvement during hemiplegic attacks and also as a chronic impairment. These results suggest that despite normal structural MRI, MR DWI may disclose a structural cerebellar dysfunction preceding the onset of cerebellar symptoms in FHM2 patients.
Diffusivity values were found to be increased in the cerebellum of patients with SCA1 and SCA2 or cerebellar cortical atrophy, showing good correlation with clinical severity (20). Several studies have shown that analysis of ADC maps derived from diffusion-weighted MRI can detect markers of neurodegeneration even in the absence of alterations on conventional MRI (16,18). The lower sensitivity of conventional MRI may explain, besides phenotypic variability, why cerebellar atrophy so far has been detected only in one 72-year-old FHM2 patient (35).
An additional interesting result was that our FHM2 patients showed, as a group, a significant increase in mean ADC values in the optic radiations compared with healthy controls. A previous DTI study showed microscopic changes in optic radiations in patients with visual aura (36). Consistently, all our FHM2 patients experienced visual aura during at least some of the headache attacks.
The biochemical basis of neural dysfunction in FHM2 is still a matter of debate (37).
Studies on the murine model of FHM2 have shown that the α2 subunit of the Na+/K+ pump is mainly expressed in the glial cells of the adult (38), where it plays an important role in clearance of K+ from the extracellular space and in glutamate clearance by glial cells during neuronal activity. A similar pathophysiological mechanism may be hypothesized at cerebellar level.
In conclusion, our study suggests that a multisystem energy metabolism defect characterizes FHM2 and that cerebellar neurodegeneration can be detected in FHM2 patients by brain DWI even before the onset of the interictal cerebellar symptoms. Further studies with a larger sample of subjects longitudinally evaluated are needed for better clarification of the relationship between clinical and neuroimaging findings in FHM2.
Footnotes
Acknowledgements
The authors thank the patients for participating in the study, A. Collins for editing the English text, Dr M. Dichgans for performing the genetic analysis of FHM2 patients, and Dr S. Zanigni and E. Sancisi for helping with patient management.