
Abstract
Objective
To identify possible structural connectivity alterations in patients with episodic and chronic migraine using magnetic resonance imaging data.
Methods
Fifty-four episodic migraine, 56 chronic migraine patients and 50 controls underwent T1-weighted and diffusion-weighted magnetic resonance imaging acquisitions. Number of streamlines (trajectories of estimated fiber-tracts), mean fractional anisotropy, axial diffusivity and radial diffusivity were the connectome measures. Correlation analysis between connectome measures and duration and frequency of migraine was performed.
Results
Higher and lower number of streamlines were found in connections involving regions like the superior frontal gyrus when comparing episodic and chronic migraineurs with controls (p < .05 false discovery rate). Between the left caudal anterior cingulate and right superior frontal gyri, more streamlines were found in chronic compared to episodic migraine. Higher and lower fractional anisotropy, axial diffusivity, and radial diffusivity were found between migraine groups and controls in connections involving regions like the hippocampus. Lower radial diffusivity and axial diffusivity were found in chronic compared to episodic migraine in connections involving regions like the putamen. In chronic migraine, duration of migraine was positively correlated with fractional anisotropy and axial diffusivity.
Conclusions
Structural strengthening of connections involving subcortical regions associated with pain processing and weakening in connections involving cortical regions associated with hyperexcitability may coexist in migraine.
Keywords
Abbreviations
five-tissue-type anatomically-constrained tractography axial diffusivity analysis of covariance chronic migraine diffusion magnetic resonance imaging diffusion tensor imaging diffusion-weighted imaging episodic migraine fractional anisotropy fiber orientation distribution healthy controls International Classification of Headache Disorders, 3rd edition radial diffusivity tract-based spatial statistics echo time repetition time.
Introduction
Chronic migraine (CM) is defined as the presence of headache during 15 or more days per month, with pain of migrainous characteristics at least during eight of those days (1). Although many modifiable and non-modifiable risk factors for evolution from episodic migraine (EM) to CM have been proposed, whether EM and CM are two ranges of the same entity, or two different clinical entities, is still a matter of controversy (2).
White matter alterations in migraine patients have been reported. Rocca et al. described diffusion changes in the optic radiation in migraine patients using diffusion tensor tractography (3). Messina et al. suggested hyperexcitability and early involvement of white matter tracts in migraine, using pediatric patients (4).
Among the various technological tools that can be employed to study the migrainous brain, connectomics is one of the most powerful given the huge amount of data that can be extracted for further analysis. A connectome refers to a description of brain connectivity, a comprehensive map of the full set of elements and inter-connections comprising the brain (5). Magnetic resonance imaging (MRI) has been employed to map the human connectome. Diffusion MRI (dMRI) has been used to map the macro-scale axonal structure, while functional MRI has been used to characterize dynamical properties related to brain activity (5).
To analyze structural connectivity differences between migraine patients and healthy controls, dMRI-based tractography offers unique abilities to map whole-brain structural connections (6). In the case of migraine, previous studies using tractography have found differences between migraine patients and healthy controls in the cingulate gyrus, thalamic radiation, superior longitudinal fasciculus and corticospinal tract (7,8).
More specific structural connectivity studies using diffusion tensor imaging (DTI), comparing migraine patients without aura and healthy controls, were carried out with graph theory as the analyzing method to derive global descriptors of brain connectivity. Graph theory models the brain as a set of nodes (vertices) linked by connections (edges), providing an abstract representation of brain regions (nodes) and their interactions (9). Liu et al. (2013) reported longer global distance connection in patients with migraine, with a lower number of short-distance connections, but a higher number of medium-distance connections, with respect to healthy controls (10). Some studies have reported increased network integration and higher global efficiency in the brain of migraine patients, which could suggest that the brain network in migraine is clustered (10–12). Furthermore, a decoupling between structural and functional connectivity in patients with migraine was reported by Li et al. (2017) (11).
Previous studies have analyzed white matter diffusion alterations in CM patients. Gomez-Beldarrain et al. have reported decreased FA values in CM patients with therapy after six months’ follow-up, with respect to healthy controls, in anterior white matter tracts (13). In the same study, however, no EM patients were included in the final analyzed sample because some CM patients reverted to EM during the follow-up. Neeb et al., on the other hand, have compared healthy controls, EM and CM patients, obtaining no significant differences between the groups (14).
However, no specific structural connectivity studies assessing connections between gray matter regions using dMRI or DTI have been performed to study patients with CM, to the best of our knowledge.
The present study performs a detailed comparison of the white matter in EM, CM and healthy controls over a large cohort of subjects, using dMRI data. We hypothesized that there could be structural connectivity changes in migraine patients compared to controls, and that there could be changes also between EM and CM. In contrast to studies that have used graph theory, we analyzed connections between each pair of gray matter regions, using directly the number of streamlines and diffusion descriptors; that is, measures obtained from DTI. Our goals were:
To investigate whether there are significant structural connectivity differences between CM and EM and compared to healthy controls. To that end, whole-brain structural connectomics was employed as a dMRI analysis technique (5,6). To examine possible relationships between structural connectivity measures based on dMRI or DTI and clinical features in migraine patients. Furthermore, possible differences in CM compared to EM in these relationships are especially interesting.
Materials and methods
Participants
We conducted an analytical observational study with a case-control design. Migraine patients were screened and recruited from the headache unit at the Hospital Clínico Universitario de Valladolid (Valladolid, Spain). We screened patients who had been referred to the above-mentioned unit due to migraine on their first visit. We included patients with a definite diagnosis of EM or CM according to the third edition of the International Classification of Headache Disorders (ICHD-3 and ICHD-3 beta) (1,15), aged between 18 and 60. The patients included in the sample had had a stable clinical situation during the three months before the visit, were preventive treatment naïve, migraine onset had taken place before the age of 50, and they had suffered from migraine for more than a year. In order to avoid confusion between high frequency EM and CM (16), we excluded patients suffering headache on 10–14 days per month. Patients had been asked to keep a migraine diary during three months before inclusion. We also excluded patients if they had other painful conditions apart from headache for more than 9 days per month; had other primary or secondary headaches, except infrequent tension-type headache or medication overuse headache; had other neurological diseases, or were pregnant. We additionally excluded patients with mood disorders (both previously diagnosed or detected by scores from the Hospital Anxiety and Depression Scale (17)). If a preventive treatment was prescribed at the visit, MRI acquisition was performed before starting the prophylactic. Among healthy controls (HC), we excluded those with a present or past history of migraine, other headache disorders other than infrequent tension-type headache, or a prior history of other neurological or psychiatric diseases. We used a non-probabilistic sampling method by convenience sampling. Healthy controls balanced for age and sex were recruited through hospital and University colleagues and advertisements in these facilities by convenience sampling and snowball sampling.
For all patients, sociodemographic and clinical data were collected, including the duration of migraine disease (years), headache and migraine frequency (days per month) and time from the onset of chronic migraine (months) when applicable. We considered the use of symptomatic medication to determine if patients fulfilled the criteria of acute medication overuse (combination of analgesics and triptan intake at 10 or more days per month). The presence of aura was also gathered.
The local Ethics Committee of Hospital Clínico Universitario de Valladolid approved the study (PI: 14-197). All participants read and signed a written consent form prior to their participation.
MRI acquisition
Images were acquired for migraine patients during interictal periods (defined as at least 24 hours from last migraine attack) and between one and two weeks after the clinical visit. High-resolution 3D T1-weighted and diffusion-weighted MRI data were acquired using a Philips Achieva 3 T MRI unit (Philips Healthcare, Best, The Netherlands) with a 32-channel head coil in the MRI facility at the Universidad de Valladolid (Valladolid, Spain).
For the anatomical T1-weighted images, the following acquisition parameters were used: Turbo Field Echo sequence, repetition time (TR) = 8.1 ms, echo time (TE) = 3.7 ms, flip angle = 8°, 256 × 256 matrix size, 1 × 1 × 1 mm3 of spatial resolution and 160 slices covering the whole brain.
Diffusion-weighted images (DWI) were obtained using the following parameters: TR = 9000 ms, TE = 86 ms, flip angle = 90°, 61 gradient directions, one baseline volume, b-value = 1000 s/mm2, 128 × 128 matrix size, 2 × 2 × 2 mm3 of spatial resolution and 66 axial slices covering the whole brain.
T1 and diffusion-weighted scans were acquired during the same session, starting with the T1 scan followed by the diffusion-weighted scan, between May 2014 and July 2018. Total acquisition time for each subject was around 18 minutes.
Image processing
MRI images were processed to carry out connectomics (5,6).
Firstly, non-brain tissue from the T1-weighted images was removed using the brain extraction tool (BET) from FSL (18,19). Afterwards, automatic gray matter parcellation was computed using FreeSurfer, previously described in detail in (20). The automatic parcellations from FreeSurfer were manually inspected and quality checked.
Separately, diverse preprocessing steps were applied to the DWI data. Diffusion-weighted images were denoised, using the “dwidenoise” tool from MRtrix (21,22), eddy currents and motion corrected, using the “dwipreproc” tool from MRtrix (23), and B1 field inhomogeneity corrected, using the “dwibiascorrect” tool with the “-fast” option from MRtrix (24,25).
After the DWI preprocessing, a whole brain mask for each diffusion image was generated using the “dwi2mask” tool from MRtrix (26). With the brain mask and the preprocessed diffusion images, diffusion tensors at each voxel were estimated using the “dtifit” tool from FSL, obtaining fractional anisotropy (FA) and axial diffusivity (AD) maps among diverse measures. Radial diffusivity (RD) maps were manually obtained calculating the mean of the second and third eigenvalues from the diffusion tensor, values obtained previously with “dtifit”.
Anatomically-constrained tractography (ACT) was employed as the tractography method (27). Prior to tractography, five-tissue-type (5TT) segmented images for each subject were obtained from the T1-weighted images and the cortical parcellations. The “5ttgen” tool from MRtrix was used to have suitable 5TT images for ACT (27). In each subject, the 5TT image and the parcellation from FreeSurfer were linearly registered to the FA image using the FLIRT tool from FSL (28).
Apart from the 5TT images, ACT also needs fiber orientation distributions (FOD) estimations from the DWIs. This, in turn, needs a previous estimation of a response function, which was obtained using the “dwi2response” tool from MRtrix (29). Afterwards, FODs were obtained by spherical deconvolution using the “dwi2fod” tool from MRtrix (30,31). Then, probabilistic tractography was executed using the “tckgen” tool from MRtrix (32), obtaining 10 million streamlines per subject. A streamline is defined as each of the trajectories that the tractography algorithm computes when employing the diffusion MRI information to obtain a representation of the estimated white matter fiber-tracts. Afterwards, the fiber-tracking data were filtered using the Spherical-deconvolution Informed Filtering of Tractograms (SIFT2) algorithm (33), which finds an appropriate cross-section multiplier for each streamline.
Finally, structural connectivity matrices were computed from the filtered tractography output and the registered gray matter segmentation volumes. 84 × 84 connectivity matrices, corresponding to the 84 cortical and subcortical regions from the Desikan-Killiany atlas (34), were obtained using mean FA, mean AD, mean RD and the number of streamlines in each connection as connectome metrics. Due to the tractography method that we have employed, the obtained trajectories (streamlines) are non-directional, which means that there is no information about the directionality of the connections. Thus, the connectivity matrices are symmetric by construction, and values on one side of the main diagonal are equal to those on the other side. Therefore, only one half (plus the main diagonal) of the connectivity matrix is relevant and employed for further analysis.
Due to the tractography method employed, it is possible that streamlines start and end in different points belonging to the same gray matter region from the Desikan-Killiany atlas. For this reason, these connections or “self-connections”; that is, connections with streamlines that start and end in areas from a unique region, were also included in the analysis. For example, a group of streamlines with its starting point in the anterior insula and finishing point in the posterior insula would be a self-connection insula-insula.
A summary of the whole MRI processing pipeline can be seen in Figure 1.
MRI processing pipeline. Schematic diagram depicting the procedure followed in order to obtain the structural connectivity matrices. Connectivity circular graph of connections with significant differences in number of streamlines. Connections in blue represent connections with less streamlines in migraine patients compared to healthy controls. Connections in warm colors represent connections with more streamlines in migraine patients compared to healthy controls. Thicker lines and colors closer to dark red and dark blue represent lower level of significance in the comparison between both types of migraine and healthy controls.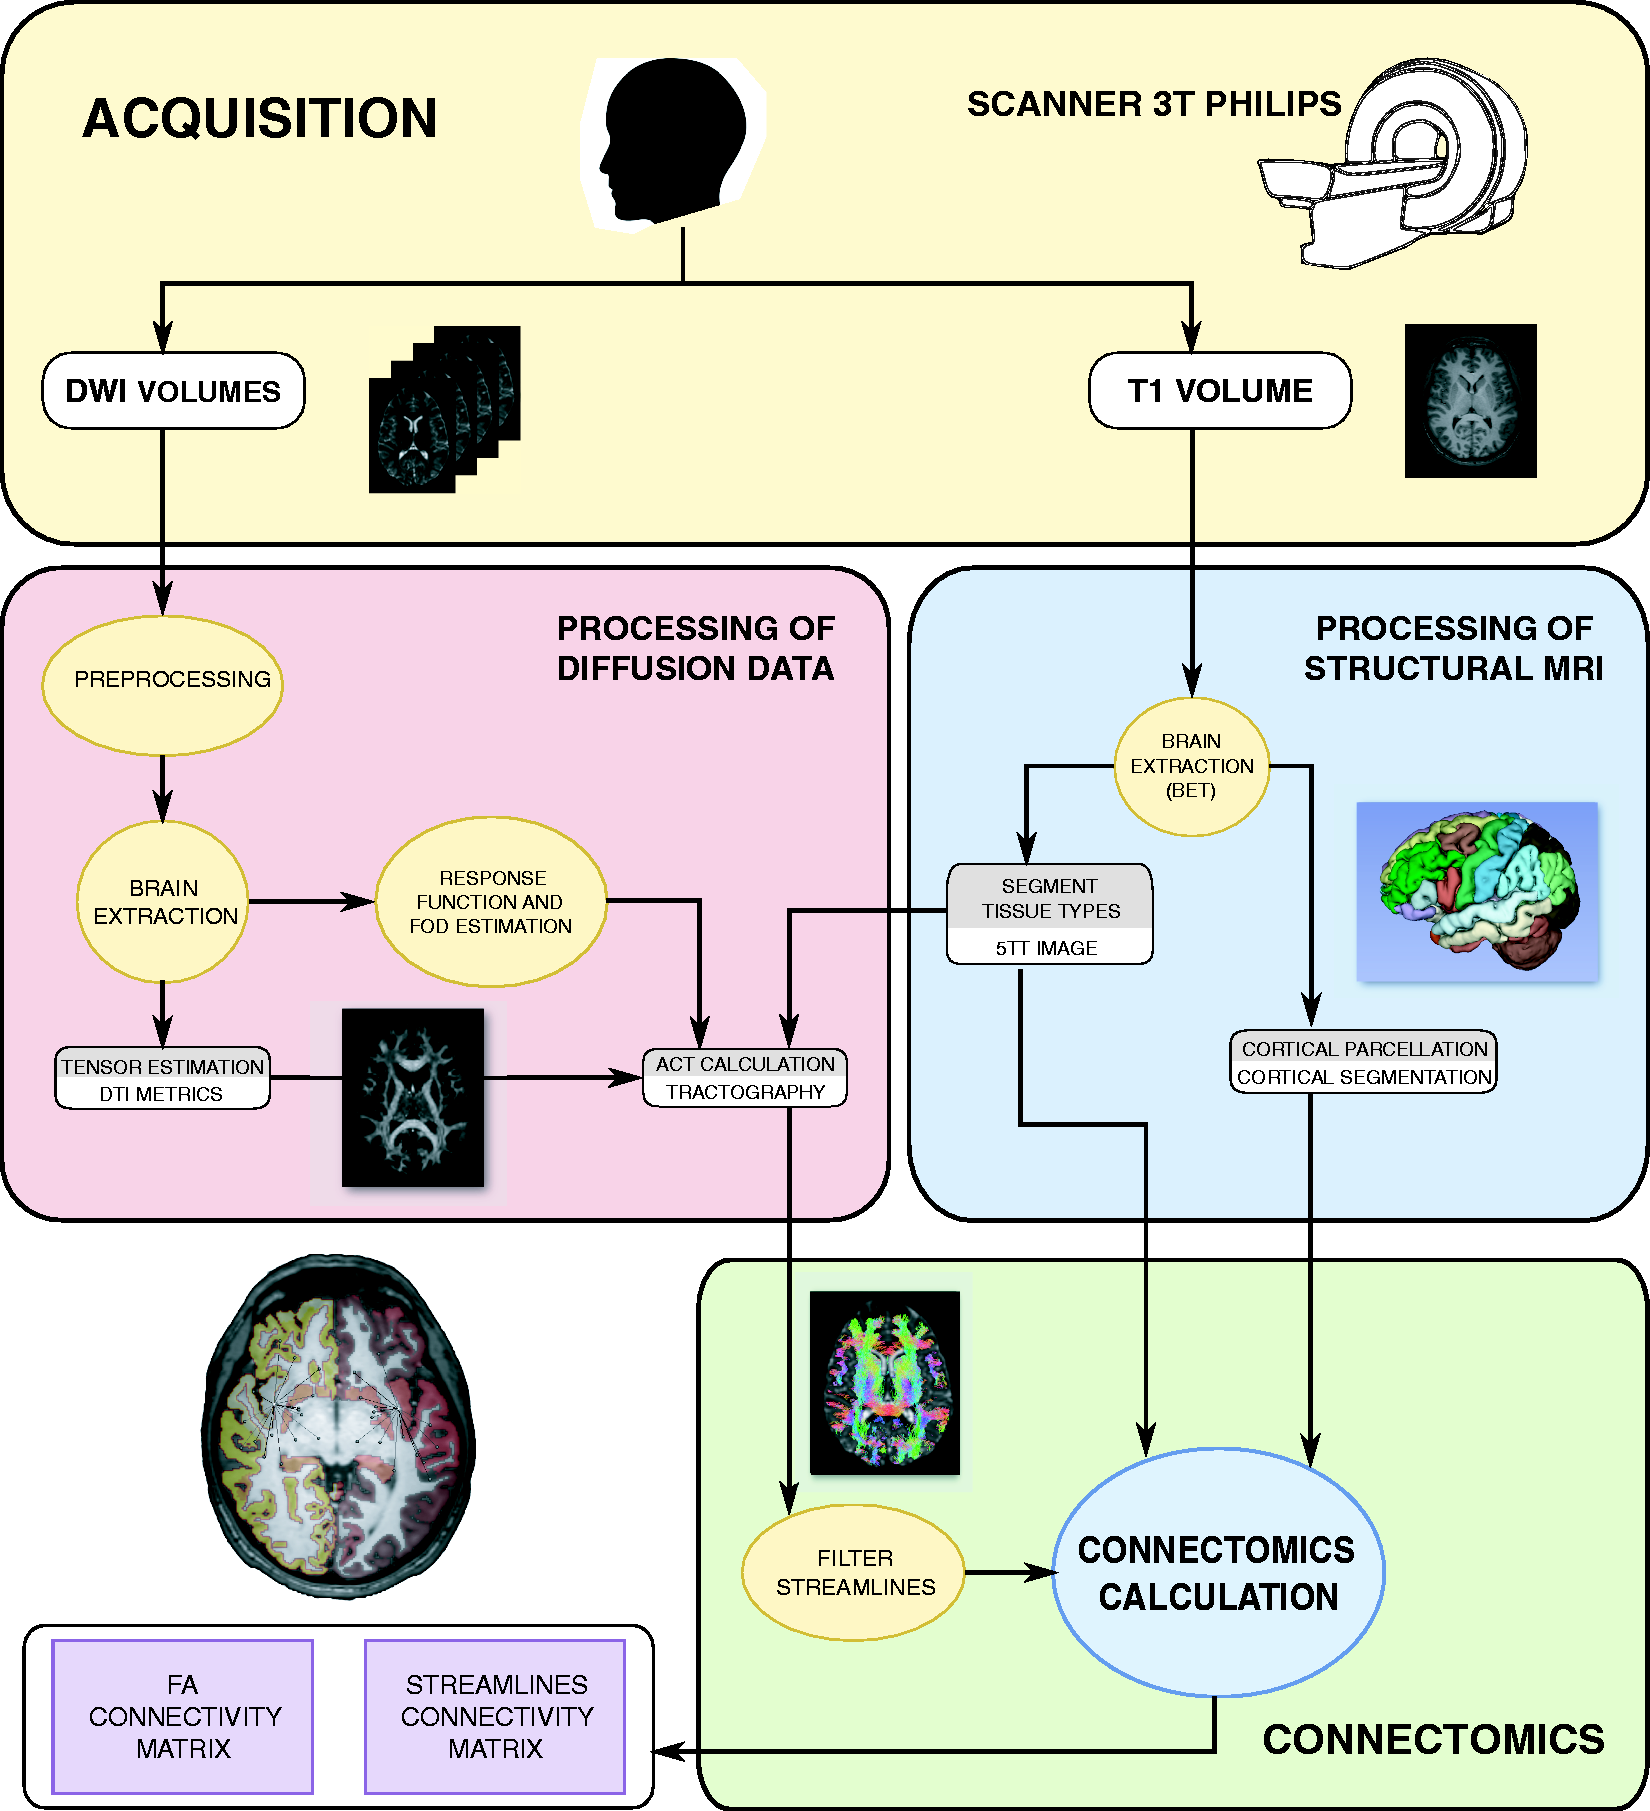

Statistical analysis
We estimated sample size according to Chong and Schwedt (2015) (7). We calculated a worst possible scenario model with an estimated effect size of a difference between groups of .02 and a variance of .003; a type 1-error rate of 1% and 80% power and anticipating a proportion of 10% of lost patients. The expected sample size was 167 participants.
To test for significant sex differences between the three groups, a chi-square test was used. In the case of comparisons of categorical data between only both groups of migraine patients, Fisher’s exact test was used.
The Kolmogorov-Smirnov test and Levene’s test for equality of variances were used to assess normality and homogeneity of variance in the continuous data, including clinical and demographic data, and values from the connectivity matrices. If continuous data met normality and homogeneity of variance assumptions (when comparing three groups), a one-way ANOVA was used; otherwise, the Kruskal-Wallis test was employed. To compare continuous clinical features between migraine patients, a two-tailed unpaired t-test was used if the clinical variables met normality and homogeneity of variance assumptions; otherwise, the Mann-Whitney U test was employed. To assess differences between two groups in the case of connectome metrics, Tukey-Kramer was the corresponding post-hoc test from the ANOVA test, and the Conover-Iman test was the post-hoc test from the Kruskal-Wallis test.
In order to analyze the structural connectivity matrices, first the mean number of streamlines in each connection (cell from the connectivity matrix) was computed for each group (HC, EM and CM). Next, connections with less than 1000 streamlines (group mean) in all three groups were discarded in order to exclude weak connections from further analysis, due to possible unreliability of the results in these connections. The analysis of the metrics in the remaining connections was previously explained in this section.
Effect size was computed using Cohen’s d value in regions with significant results. For every comparison, the mean value of the “most disabled” group was subtracted from the mean value of the “least disabled” or the control group. In the comparisons between both types of migraine, CM is considered the most disabled group, and EM the least disabled group.
To study the relationship between clinical parameters and dMRI-DTI descriptors, Spearman’s rank correlation coefficient was employed. The analyzed continuous clinical parameters can be seen in the Participants section. Number of streamlines, mean FA, mean AD and mean RD were considered for the correlation analysis. Connections selected for the correlation analysis were those for which significant differences were found between at least two groups in the analysis of connectome metrics.
To correct for multiple comparisons, the Benjamini-Hochberg false discovery rate procedure (35) was applied in the analysis of the connectome metrics and in the correlation analysis.
In all cases, the level of statistical significance was set at p < .05.
Results
Clinical and demographic characteristics of healthy controls (HC), episodic migraine (EM) and chronic migraine (CM) patients. Data are expressed as means ± SD.

Chi-square test.
Kruskal-Wallis test.
Two-tailed, unpaired Student’s t-test.
Mann-Whitney U test.
**Fisher’s exact test.
Considering the significant differences in duration of migraine history between EM and CM patients (Table 1), an analysis of covariance (ANCOVA) was additionally computed including the duration of the migraine as a covariate firstly, and sex and presence of aura afterwards.
Connectomics analysis
Six hundred and twenty (620) connections out of 3570 were finally analyzed after surviving the exclusion criterion; that is, having a mean number of streamlines above 1000 for any of the three groups of subjects. After the multiple comparisons correction, the critical p-value for the results was .00051; that is, only the tests (ANOVA or Kruskal-Wallis) with p-values equal or lower than this critical p-value (for number of streamlines, mean FA, mean AD or mean RD) survived the correction. Significant differences were found in a total of 26 pairs connection-metric. These are 17 connections for the number of streamlines, three connections for the mean FA, four connections for the mean AD and two connections for the mean RD. These results were obtained considering EM and CM patients as different groups; that is, there was not a unique migraine group in the comparisons.
Regarding the number of streamlines, migraineurs showed lower (seven connections) and higher (11 connections) number of streamlines compared to HC (Table 2 and Figure 2). In one connection, CM had more streamlines with respect to EM patients (Table 2).
Connectivity circular graph of connections with significant differences in FA, MD and RD. Connections in blue represent connections with decreased connectome measure in migraine patients compared to healthy controls. Connections in warm colors represent connections with increased connectome measure in migraine patients compared to healthy controls. Thicker lines and colors closer to dark red and dark blue represent lower level of significance in the comparison between both types of migraine and healthy controls. Brain connections number of streamlines comparison between healthy controls (HC), episodic migraine (EM) and chronic migraine (CM) patients. L: left; R: right; STS: superior temporal sulcus; #: number. Note: Tukey-Kramer post hoc test was used for pairwise comparisons. The first seven rows represent connections where one or both groups of migraine patients had lower values compared to healthy controls and differences between both groups of migraine patients were not observed. The next nine rows represent connections where one or both groups of migraine patients had greater values compared to healthy controls and no differences between both groups of migraine patients were observed. The last row represents the connection where significant differences between both groups of migraine patients were observed. When the first two columns contain the same region, they represent a self-connection. Data are expressed as means ± SD. All p-values from ANOVA/Kruskal-Wallis test were equal or lower than .00051.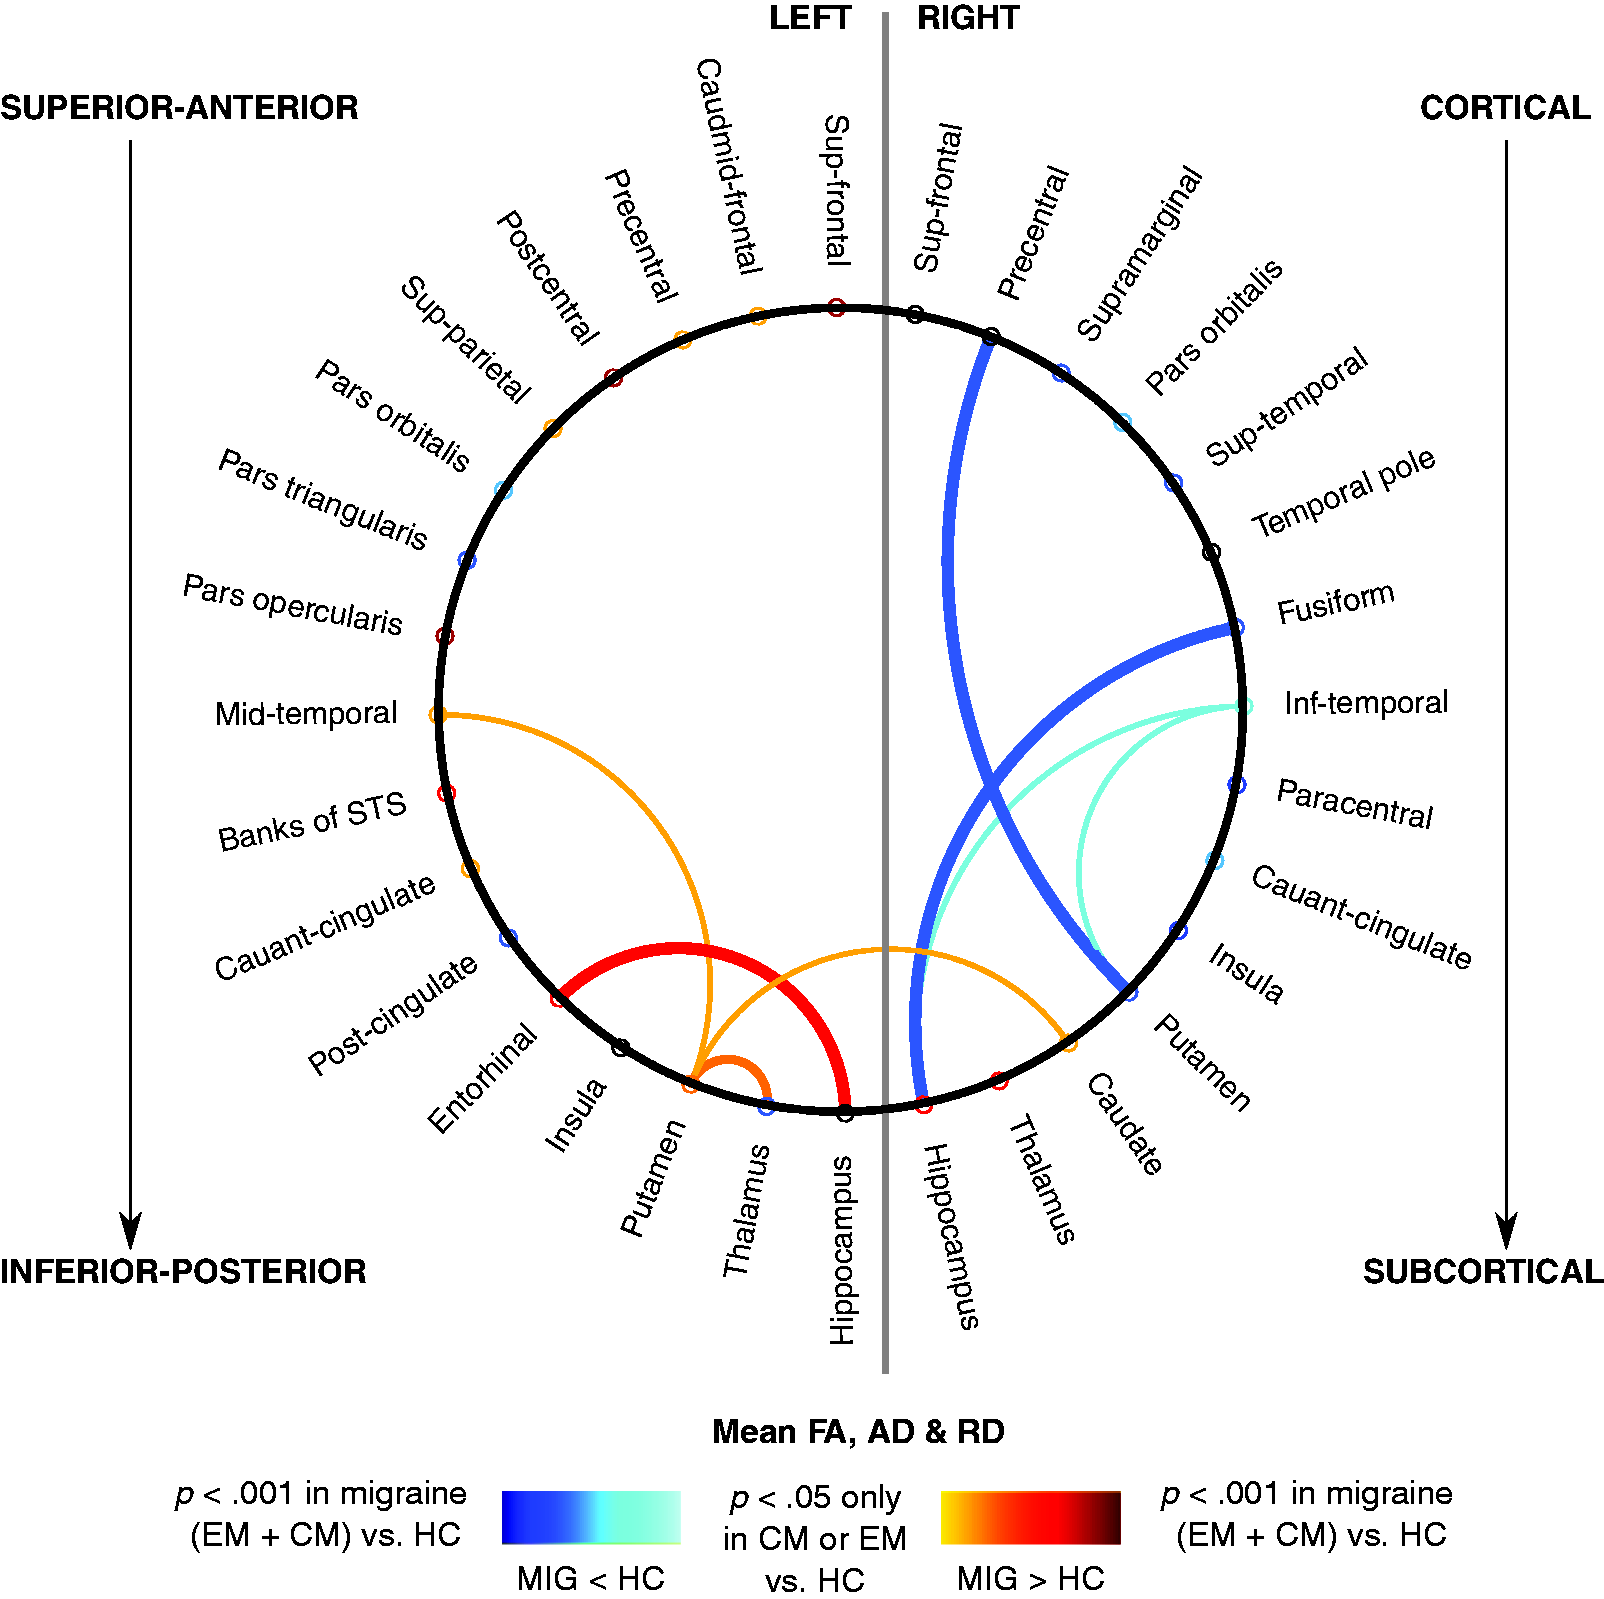

Brain connections mean FA and mean AD comparison between healthy controls (HC), episodic migraine (EM) and chronic migraine (CM) patients.

AD: axial diffusivity; FA: fractional anisotropy; L: left; R: right; RD: radial diffusivity.
Note: Tukey-Kramer post hoc test was used, where significant differences were observed. Data are expressed as means ± SD. AD is expressed in units of mm2 s−1 × 10⁻⁵, RD is expressed in units of mm2 s−1 × 10⁻⁶ and FA is dimensionless. All p-values from ANOVA/Kruskal-Wallis test were equal or lower than .00051.
As for AD, both increased and decreased mean AD values were found in migraine patients with respect to healthy controls in four connections. Additionally, significant differences between CM and EM were detected in two of these four cases. Mean AD results are shown in Table 3 and Figure 3.
In the case of RD, increased values were found in migraine patients compared to healthy controls in two connections. Moreover, significant differences between CM and EM were detected in one of these two cases. Mean RD results are shown in Table 3 and Figure 3.
Brain connections number of streamlines comparison between healthy controls (HC), episodic migraine (EM) and chronic migraine (CM) patients including duration of migraine history as a covariate.
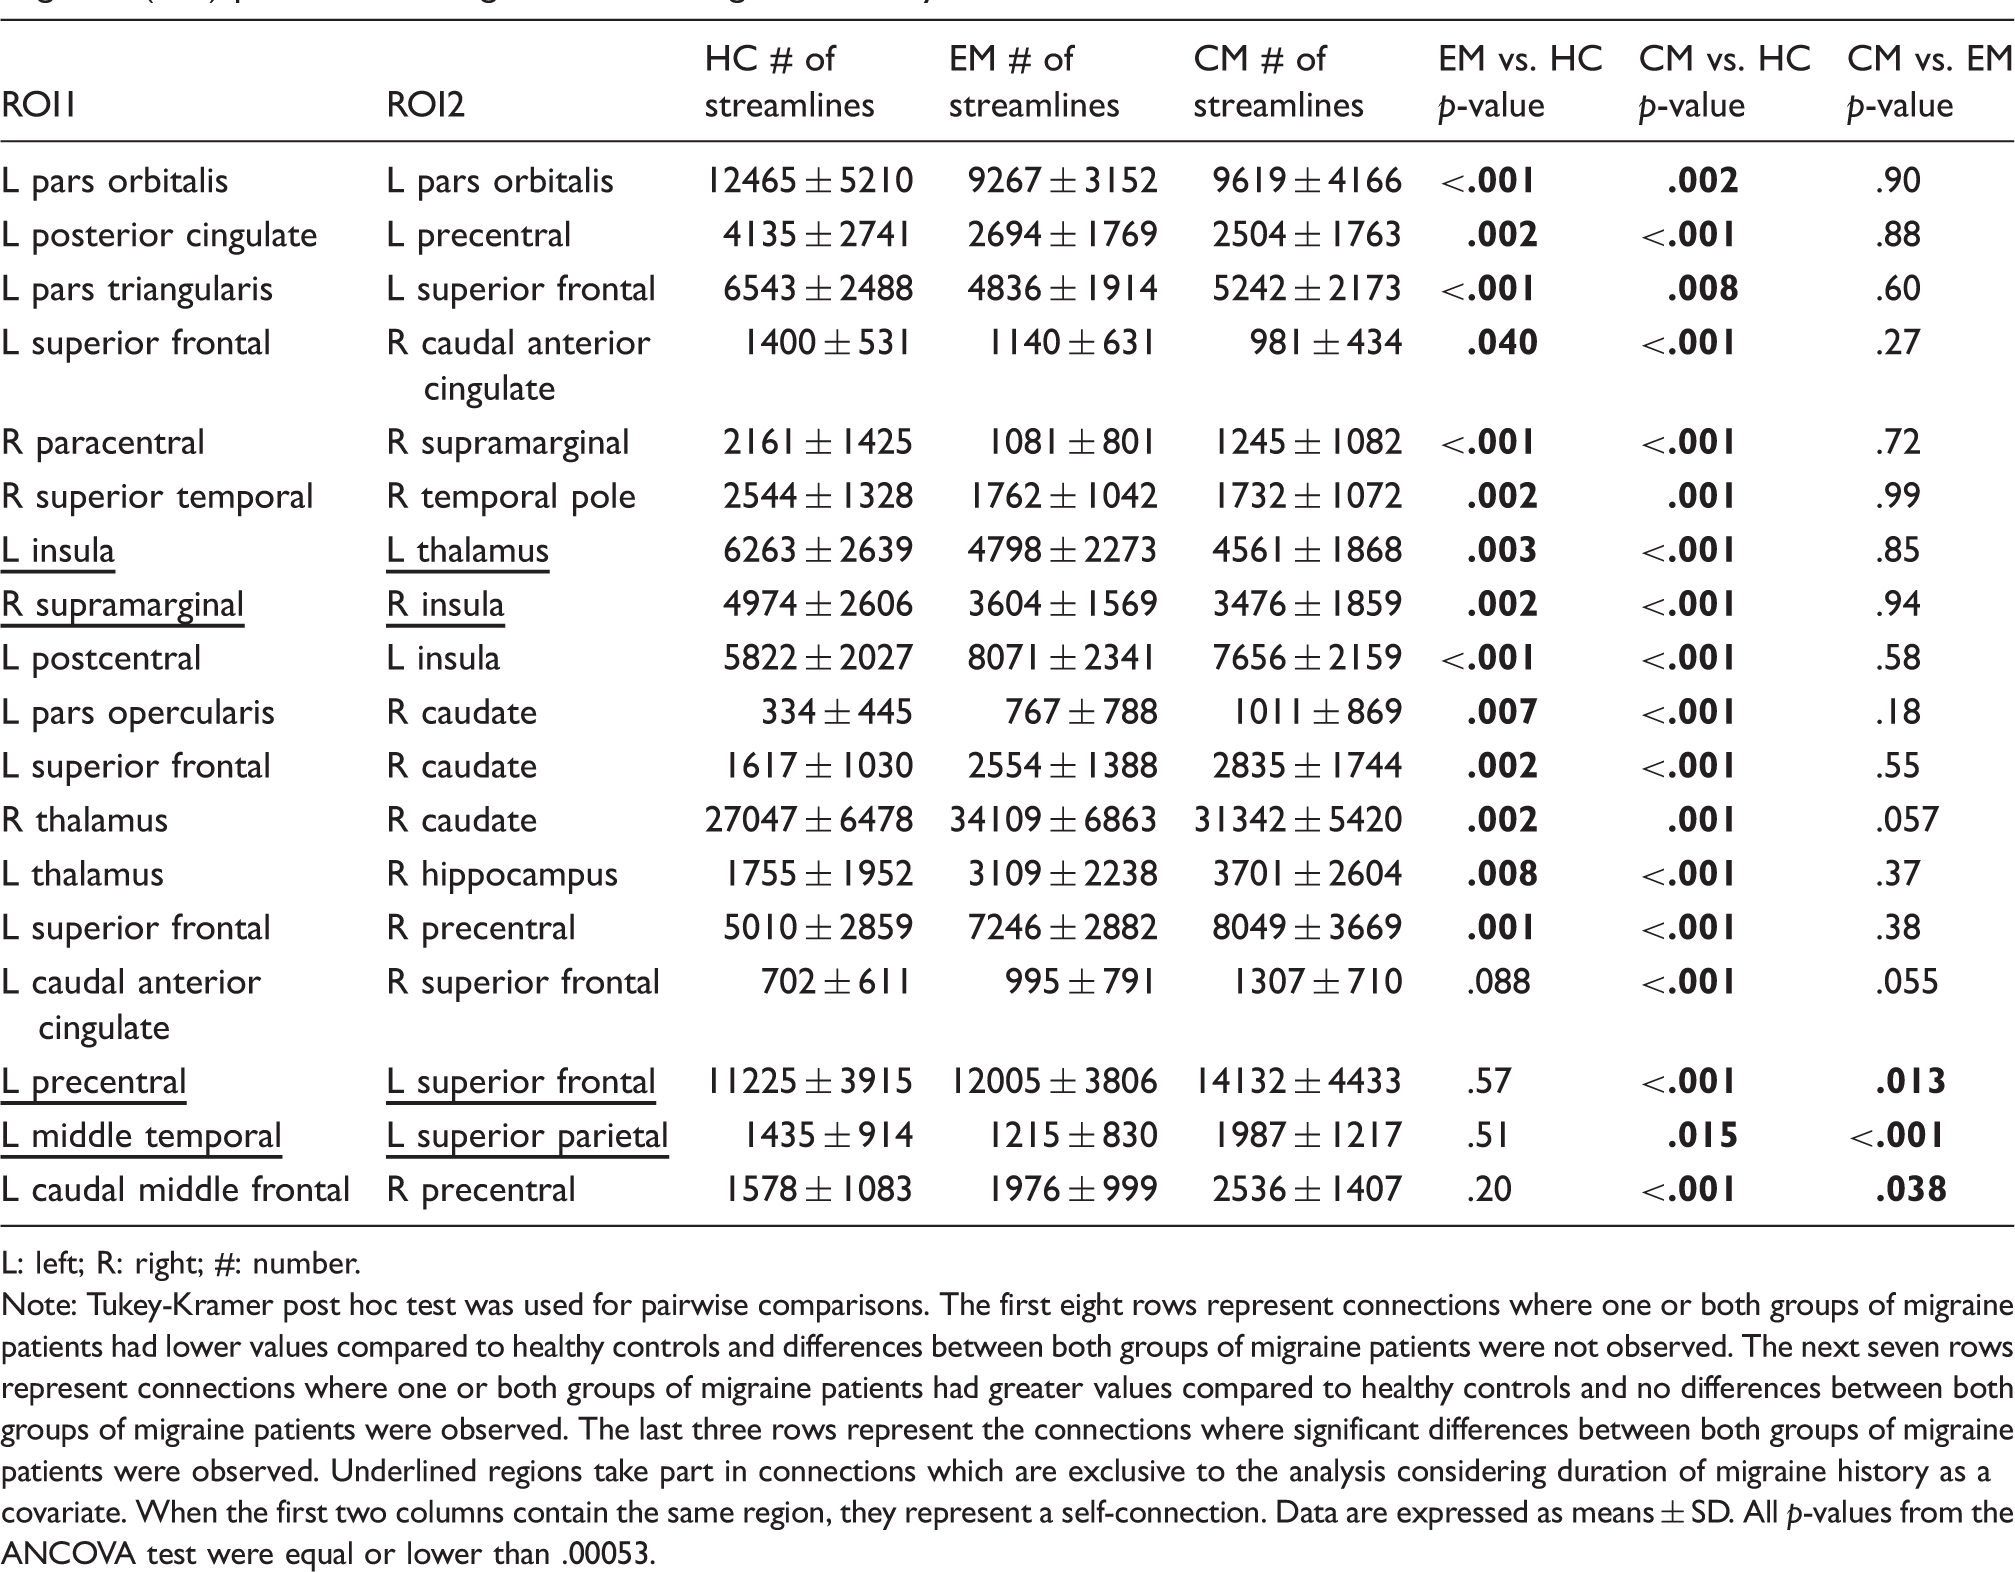
L: left; R: right; #: number.
Note: Tukey-Kramer post hoc test was used for pairwise comparisons. The first eight rows represent connections where one or both groups of migraine patients had lower values compared to healthy controls and differences between both groups of migraine patients were not observed. The next seven rows represent connections where one or both groups of migraine patients had greater values compared to healthy controls and no differences between both groups of migraine patients were observed. The last three rows represent the connections where significant differences between both groups of migraine patients were observed. Underlined regions take part in connections which are exclusive to the analysis considering duration of migraine history as a covariate. When the first two columns contain the same region, they represent a self-connection. Data are expressed as means ± SD. All p-values from the ANCOVA test were equal or lower than .00053.
With respect to the ANCOVA analysis adding sex and presence of aura as covariates, there were no changes compared to the analysis that included only the duration of migraine history as a covariate.
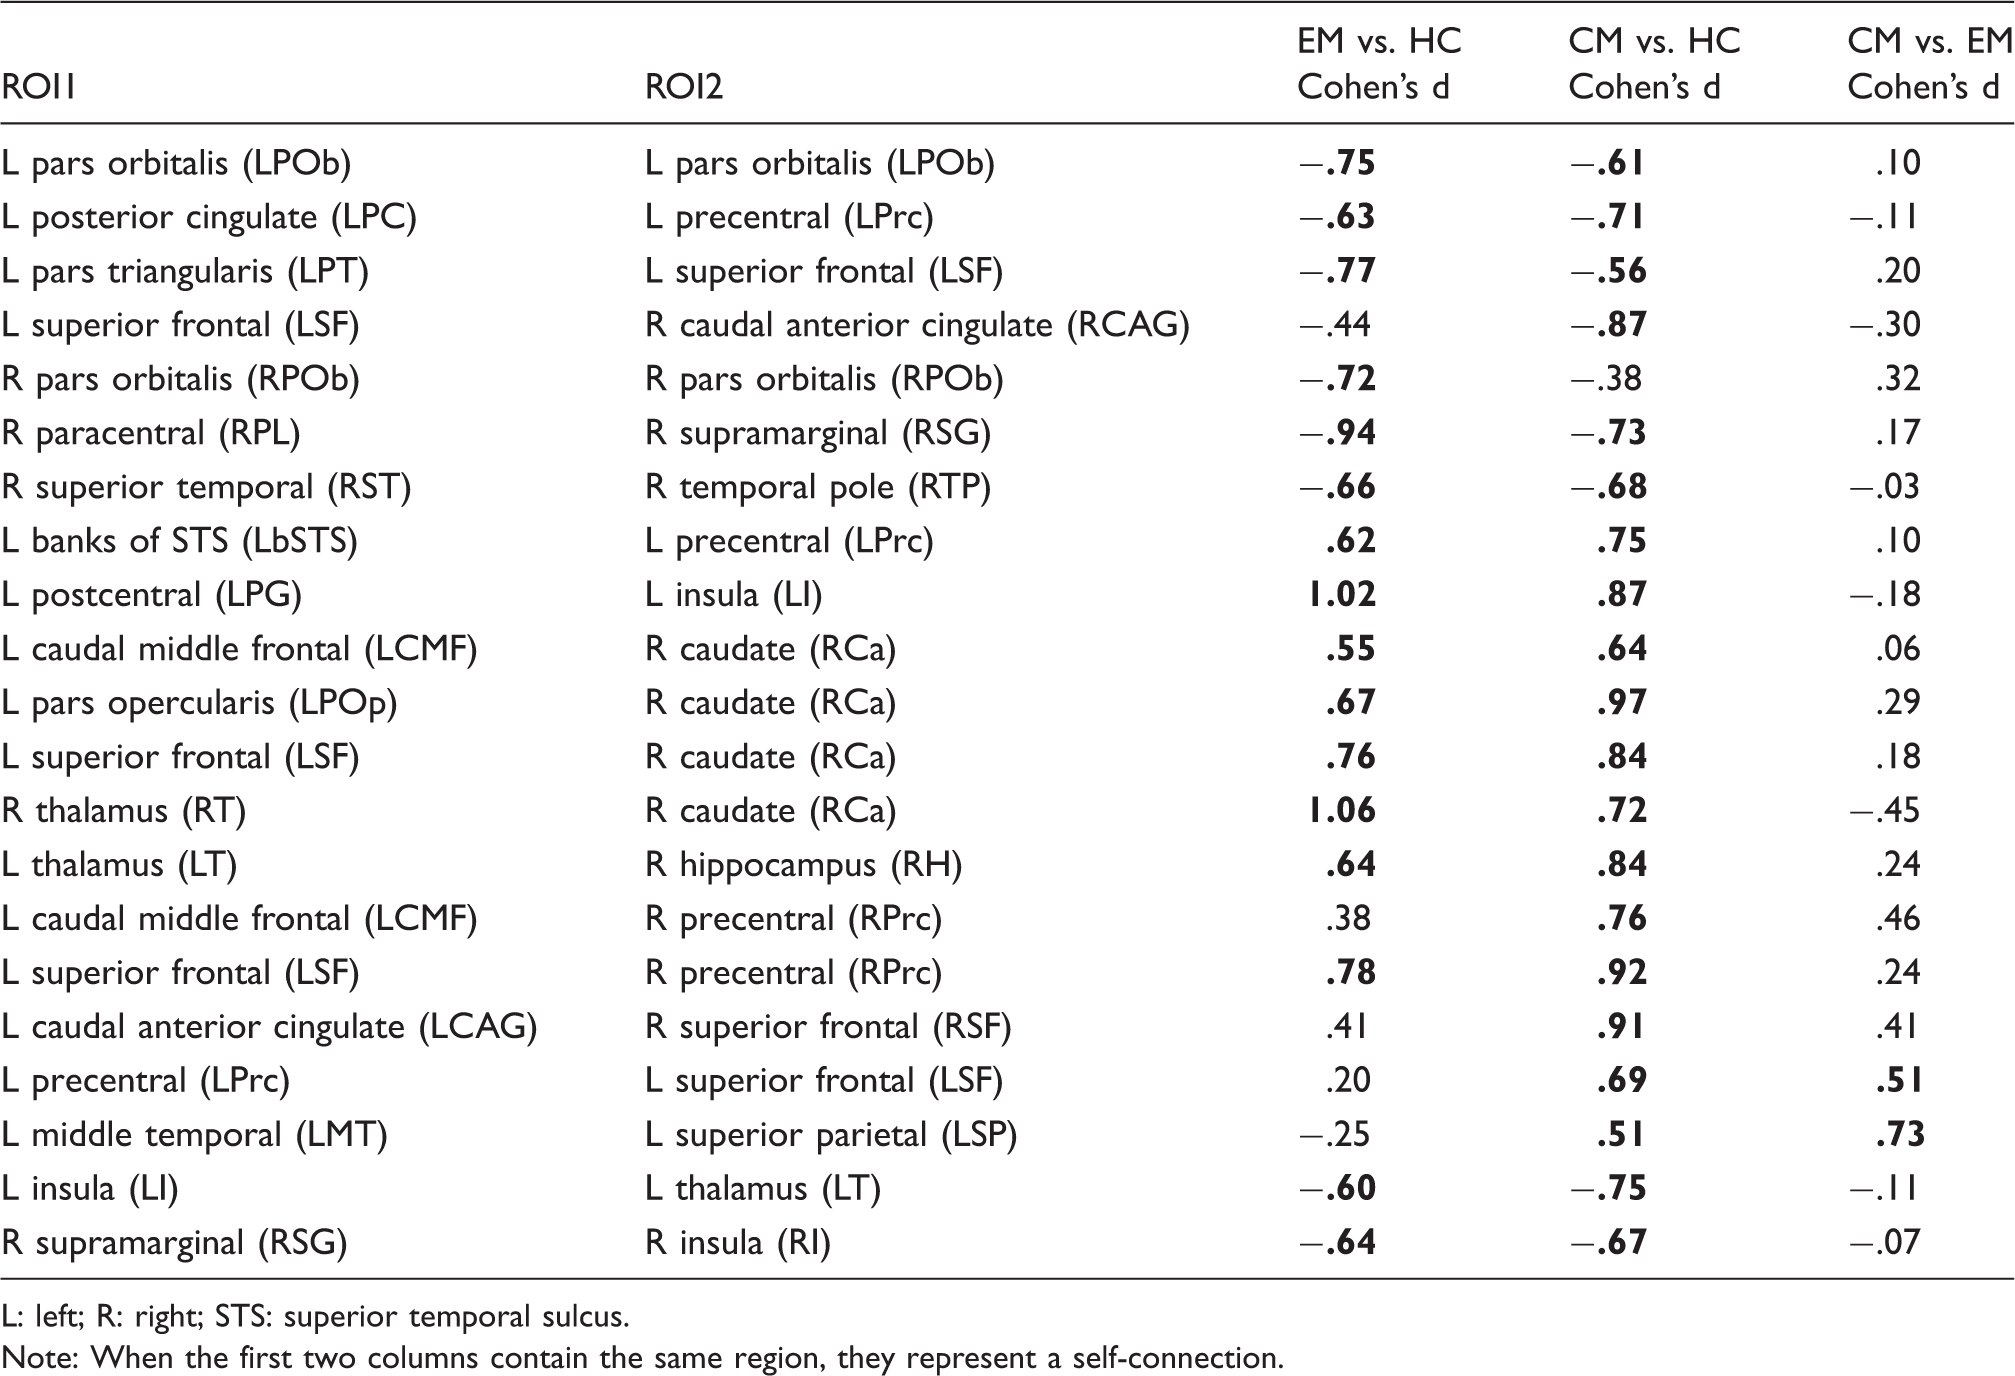
When comparing between both groups of migraineurs and HC, many values showed a medium (.5) or even a large effect size (.8 or higher). When comparing CM and EM, connections with medium effect size or close to medium effect size threshold (.5) showed positive Cohen’s d values for number of streamlines and negative values for mean AD and RD. These results can be seen in Figures 4 and 5 and in Tables 5 and 6.
Cohen’s d number of streamlines bar plots of regions where significant differences between HC, EM and CM were found. Values for all possible pairwise comparisons are shown, including significant results with duration of migraine as a covariate. The last four bars in yellow represent connections with significant results only including duration of migraine history as a covariate. Stars represent pairwise comparisons with significant differences (p < .05, including or not including duration of migraine as a covariate). Region abbreviations can be seen in Table 5. Cohen’s d mean FA, mean AD and mean RD bar plots of regions where significant differences between HC, EM and CM were found. Values for all possible pairwise comparisons are shown. Stars represent pairwise comparisons with significant differences (p < .05). Region abbreviations can be seen in Table 6. Cohen’s d of number of streamlines in connections where significant differences between healthy controls (HC), episodic migraine (EM) and chronic migraine (CM) patients were observed. L: left; R: right; STS: superior temporal sulcus. Note: When the first two columns contain the same region, they represent a self-connection. Cohen’s d of mean FA and mean AD values in connections where significant differences between healthy controls (HC), episodic migraine (EM) and chronic migraine (CM) patients were observed. AD: axial diffusivity; FA: fractional anisotropy; L: left; R: right; RD: radial diffusivity.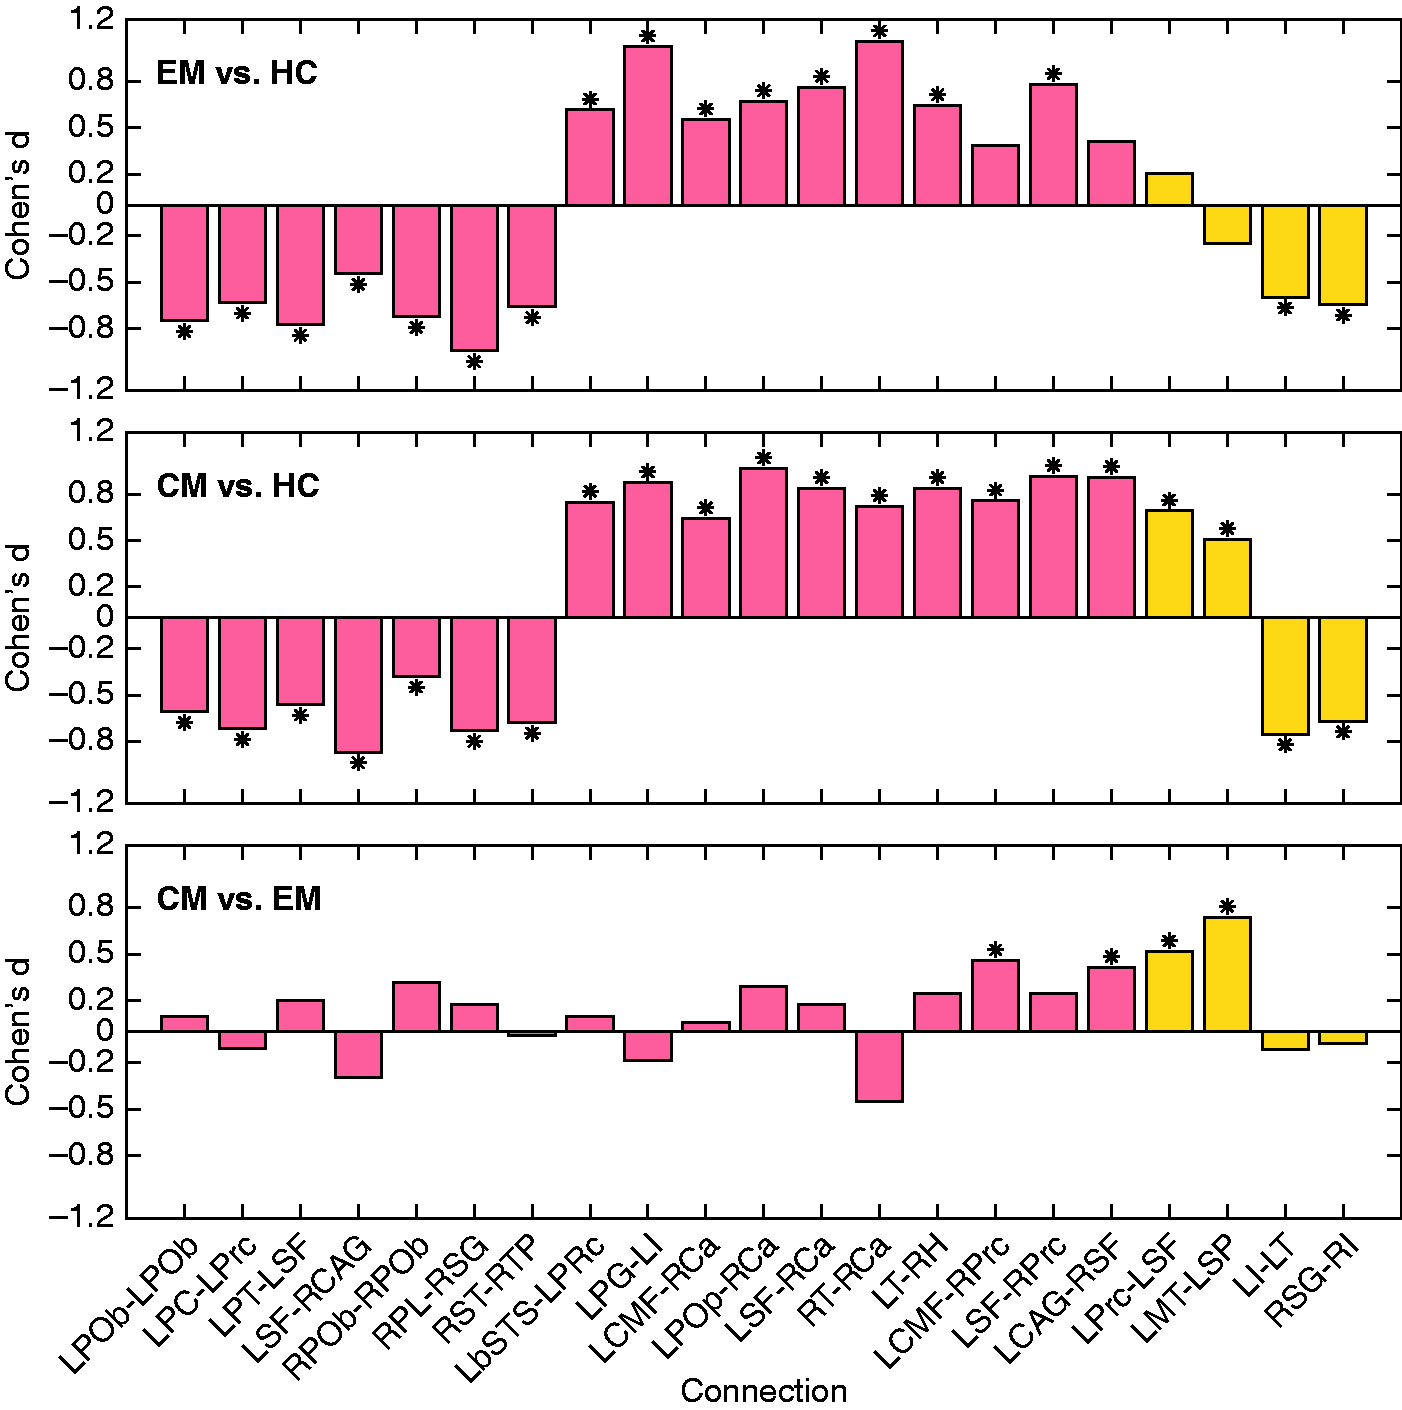


Correlation analysis
After multiple comparisons correction, connectome significant positive correlations between time from onset of chronic migraine and mean FA in the right insula self-connection (ρ = .329, p = .013), and between duration of migraine history in CM patients and mean AD in the right hippocampus – right inferior temporal gyrus connection (ρ = .357, p = .007) were found. These results can be seen in Figure 6.
Association graphs between clinical parameters and connectomics results. Significant association with the mean FA in the self-connection in the right insula is shown in (a). Significant association with the mean AD in the connection between the right hippocampus and the right inferior temporal gyrus is shown in (b).
No significant negative correlations were found in connectome correlation analysis. No significant correlations were found either for the number of streamlines and mean RD or the duration of migraine history in EM and headache and migraine frequency for both migraine groups in connectome correlation analysis.
Discussion
In this study, we analyzed structural connectivity alterations in migraine patients using dMRI and DTI data and a whole-brain tractography approach. Connectivity measures; that is, the number of streamlines from the tractography and diffusion descriptors (mean FA, mean AD and mean RD), were analyzed in 620 connections between 84 cortical and subcortical gray matter regions.
When comparing migraine patients with healthy controls, we found simultaneously significant higher and lower number of streamlines in migraine patients, suggesting respectively coexistent strengthening and weakening structural connectivity changes in migraine. The same pattern was found for mean FA and AD analysis. In the case of mean RD, increased values were found in migraine patients.
When comparing EM and CM patients, we found more streamlines and decreased mean AD and RD values in CM compared to EM, which suggests two distinct mechanisms of structural connectivity alterations in CM with respect to EM. These two mechanisms might be related to a potential adaptation to painful stimuli and to a possible axonal disturbance, respectively.
In relation with the second objective of the study, correlation analysis was performed between diverse structural connectome measures, including dMRI and DTI descriptors, and clinical features. In the case of CM, time from CM onset was positively correlated with mean FA values. Duration of migraine history in CM patients was also positively correlated with AD values. Since higher FA and/or AD values are in general related to improved connectivity, these correlation results may suggest a possible white matter plastic adaptation to very frequent painful stimuli throughout time in CM patients.
Two patterns could be identified in relation to structural connectivity alterations, based on the analysis of the number of streamlines. The first pattern is a possible weakening (lower number of streamlines) in some connections in migraine patients. An example of this pattern was found in connections within the temporal lobe. Moulton et al. suggested that the temporal lobe is highly affected by migraine and that functional connectivity between the temporal pole and pain processing regions is altered in the interictal state (36). In the other purposed pattern, in migraine patients there might be a strengthening (higher number of streamlines) in other connections involving, in most cases, subcortical regions that is, the caudate nucleus, thalamus and hippocampus, many of these being deeply implicated in migraine pathophysiology, and other regions such as the insula, the superior frontal gyrus and the precentral gyrus. Figure 2 allows a close inspection of the different patterns that are present in the detected differences.
In a review study, Borsook et al. reported that the insula is implicated in processes related to the clinical presentation of migraine and is a “hub of activity” in migraine (37). In another review, Younis et al. reported the thalamus to be involved in allodynia, central sensitization and photophobia in migraine, and also in the dysfunctional pain modulation and processing (38).
In a meta-analysis study, Jia and Yu reported decreased gray matter volume and increased activation in the precentral gyrus in migraine patients with respect to healthy controls (39). The hippocampus participates in pain processing and is involved in pain-related attention and anxiety (40). The superior frontal gyrus, caudate nucleus, thalamus and hippocampus were classified as “rich club regions” in migraine patients and healthy controls by Li et al. (2017); that is, regions involved in a great number of connections (11).
Hence, considering the role of the regions involved in connections with higher number of streamlines in migraine, a stronger structural connectivity may indicate a plastic adaptation to painful stimuli in brain regions related to pain processing.
With regard to DTI descriptors, decreased FA values can be caused by several different factors, such as demyelination, lower packing density or different membrane permeability. FA values are also modulated by characteristics such as axon diameter and packing or fiber organization (41). Reduced AD values, on the other hand, may suggest the beginning of demyelination (42), but another hypothesis linked AD more to axonal damage than to demyelination (43). Increased RD values may be associated to white matter neuropathology and myelin damage (43). Nevertheless, biological interpretation of diffusion descriptors is not completely understood, and the results must be interpreted cautiously.
In line with the analysis of the number of streamlines, considering the mean FA values, strengthening in connections with regions implicated in pain processing; for example, the hippocampus, may coexist with weakening in other connections. Taking into account the reduced AD values in connections with the hippocampus, or the increased RD values in connections with the thalamus, there may exist a possible axonal disturbance in the white matter involved in these connections.
Therefore, a higher number of streamlines may suggest not only a potential reinforcement in connections with regions related to pain processing in migraine, but also a possible mechanism to compensate for axonal impairment.
When comparing CM and EM, a similar hypothesis to the comparison between migraineurs and healthy controls can be exposed. In CM, with respect to EM, an apparent reinforcement in some connections with coexistent axonal disturbance may represent that in CM there might be a plastic adaptation to a new state and a procedure to counteract a possible axonal disturbance.
No white matter differences between EM and CM were reported by Neeb et al. using diffusion tensor imaging (14). Therefore, considering our results, we provide a new insight into the differences between episodic and chronic migraine. In the study by Neeb et al., the sample size was considerably smaller than our sample size, which could explain the lack of significant results in that study.
With respect to the analysis of the temporal evolution in migraine, connections with pain processing regions might be evolving throughout the course of migraine, especially in CM patients, due to the high headache frequency. This evolution could counterbalance the initial pathophysiological mechanisms suggested before; that is, connections with pain processing regions would evolve by decreasing number of streamlines. This hypothesis is supported by a reduced number of streamlines in connections with the insula and thalamus when including the duration of migraine as a covariate in the ANCOVA analysis.
Moreover, results indicate that the temporal evolution in CM could be a very different process from that of the temporal evolution of white matter in EM.
Based on our correlation results and the ANCOVA analysis, we hypothesize that CM might evolve in two phases. The first phase would be the progression from EM to CM, and the second phase would be a plastic maladaptation to continuous painful stimuli, especially in pain processing regions.
This plastic maladaptation hypothesis would be supported by significant positive correlations between total duration of migraine and time from onset of chronic migraine in CM patients, and diffusion measures from DTI (FA and AD). Moreover, these correlations were found in connections involving pain processing regions, the insula and the hippocampus.
The modification of the state of white matter in Chronic Migraine would be characterized by a set of maladaptive plastic changes, perhaps caused by repeated painful stimuli or increased cortical excitability, as hypothesized by Szabó et al. (2017) in patients with migraine with aura (44). This CM modification hypothesis may be related to sensitization of CM patients (45). In EM, this modification may be led by loss of white matter integrity.
In other studies, significant negative correlations between duration of migraine in years, in EM patients, and FA was reported in specific white matter pathways (46,47). Significant negative correlations between duration of migraine in years, in EM patients, and AD were also obtained (44,46). These correlation results in EM patients are opposite to the results we obtained in CM patients, showing possible contrary patterns in temporal evolution between EM and CM, as we have hypothesized.
In any case, the influence of duration of migraine in structural connectivity shows the important effect of time in migraine. Therefore, longitudinal studies are very much needed in order to elucidate the nature of these changes and support or discard any hypothesis regarding the evolution of brain connectivity along the disease process.
High frequency EM patients (10–14 headache days per month) were not included in the present study. No significant correlations were found between headache frequency and structural connectivity measures, which could mean that headache frequency does not have a very relevant effect on structural connectivity within the EM or CM groups. We believe that this exclusion criterion was a key factor for the identification of connectivity changes between EM and CM. However, it could also be related to some of the diversity of results found in the literature related to this topic, including the present study.
There are several strengths and limitations in this study. About the strengths, this study is the only one, to the best of our knowledge, which uses brain connectomics based on dMRI tractography to assess connections throughout gray matter regions of the whole brain comparing chronic and episodic migraine patients. Also, this is, to the best of our knowledge, the dMRI tractography study with the highest number of participants simultaneously including healthy controls, EM and CM patients.
About the limitations of this study, we acquired no T2 or T2-FLAIR MRI sequences to evaluate white matter hyperintensities because of the time restrictions of the MRI protocol in a clinical context. Lesions of the white matter related to white matter hyperintensities may have an influence on our results. Patients with anxiety and depression were discarded from the study, as stated in the Participants subsection of the Material and methods section. Most of our patients with CM were overusing medication (42 out of 56). There could be structural differences between CM patients with and without medication overuse, so the medication overuse may be a confounding factor in the identified differences between the analyzed groups. A methodological limitation of our study was that it was not possible to specify the specific white matter tracts where significant differences in the connections between gray matter regions were found. An important limitation in this study was that we could not adjust our results for age, because of the high correlation between age and duration of migraine (collinearity). When MRI were acquired in the patients, they had had no attacks in the previous 24 hours, but they could be in a prodromal stage, as we controlled time from the past attack but not to the next migraine attack. Altered brain physiology and abnormal functional connectivity have been found in prodromal stages (48,49), so this is a possible source of bias in the results. Finally, in the case of the analysis of aura, the number of patients with migraine with aura was too small to perform an analysis comparing migraine with and without aura.
Conclusions
In a dMRI-based connectomics analysis, brain structural connectivity alterations in migraine patients compared to healthy controls, and in chronic migraine compared to episodic migraine, were observed. A higher number of streamlines in connections with subcortical pain processing regions such as the hippocampus or thalamus may reflect a structural strengthening of cerebral pain circuits in migraine patients. Weakening in other connections involving cortical regions associated with hyperexcitability in migraine, like the temporal lobe and particularly the temporal pole, may coexist with that strengthening. To confirm possible plastic maladaptation in the modification of the state of white matter in chronic migraine, especially in connections involving pain processing regions, longitudinal studies are needed.
Key findings
Strengthening and weakening coexist in structural connectivity in migraine patients with respect to healthy controls. Pain processing regions are implicated in most of the connections that are strengthened in migraine compared to healthy controls. Two different mechanisms related to adaptation to painful stimuli and axonal disturbance seem to happen in the transition from episodic to chronic migraine. Positive correlations were found between time from onset of chronic migraine and duration of migraine in chronic migraine with diffusion descriptors. White matter evolution in chronic migraine could follow a set of maladaptive plastic changes.
Footnotes
Note
Part of the results from this article are presented in the International Headache Congress 2019, in the abstract entitled White matter alterations in chronic migraine: A diffusion tensor imaging and structural connectivity study.
Acknowledgements
APG was supported by Junta de Castilla y León (Spain) and the European Social Fund (ID: 376062, Base de Datos Nacional de Subvenciones). We would also like to acknowledge the Ethics Committee of Hospital Clínico Universitario de Valladolid.
Declaration of conflicting interests
The authors declared no potential conflicts of interest with respect to the research, authorship, and/or publication of this article.
Funding
The authors disclosed receipt of the following financial support for the research, authorship, and/or publication of this article: This study has been partially supported by grants from Gerencia Regional de Salud CyL (GRS 943/A/14, GRS 1727/A/18). This work was also supported by Ministerio de Ciencia e Innovación of Spain with research grants RTI2018-094569-B-I00 and PRX18/00253 (Estancias de profesores e investigadores senior en centros extranjeros).