
Abstract
Visual analogue scales (VAS) are well-validated instruments for assessing pain intensity, but have an impractical format. The aim of the study was to validate a vertical against a horizontal VAS for pain intensity registration. Out-patients with headache or non-headache pain were included. Participants completed a horizontal and a vertical VAS. Both were completed twice for test-retest. Headache was diagnosed according to the International Classification of Headache Disorders, 2nd edition. The results on vertical and horizontal VAS did not differ significantly in the different headache or chronic pain groups. For test-retest evaluation, effect sizes and Cohen's δ values were < 0.029 with < 1.5% change from test to retest (P < 0.01). Correlation coefficients were > 0.95. Bland-Altman analysis showed good agreement between vertical and horizontal scores with correlation coefficients > 0.84. A vertical VAS is equally valid as a horizontal VAS for registration of pain intensity in headache and non-headache patients.
Introduction
Headache diagnoses rely exclusively on headache history, as there are no objective markers for everyday clinical use (1–3). The International Classification of Headache Disorders, 2nd edition (ICHD-II) provides explicit diagnostic criteria that make valid and reliable diagnoses possible for all types of headache (4). The intensity of headache and other pains changes over time. Retrospective description of pain intensity is subject to recall bias, whereas prospective recordings are more precise but subject to compliance problems (5–8). Pain intensity is a key variable, as assessment of frequency and duration yields insufficient information (9). The ICHD-II classifies headaches intensity on a verbal rating scale (VRS) as mild [1–3 on a visual analogue scale (VAS)], moderate (4–6 on a VAS), severe (7–9 on a VAS) and very severe (10 on a VAS) (4). A VRS is easy to use and preferred by patients (10). This type of categorical scale has been used in several migraine drug trials (10–14). The treatment effect has usually been defined as improvement from moderate/severe to none/mild intensity of the migraine or another dichotomization of the VRS data. However, such measurements are problematic. First, a VRS is a categorical scale without ratio scale properties. Thus, the steps between the categories are not equal. An example is that improvement from severe to mild headache may vary between 4 and 8 points (7–3 and 9–1), whereas improvement from moderate to mild may vary between 1 and 5 points (4–3 and 6–1). Thus, a one-step improvement sometimes represents more pain improvement than two steps. Second, decrease of headache intensity from moderate to mild may be less clinically relevant than decrease from severe to moderate. Third, the few categories make the scale less sensitive to change, and dichotomization of the values will further reduce sensitivity. Fourth, the ordinal characteristics of the VRS permit application only of non-parametric statistical methods.
VAS have some advantages over the VRS. VAS have been validated and used in many different settings (15–21). Assessment involves visualization of the pain intensity in relation to a 100-mm horizontal line anchored by the descriptors ‘no pain’ and ‘worst imaginable pain’ on the two extremes (21, 22). The scale usually gives rise to normally distributed continuous numerical data and has been shown to have ratio scale properties (20). If data are normally distributed, more powerful parametric statistical analyses can be used. An ideal pain measurement method should have the following characteristics: have ratio scale properties, be free of bias, provide accurate and reliable information, be useful for monitoring both experimental and clinical pain, be sensitive to pain intensity changes, be simple to use, have ability to assess different dimensions of pain, have ability to assess pain-related affect, and be generalizable (23). VAS have most of these characteristics, but are not practical for monitoring pain in a prospective diary (20, 23). An alternative is the use of Likert scales, which are categorical scales often with 7–10 numerical categories. However, these scales are less commonly used and validated, and do not possess all the above characteristics. For this reason we tested the validity and reliability of a 33.3-mm vertical VAS in a diary vs. the gold standard of a 100-mm horizontal VAS.
Materials and methods
Patients
Patients were recruited consecutively from Akershus University Hospital and the general population in Akershus County, Oslo, Norway. Based on previous validation studies of VAS, a total number of subjects of close to 100 with a minimum of 10–20 patients per diagnostic group was assumed to be sufficient for validation.
Out-patient orthopaedic and pain clinics
Thirty patients with non-headache pain were included in the pilot study. Patients were mainly chronic pain patients or patients with on-going orthopaedic pain such as back pain or fracture pain (recruited between 27–30 November 2006).
Out-patient headache clinic
Forty-five patients with defined headache diagnoses were included (1 December 2006 to 31 March 2007).
General population
Nineteen patients with chronic tension-type headache were included (1 December 2006 to 31 March 2007).
Headache diagnoses
Physicians experienced in headache diagnostics diagnosed the headaches according to ICHD-II criteria and the relevant revision (4). The following groups were used for analysis: chronic tension-type headache without medication overuse (CTTH, ICHD-II code 2.3), probable chronic tension-type headache with medication overuse (pCTTH, ICHD code 2.4), migraine with or without aura (1.1 and 1.2), neuralgiform headaches (3.1, 3.2 and 3.4) and non-headache chronic pain.
Visual analogue scales
The usual 100-mm horizontal VAS was evaluated against a 33.3-mm vertical VAS. Anchoring points were ‘no pain’ at the left side/at the bottom and ‘worst imaginable pain’ at the right side/at the top of the VAS. The VAS was filled in four times by the patients in the order horizontal, vertical, horizontal and vertical version. Patients were not allowed to see previously filled in VAS registrations. The vertical VAS was incorporated into a diagnostic headache diary (Fig. 1). A time interval of approximately 2 min was used between test and retest of the same scale.

The diagnostic headache diary.
Validity and reliability
The validity of the horizontal and vertical VAS was assessed both by multiplying the vertical VAS factor with three (3 × 33.3 mm = 100 mm) to achieve comparable results and without use of a scaling factor. Reliability, i.e. test vs. retest, was assessed for both the horizontal and vertical VAS.
Statistics
Data are presented as means and standard deviations (
To assess the agreement between the horizontal and the vertical VAS, Bland–Altman analysis was applied (24, 25). The Pearson correlation coefficient was calculated to examine the differences between the averaged repeated measurements (bias) vs. the mean of two averaged measurements and the normality of the differences was assessed. The limits of agreement using repeated measurements were constructed (24).
To quantify the reliability of each of the methods we also used the Bland–Altman approach (24). The mean of differences (bias) and the
Even though sample sizes for most groups are too small for the test of normality of differences, this assumption is likely to be met because much of the variation between subjects is removed and mainly the measurement error remains when taking the differences. The same holds when applying one-sample t-test to check the hypothesis about the mean being equal to zero.
The limits of agreement are defined as an interval within which 95% of the differences will lie, and is given as the bias ± 1.96 s. An earlier study has shown that the minimum clinical significant change of pain severity measured with the VAS was 13 mm (27). We therefore defined a priori limits of agreement to be within 13 mm in the Bland–Altman analysis.
The horizontal and vertical VAS were also compared using Pearson correlation coefficients. All tests were performed separately for non-headache and headache pain.
Results
VAS results
Table 1 shows baseline data for the different headache diagnoses. The VAS scores for testable groups were normally distributed. Figure 2 shows the scatter plot of the horizontal and vertical VAS for general non-headache pain and headache. The mean VAS scores were: for general non-headache pain [horizontal VAS 47.7 ± 27.2 (mean ± 95% confidence interval) vs. vertical VAS 47.6 ± 27.5), for headache in the out-patient headache clinic (horizontal VAS 66.4 ± 33.5 vs. vertical VAS 65.1 ± 31.4), and for headache in the epidemiological survey on chronic headache (horizontal VAS 36.3 ± 24.4 vs. vertical VAS 38.9 ± 22.3). The mean VAS scores for the specific headache diagnoses are shown in Fig. 3.
Baseline data for the different headache diagnoses

ICHD-II, International Classification of Headache Disorders, 2nd edition; CI, confidence interval; CTTH, chronic tension-type headache without medication overuse; pCTTH, probable chronic tension-type headache with medication overuse.

Scatter plot of 100-mm horizontal visual analogue scale (VAS) vs. a vertical VAS scaled up by a factor of 3.
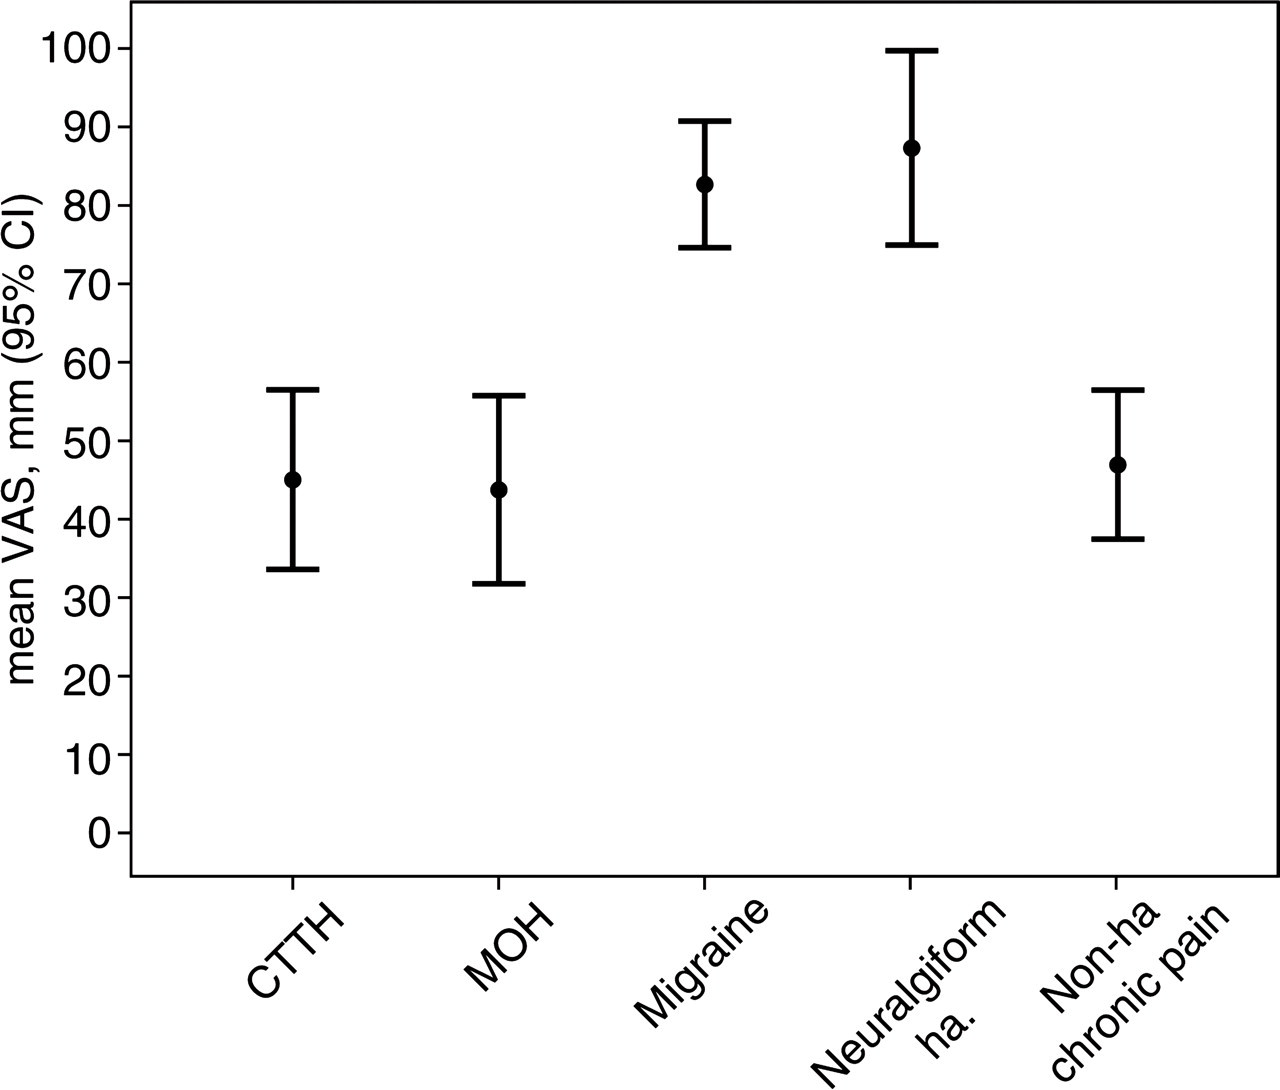
Mean visual analogue scale (VAS) scores of different types of pain; the symbols represent mean of VAS registrations, bars denote 95% confidence intervals (CI).
Validity
In Table 2, mean of differences or bias calculated using the differences between averaged replicates of two methods is presented. In all but two tested groups, there was no significant bias. Bias was noted between horizontal and vertical VAS for migraine and neuralgiform headache. The 95% confidence limits of agreement were slightly above the clinically acceptable difference of 13 mm for three groups (migraine, neuralgiform headache and non-headache pain). However, for the remaining headache diagnoses as well as for all headache diagnoses analysed together, the limits of agreement were below the minimal clinically significant difference. The Pearson correlation coefficients between the average test and retest data regarding the vertical and horizontal VAS scores were ≥ 0.843 and significant at the level of 1%. Since sample size in most groups was rather small, we calculated the Spearman correlation coefficient also. The conclusions remained the same.
Bias, standard deviations and limits of agreement

∗ P < 0.05.
CI, confidence interval; CTTH, chronic tension-type headache without medication overuse; pCTTH, probable chronic tension-type headache with medication overuse.
The correlation coefficient did not show any relationship between the differences of averaged test–retest values and the mean of the two (data not presented).
Reliability
Table 3 shows the mean differences (or biases) and within-subject
Mean difference (bias) and within-subject standard deviations (

VAS, visual analogue scale; CTTH, chronic tension-type headache without medication overuse; pCTTH, probable chronic tension-type headache with medication overuse.
The vertical and horizontal VAS recordings were not significantly different regarding the different types of pain. Standard deviations within subjects were generally small and test–retest bias was insignificant. In Table 4 the values of the effect size, Cohen's δ, and percentage change from the first to the second test are given. The effect size was close to zero for all groups, indicating that test–retest measurements are reliable. Cohen's δ was in all cases almost identical to the effect size (< 0.029 with < 1.5% change from test to retest; P < 0.01). The values of the correlation coefficients were all ≥ 0.95 and all significant at the level of 1%, showing that test and retest values fall in the same position relative to their respective means.
Effect size, Cohen's δ and percent change from the first to second test in different types of pain

VAS, visual analogue scale; CTTH, chronic tension-type headache without medication overuse; pCTTH, probable chronic tension-type headache with medication overuse.
Discussion
The present results demonstrate that pain intensity monitored by a short 33.3-mm vertical VAS is valid and reliable compared with a standard 100-mm horizontal VAS. Our results also show that both the horizontal and the vertical VAS give reproducible and normally distributed data. In addition, our clinical examination with inclusion of headaches with different intensities also provides direct validation that the vertical VAS indeed gives the expected pain intensity levels.
Our results are based on individual pain registration by patients with self-experienced pain. The patients with non-headache pain represent a heterogeneous group of patients, which was recruited through out-patient pain and orthopaedic clinics. The aim with this group was not to characterize pain related to various causes, but rather to test validity and reliability of the vertical against the horizontal VAS, and thereby evaluate the vertical VAS also in this setting. The headache categories were defined based on ICHD-II criteria (4). The horizontal and vertical VAS were presented shortly after each other and it may be argued that immediate recall of the previous registration may be a problem. However, against this stands the knowledge that headache intensity may vary over short time periods, indicating that immediacy is also important. Nevertheless, we cannot exclude the possibility of an immediate recall affecting the results. Our patients are naturally expected to remember the pain that they have just registered when the same pain is addressed again. We did, however, take some measures to avoid too direct an influence. The patients did not have access to the previous VAS scores, and the two vertical and two horizontal VAS were not presented in direct sequence in order to avoid direct influence of visual memory of the appearance of the last scale when completing the next VAS. The discussion of whether access to previous scores should be allowed is complex and is addressed further below. We had no patients who did not wish to complete the VAS registrations. Compliance may be a problem when a larger quantity of data is collected or when the test is associated with negative components. In our study the VAS registration probably represented a positive focus on the patient's pain problem. We think that the completion of a VAS registration per se is unlikely to increase non-compliance, which is more likely to be caused by time-demanding, complicated and sensitive questions.
A continuous, numerical and normally distributed outcome variable would seem to be ideal for addressing pain intensity prospectively. Serial measurements using headache diaries with such variables would enable time-series analysis and analysis of area under the curve of different treatment groups or populations. For acute treatment studies, this has so far mainly been attempted using VRS differences over time as translated into sum of pain intensity differences (SPID) (28, 29). However, the SPID has been criticised for not adding anything to other, more easily understood measures (30). The fact that pain intensity-based measures are no longer recommended as outcome measures for clinical studies by some authors seems to be due to shortcomings of the various scales generally used and problems involved in the interpretation of the outcome (12–14). Other authors have recently used VAS for monitoring headache intensity over time in studies using alternative treatments such as acupuncture and physiotherapy (31–33).
We applied the most commonly used 100-mm horizontal VAS, which is anchored by the phrases ‘no pain’ and ‘worst imaginable pain’ for comparison, since this VAS version is the most extensively documented and used (15–21). The use of a shortened 33.3-mm version of a vertical VAS incorporated into a previously validated headache diary is both valid and reproducible in relation to the horizontal VAS (7). Bland–Altman analysis showed no significant bias for most groups tested (24, 25, 34). Migraine and neuralgiform headaches, the most intensive headaches we studied, scored slightly lower on the vertical than on the horizontal VAS. However, when the same type of headache is evaluated longitudinally, this does not cause a problem. Analysis of correlation (Pearson and Spearman correlation coefficients) showed no significant differences between the two VAS for any group.
The analyses showed that repeatability of the vertical VAS is comparable to the 100-mm horizontal VAS. We found no indication of a significant relationship between the mean VAS level and the test–retest difference for either of the VAS. No significant test–retest bias was found.
Several prospective headache diaries have been validated for adults (5, 7, 35). Vertical and horizontal VASs have previously been compared for rheumatic pain with extremely high correlation factors (36). It has been shown that the orientation of the VAS is important, and that vertical scales are easier to use by older people (10, 18). This has also been discussed by others, and the results suggest that changing the orientation of the scale may affect the results, which makes validation of the scales necessary before general use (11). Data that are normally distributed on a horizontal scale are not necessarily so on a vertical scale (11). The greatest kurtosis and skewness and the least normally distributed data were achieved using vertical VAS (22). However, these results were not based on experienced pain, but achieved using volunteers who were asked where they would place pain equivalent to the words ‘little pain’, ‘mild pain’, ‘moderate pain’, etc. on a VAS (22). Our data, reporting self-experienced pain, was normally distributed using both vertical and horizontal VAS. However, normal distribution should not automatically be assumed, and before application of parametric statistics the normality of the data should be tested.
Retrospective collection of headache data through questionnaires or clinical interviews is valid compared with prospective diaries when frequency and duration of attacks is addressed (5). However, recall-based data are less valid when the intensity of previously experienced headaches is addressed (5, 21). These findings indicate that prospectively registered pain intensity data should be preferred over retrospectively collected data.
However, there may be some problems associated with the layout of the diary with regard to the possibility of referring to previous VAS scores when giving a new score. The opinions on what is the optimal method differ. It has been argued that VAS registration is more valid when used without knowledge of previous scores when a small group of patients are followed in a clinically relevant manner with repeated evaluations over time (15). Furthermore, it seems that correlation between pain measured by VAS over time is particularly insensitive to gradual reduction of pain (15). However, it has also been argued that patients need access to their previous scores in order to reduce the random variation involved in repeated VAS measurements and that this may be preferable when the aim is to follow change in pain intensity over time (11). We examined test–retest reliability without the patient having access to previous scores. The use of these scales in long-term monitoring of pain, to see whether the progression of pain over time is affected by having access to previous scores, should also be validated separately.
We conclude that the 33.3-mm vertical VAS incorporated into a pain diary is valid for prospective registration of pain in headache and non-headache pain. Compared with a categorical VRS, we suggest that the ability to use a VAS gives a more complete picture of pain intensity in patients with headache and other chronic pain. Thus, the pain diary containing a vertical VAS may help to improve pain management. Furthermore, this type of diary would be easy to adapt to an electronic format, which would further simplify data collection and analysis.