
Abstract
A small magnetic resonance imaging (MRI) study showed increased iron depositions in the periaqueductal grey matter in migraineurs, suggestive of a disturbed central antinociceptive neuronal network. With 1.5–T MRI, we assessed iron concentrations in seven deep brain nuclei in a large population-based cohort. We compared T2 values between migraineurs (n = 138) and controls (n = 75), with multivariate regression analysis. Analyses were conducted in age strata (< 50, n = 112; ≥ 50) because iron measures are increasingly influenced by non-iron-related factors in the older group. Overall, migraineurs and controls did not differ, nor did migraineurs with vs. without aura. In the younger migraineurs compared with controls, T2 values were lower in the putamen (P = 0.02), globus pallidus (P = 0.03) and red nucleus (P = 0.03). Similarly, in these younger migraineurs, controlling for age, those with longer migraine history had lower T2 values in the putamen (P = 0.01), caudate (P = 0.04) and red nucleus (P = 0.001). Repeated migraine attacks are associated with increased iron concentration/accumulation in multiple deep nuclei that are involved in central pain processing and migraine pathophysiology. It remains unclear whether iron accumulation in the antinociceptive network has a causative role in the development of (chronic) migraine headache.
Introduction
Migraine is a common, multifactorial neurovascular brain disorder, typically characterized by recurrent attacks of disabling headache and associated symptoms of autonomic nervous system dysfunction [migraine without aura (MoA)]; in up to one-third of patients, attacks are also associated with transient focal neurological aura symptoms [migraine with aura (MA)] (1). The median attack frequency is 1.5 per month (2); 10–20% of patients show progression of the attack frequency up to daily or nearly daily attacks (chronification to chronic daily headache) (3, 4). Episodic dysfunction of brainstem pathways, involved in the control of pain and other sensory modalities, has been implicated in the pathogenesis of the migraine headache and associated autonomic symptoms (5, 6).
Using magnetic resonance imaging (MRI) in two small studies, Welch and colleagues found increased iron levels in the periaqueductal grey matter (PAG) and red nucleus of patients who were attending a headache clinic for migraine or chronic daily headache (7). As the PAG is activated during migraine attacks (8–12), it was hypothesized that free-radical cell damage associated with hyperaemia during repeated migraine attacks may lead to iron deposition. This would reflect progressive dysfunction of the PAG (7) and other brainstem structures, leading to interruption of normal antinociceptive function, and thus contributing to migraine headaches (6). As the study was performed in a small and selected group of clinic-based, and thus presumably severe migraine patients, it is unclear to what extent these findings reflect general processes in migraine or only changes occurring at the severe end of the clinical spectrum.
On MR images the age-related accumulation of non-haeme iron in the brain gives rise to decreased signal intensity (SI) in T2-weighted images in the globus pallidus, substantia nigra, red nucleus and putamen. The relationship between iron concentration and T2 relaxation times permits quantitative assessment of differences in iron concentration in the brain in vivo. In the present study we examined iron concentration in seven different deep brain nuclei with MRI in migraine cases and controls who participated in a population-based study. Iron deposition was also correlated to migraine subtype, number of attacks experienced and duration of migraine history.
Methods
Study population
The Dutch population-based Genetic Epidemiology of Migraine (GEM) study and its substudy, the Cerebral Abnormalities in Migraine, an Epidemiological Risk Analysis MRI Study have been described previously (2, 13). In brief, from a population-based survey of 6491 Dutch adults aged 20–60 years living in two representative Dutch municipalities (Maastricht and Doetinchem), 863 migraineurs and 5628 controls were identified according to the International Headache Society criteria (1). From those aged 30–60 years, we randomly selected for the MRI study 134 subjects with MoA, 161 with MA and 140 controls, frequency matched by sex, 5-year age strata and place of residence. Neither cases and controls, nor responders (69%) and non-responders, differed by age, sex or cardiovascular risk factors. All participants gave written informed consent and participated without any financial reimbursement. The study protocol was approved by the ethics committees of the cooperating institutions and included a structured telephone interview and a clinic visit for blood drawn, a standard physical and neurological examination and a brain MRI study. Since the Doetinchem participants (n = 222) did not have the images available on Magneto Optical Disks, they were excluded from the current analyses, giving 213 Maastricht participants available for analysis (138 migraineurs, 75 controls).
Assessment of confounders, covariates and migraine characteristics
Sociodemographic, medical and migraine characteristics were assessed by interview. Education was categorized as low (primary school or lower vocational education) and high. Self-reported weight and height were used to calculate body mass index (weight in kg divided by the square of height in metres). Blood pressure (BP) was the mean of three measurements obtained at 1-min intervals in the upper arm with an electronic oscillometric BP monitor (OMRON 711; Omron Healthcare Europe, Hoofddorp, the Netherlands). Hypertension was defined as a systolic BP of ≥ 160 mmHg or a diastolic BP of ≥ 95 mmHg or current use of antihypertensive drugs. A measure of total cholesterol was available from the baseline examination (14). Smoking history was defined as never, former and current, and for ever smokers, pack-years of exposure were calculated. As previously detailed, migraine cases estimated headache and aura attack frequency, and frequency and amount of specific antimigraine medication (ergotamines, triptans) they used in the years they had migraine attacks (13). There were no differences in demographic characteristics or cardiovascular risk factors between the included vs. the excluded participants.
MRI
Brain MRI images were acquired on a 1.5-T unit (ACS-NT; Philips Medical Systems, Best, the Netherlands). Whole brain images were acquired with 48 contiguous 3-mm axial slices (field-of-view 22 cm; matrix 192–205 × 256). Pulse sequences included a combined proton density (PD) and T2-weighted fast spin-echo sequence (3000/27–120 ms; relaxation time/echo time) and fluid-attenuated inversion-recovery sequence (8000/100/2000 ms; relaxation time/echo time/inversion time). Methods used for rating of deep and periventricular white matter lesions and infarct-like lesions on hard copies have been described previously (13).
Quantitative T2 measurements
For the current quantitative analyses, digital MRI data were post-processed on a commercially available workstation (EasyVison release 4.3; Philips Medical Systems). One observer (J.O.) measured SIs, blinded to all clinical data. Region of interest (ROI) measurements of SIs were performed bilaterally within the following anatomical structures (Fig. 1) by manually outlining the putamen, posterior putamen, globus pallidus and red nucleus, and by placing a standard-sized circle over the head of the caudate nucleus (30 mm2) and substantia nigra [pars reticularis and pars compacta (10 mm2)]. For the posterior part of the putamen, we used a standard area of 45 mm2. All SIs were measured in the slice(s) that best visualized the structure. The putamen, cautate nucleus and globus pallidus were measured in two adjacent slides. ROI were drawn on the PD images, copied and then pasted on the corresponding T2 images.

Proton density images [3000/27 (repetition time/echo time)], showing region of interest (ROI) locations at the level of the basal ganglia (left) and the brainstem (right). ROIs were placed by outlining the putamen (left image, red), globus pallidus (left image, green), the posterior putamen (left image, orange filling in the putamen) and the red nucleus (right image, red), as well as placing standard-sized circles in the head of the caudate nucleus (left image, blue) and the substantia nigra [pars compacta (right image, green) and pars reticularis (right image, yellow)].
Mean SI values of all ROIs were noted. For each structure we calculated an average SI by taking the means of measurements of both sides and/or adjacent slides. T2 values were then calculated using the expression T2 = (TE2 − TE1)/[ln (S1/S2)], where S1 and S2 are the SIs in the early- (= PD) and late-echo (= T2) images, with echo times TE1 (= 27 ms) and TE2 (= 120 ms), respectively. To determine intra-observer variability, 6 weeks after the initial analysis was completed, the same observer re-analyzed 21 randomly selected MRI examinations, using the same protocol. Intraclass correlation coefficients (ICCs) were calculated for each anatomical structure and are shown in Table 1.
Mean T2 values (ms ±
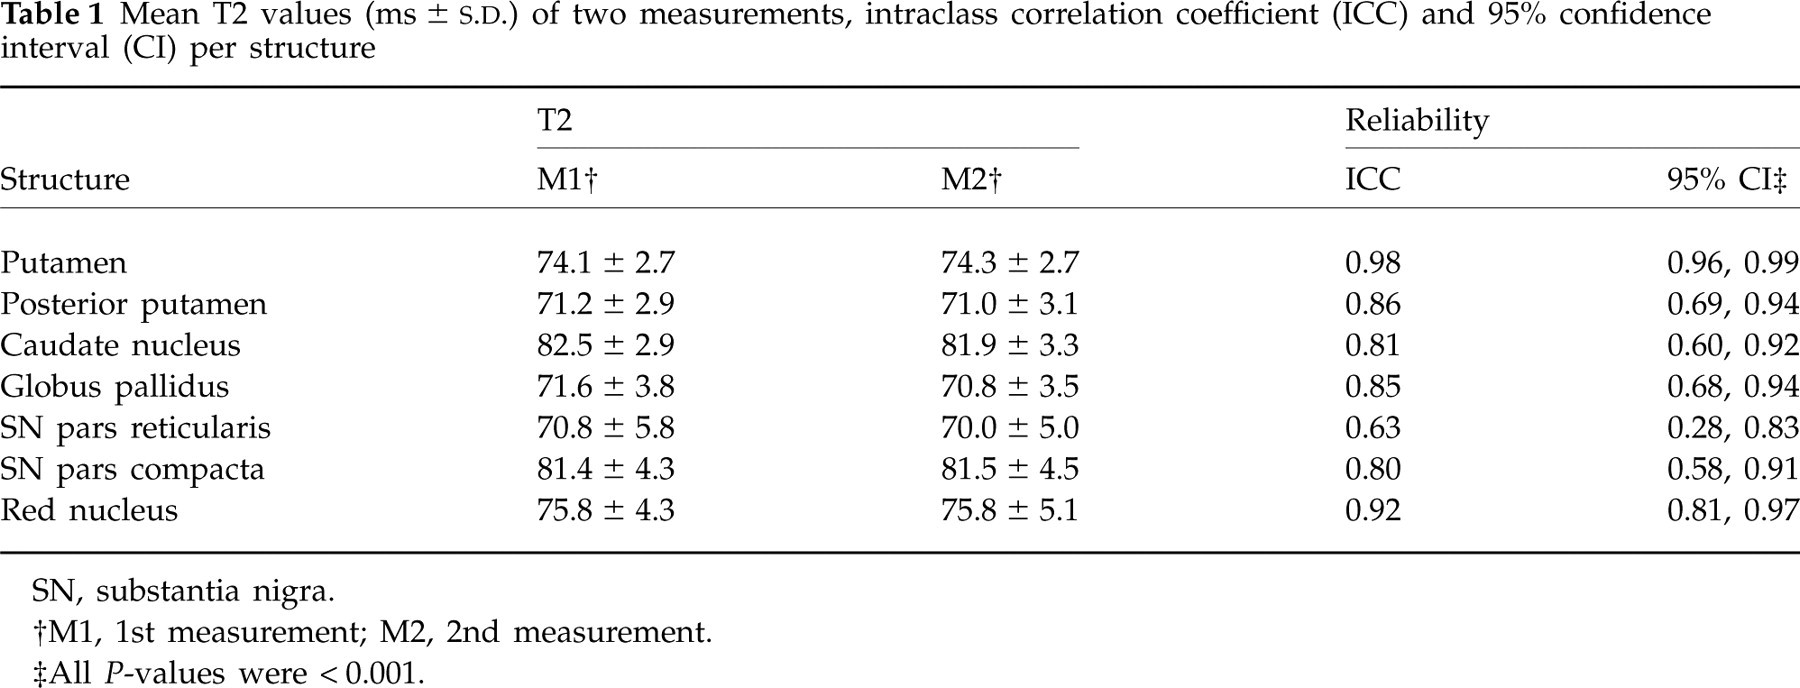
SN, substantia nigra.
†M1, 1st measurement; M2, 2nd measurement.
‡All P-values were < 0.001.
Statistics
χ2 and t-tests were used to test for differences between cases and controls in sociodemographic and migraine characteristics, cardiovascular risk factors and prevalence of lesions on MRI. Linear regression analyses controlling for age were used to test for differences across groups in the distributions and means of measured T2 values among the study groups. From the literature it is known that T2 values of deep nuclei are significantly influenced by non-iron-related tissue changes after the age of 50 years (15, 16). Therefore, both to eliminate the confounding effect of such changes and to evaluate the changes of T2 values as a function of age, we split the total sample at the median age of 50 years and performed subanalyses, grouping those < 50 years of age (n = 112) vs. those ≥ 50 years of age (n = 101). In addition, to assess the influence of migraine subtype, attack frequency and duration of migraine history on the reduction of T2 values, we analysed the migraineurs separately, and respectively split them into MoA (n = 80) vs. MA (n = 58), into those with < 1 attack/month (n = 77) vs. those with ≥ 1 attack/month (n = 61), and into those with a total migraine history of < 23 years (split at the median; n = 68) vs. ≥ 23 years (n = 70). All models controlled for age. Analyses were conducted with
Role of the funding source
The sponsor of the study had no role in study design, data collection, data analysis, data interpretation or writing of the report. The corresponding author had full access to all the data in the study and final responsibility for the decision to submit for publication.
Results
In the total sample, there were no differences in variables between migraineurs and controls, except for a higher body mass index in the migraine subgroup (Table 2). In those < 50 years of age, migraineurs had lower systolic BP (125.9 ± 1.6 vs. 133.5 ± 2.6 mmHg; age adjusted P = 0.01); in those > 50 years of age, smoking was more prevalent in controls (21.4 ± 3.7 vs. 13.0 ± 2.1 pack-years; age adjusted P = 0.03). Regardless of age group, prevalence of infarcts and prevalence of higher load of white matter lesions were similar in migraineurs and controls. Prevalence of higher vs. lower attack frequency did not differ between younger and older participants, nor between MoA and MA.
Characteristics of study participants∗

∗Data are mean (S.E.) or percentage of subjects, based on the (unpaired) t-test for the comparison of means and Pearsons's χ2 test for the comparison of proportions.
Unless stated otherwise, differences were not statistically significant. Low education, primary school or lower vocational education; High PVWML, high load of periventricular white matter lesions, i.e. PVWLM with score > 2 out of max. 6; High DWML load, high load of deep white matter lesions, i.e. the upper 20th percentile of the total DWML volume distribution.
† P < 0.05.
In the whole sample, for all examined deep brain nuclei the mean T2 values did not differ between migraineurs and controls, either in the crude and or the multivariate analyses controlling for age (Table 3). Similarly, no differences in T2 values were found between male and female participants. A trend towards lower mean T2 values in the posterior part of the putamen was found in migraineurs compared with controls.
Mean T2 values (ms ± S.E.) of subjects with and without migraine history (n = 213)∗

∗Data are estimated mean ± S.E. T2 values (ms).
Crude P-values are from two-tailed unpaired t-tests. Adjusted P-values are from linear regression analysis controlling for age.
SN, substantia nigra.
Among migraineurs, no differences were found between those with (MA; n = 58) and those without aura (MoA; n = 80). In those with higher (n = 61) vs. those with lower (n = 77) mean attack frequency (< 1 attack/month vs. ≥ 1 attack/month), mean T2 values were consistently slightly lower, but none of these differences reached statistical significance; the strongest effect was found in the red nucleus (77.7 ± 1.2 vs. 80.6 ± 1.3 ms; P = 0.1). Among MA, this trend remained for the red nucleus (77.4 ± 1.7 vs. 81.0 ± 1.7 ms; P = 0.1). Among MoA, a trend towards lower T2 values was found in the posterior putamen in those with higher attack frequency (70.8 ± 0.6 vs. 72.1 ± 0.5 ms; P = 0.11).
Among migraineurs, in the younger subjects compared with those ≥ 50 years of age, significantly lower T2 values were measured in the red nucleus (77.1 ± 8.0 vs. 81.6 ± 12.2 ms; P = 0.01); for other structures no significant differences were found. Among controls, lower T2 values were measured in those ≥ 50 years of age in the putamen (74.8 ± 1.8 vs. 73.8 ± 2.5 ms; P = 0.04), the head of the caudate nucleus (83.2 ± 2.4 vs. 81.5 ± 3.0 ms; P = 0.008) and globus pallidus (73.7 ± 4.1 vs. 72.0 ± 3.9 ms; P = 0.07, trend).
Among those < 50 years old, both in the crude and in the age-controlled analyses, significantly lower T2 values were measured in the posterior part of the putamen, the globus pallidus and the red nucleus of migraineurs compared with controls (Table 3). No differences were found between male and female participants < 50 years of age. Among this subgroup of younger migraineurs, no differences were found between MoA (n = 33) and MA (n = 36). In those with higher (n = 31) vs. lower (n = 38) mean attack rate, T2 values were consistently slightly lower for all nuclei, but not significantly different [again most pronounced in the red nucleus (75.6 ± 0.8 vs. 78.6 ± 1.6 ms; P = 0.16) and among MA with a slightly larger difference (75.3 ± 1.2 vs. 80.0 ± 2.7 ms; P = 0.16)]. Significantly lower T2 values were found in migraineurs < 50 years old with longer duration of migraine history (n = 34) vs. shorter duration, in the putamen, the head of the caudate and the red nucleus (Table 4).
Age-controlled mean T2 values (ms ± S.E.) of migraineurs with longer vs. shorter duration of migraine history (n = 138)∗
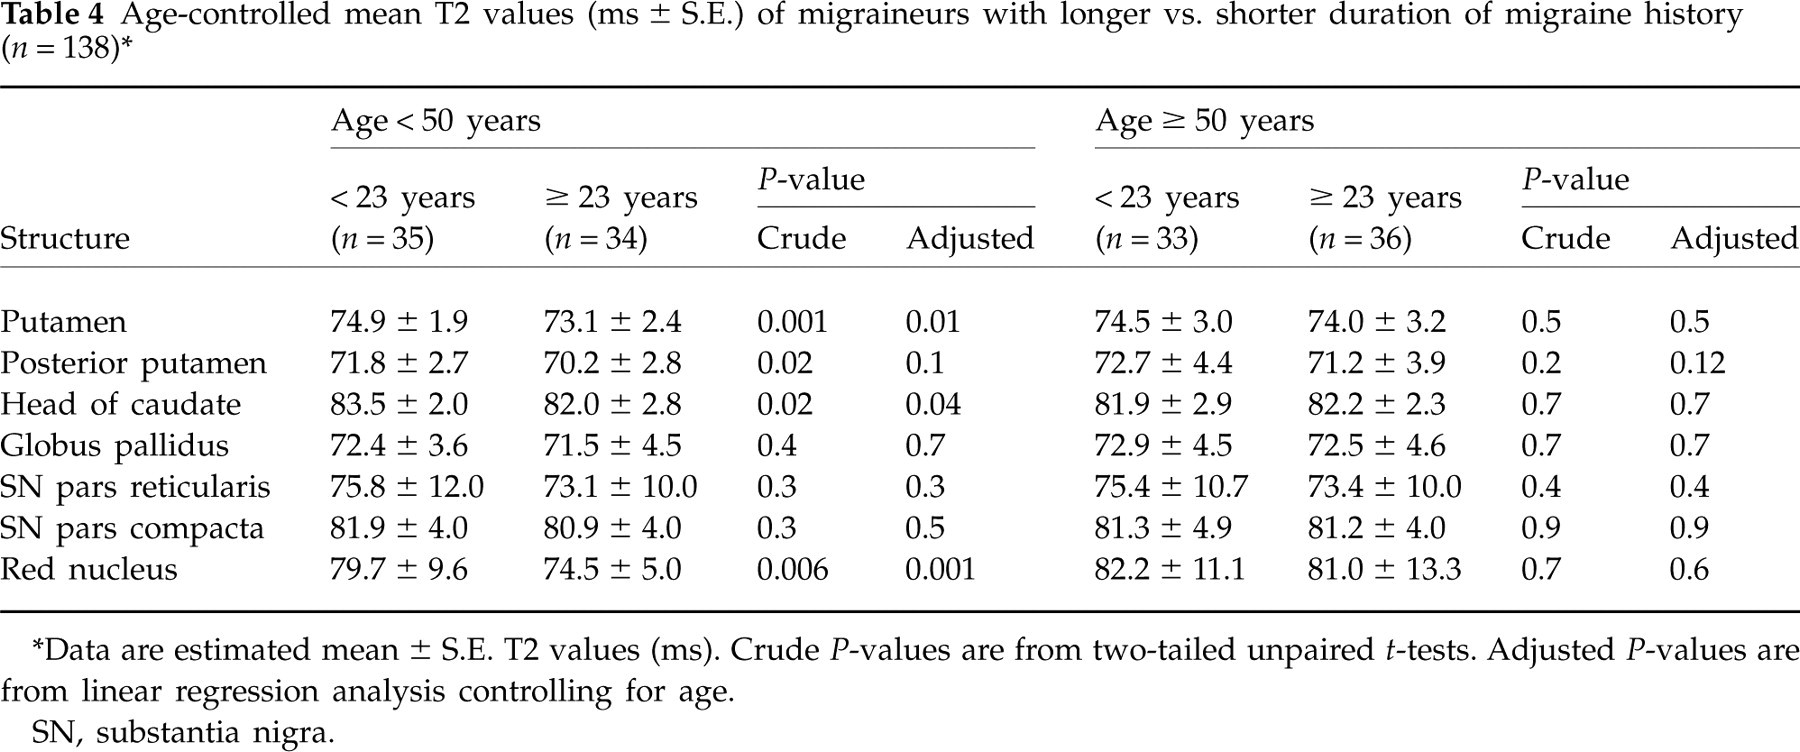
∗Data are estimated mean ± S.E. T2 values (ms).
Crude P-values are from two-tailed unpaired t-tests. Adjusted P-values are from linear regression analysis controlling for age.
SN, substantia nigra.
In the older subgroup (age ≥ 50 years), no differences were found between controls and migraineurs, nor between subgroups of migraineurs.
Discussion
In this population-based MRI study, evidence was found for increased local iron concentrations (reduced T2 values) in the putamen, globus pallidus and red nucleus of migraineurs < 50 years old. These data confirm and extend the clinic-based findings of Welch et al. (7). Controlling for age, we found significant differences between migraineurs and controls, and significant effects of (longer) duration of migraine history on T2 values. Consistent with the previous study on iron accumulation in migraineurs, we found no differences between migraineurs with and without aura. These data suggest that not the aura pathophysiology, but merely pain processes during repetitive migraine attacks are likely to be involved.
Differences in methodology between the study by Welch et al. and ours have to be noted. First, they used T2 gradient echo imaging sequences on a 3.0-T scanner, whereas we applied turbo spin echo sequences on a 1.5-T scanner. Both our type of sequence and our lower field strength result in lower sensitivity to local susceptibility effects caused by iron (17); this suggests that our findings would probably have been even more clear using a more sensitive technique. Furthermore, we used ROIs to measure SIs, whereas Welch et al. applied a semiautomated brain tissue segmentation algorithm to identify separate types of tissue. Using that technique, they segmented brain regions, including the PAG, and measured T2 characteristics. We felt we were unable to select the PAG manually without including the hyperintense signal from the cerebrospinal fluid in the cerebral aqueduct itself, and therefore we could not confirm that part of the data directly. However, our data on other deep brain nuclei add to the findings by Welch et al. and point to the possibility that impairment of iron homeostasis in migraineurs is not limited to the PAG. Although manually drawing ROI (by an observer blinded to the diagnosis) might introduce some observer variability, we found for most structures the ICC values were fairly high. Only the ICC regarding the SNpr was low (0.63), likely to be explained by the very small size of the ROI, in an area with relatively many different signal intensities. In both studies, thin (3 mm) adjacent slices resulted in a sufficient number of slices including all structures and minimized partial volume effects.
Iron depositions—relevance to migraine pathophysiology
Iron is essential in oxygen carrier proteins and in many metabolic enzymes. Up to 25% of total oxygen consumption of the body is by brain metabolic processes, which implicates a relatively high utilization of iron (18, 19). Non-haeme iron is primarily stored inside the non-toxic ferritin protein, but can also be present in an unshielded, soluble form. This iron can become toxic, since it can catalyse the formation of free radicals that can lead to DNA, protein and neuronal cell damage (19).
In normal ageing, iron accumulates throughout the brain, and particularly in the basal ganglia (20). Several neurodegenerative diseases, including Hallervorden–Spatz syndrome, Parkinson's disease and Huntington's disease, are associated with errors in iron metabolism, transport and homeostasis (21), affecting more specific regions in the brain and basal ganglia, and probably affecting the disease process (22, 23). Excessive iron accumulation can directly cause basal ganglia dysfunction, e.g. by damaging synapses or modulating protein synthesis, leading to either increases or decreases in local levels of neurotransmitters. Indirectly, a mechanism of increased iron concentrations rendering the brain more vulnerable to oxidative stress has been suggested in several central nervous system diseases (18), including Alzheimer's disease and multiple sclerosis (22).
In line with these pathophysiological possibilities, the observed increased iron concentration in the PAG in the earlier studies was interpreted to be a possible result from impaired iron homeostasis, possibly related to iron-catalysed free radical injury during repeated episodes of hyperoxia during migraine attacks, and thus as a result (‘burden’) of migraine attacks (7). The episodic activation of the PAG has indeed been visualized with positron emission tomography and functional MRI during spontaneous (8), triggered (9–11) and chronic (12) migraine, as well as in experiments of acute capsaicin-evoked pain in non-migraineurs (24). Similarly, activation (hyperaemia) of the red nucleus also occurs during migraine (25) as well as in non-migraine pain experiments (24). Also, activation in the lentiform nucleus (putamen and/or globus pallidus) has been visualized during migraine (10), but has also been described as part of normal central pain processing (24). PAG, red nucleus and lentiform nuclei are thus all involved in the normal, complex, central nociceptive network (sensory-motor integration) (24).
Our finding of increased iron accumulation in multiple nuclei involved in central pain processing makes it less likely that the PAG is ‘the only’ relevant deep grey matter and/or brainstem structure in the pathophysiology of migraine headache. The current findings, including the observation of a higher concentration of iron in those with the longest migraine history, favour the concept that repeated activation of several nuclei during migraine attacks (or ‘pain’ in general) occurs, and are associated with increased iron accumulation or concentration. However, the findings from this and earlier studies are based on cross-sectional observation and cannot study temporality. Longitudinal data are needed to justify such a conclusion, and the fact that migraine prevalence generally decreases with increasing age also argues against such a mechanism. Similarly, it is speculative to state that impaired iron homeostasis is a factor in migraine pathophysiology; the increased concentrations might be just a normal physiological response or marker of increased cellular function, and could even be reversible.
If increased iron concentrations in a chain of deep grey nuclei were to play a causative role in migraine pathophysiology, and, for example, by free-radical cell damage, secondary injury to these nuclei were to occur, this could theoretically lead to progression of the disease. This might explain the observation that in a minority of migraine patients an increase in attack frequency from episodic to chronic (chronification) occurs (3, 4, 26, 27). This could then reflect a defective central pain processing system, rather than just one defective link in the chain (as the PAG was earlier suggested to be). The ‘sensory dysmodulation concept’ of migraine pathophysiology (trigeminal somatosensory pathway), in which normal afferent stimuli are misperceived as being excessive (6), might then be explained by dysfunction of more than one deep nucleus. However, other explanations for this concept have been suggested, including a relationship with dysfunctional P/Q-type calcium channels in specific structures such as the PAG (28, 29). Although most of the above remains speculative, we know that structural changes in brainstem regions can act as a cause of migraine [e.g. a bleed in a cavernoma (30), or hyperintense (e.g. multiple sclerosis) changes (31, 32)], and pathological iron accumulation might act similarly.
MRI measurement of iron deposition
Although measurement of brain iron concentration is only possible post-mortem, decreasing T2 values in MRI have been strongly correlated with age-related regional accumulation of iron (20). Age-dependent curves of T2 relaxation time in the extrapyramidal nuclei have been found to be very consistent with published curves of non-haeme iron concentrations in post-mortem histology (15, 33). In this way, it is highly probable that changes in T2 relaxation time result to a large extent from non-haeme iron deposition. Up to 90% of non-haeme iron in the brain is in the iron-stage protein ferritin (20). Regions with high ferritin content produce a local magnetic field gradient and inhomogeneities of the magnetic field, which decreases the T2 relaxation time of tissue.
Age-dependent T2 relaxation curves differ for different nuclei. Already in childhood and early adulthood MRI has shown (exponentially) increasing degrees of hypointensity in the substantia nigra and red nucleus up to the age of 30 years, and globus pallidus up to the age of 50 years, which was confirmed in histological studies (20, 34, 35). In the putamen the curve decreases more slowly (flatter), and a plateau is reached at age 50–60 years. Above age 50 years, T2 values of different structures deviate more widely with greater individual variation (15). Local structural changes such as atrophy, enlargement of Virchow–Robin spaces or microscopic lacunar infarcts result in higher local water content resulting in increased T2 values; microcalcification may decrease T2 values (16). Knowing that after the age of 50 years the T2 values are increasingly influenced by non-iron-related factors, we separately analysed those below and above age 50 years. The effect of various age-related factors that can increase mean T2 values (‘white areas in dark nuclei’) probably explains why we did not find significant differences after age 50 between migraineurs and controls. However, we cannot exclude the possibility that after age 50 years, when prevalence of migraine attacks regularly decreases, non-haeme iron concentrations in deep grey nuclei decrease. If this is the case, it would plead against deposition of extracellular iron into tissue during active migraine, but rather imply that there could be a functional increase of cellular iron concentration, as long as there is regular (migraine induced) activation of involved nuclei.
The current population-based evidence of increased iron concentration in multiple deep brain nuclei involved in central pain processing in migraine patients with and without aura illustrates the complex nature of migraine as a disorder of sensory dysmodulation, in which not only the PAG is a factor. The higher concentration of iron in multiple nuclei in migraineurs compared with controls of similar age is probably disease related. It remains unclear whether the increased iron concentration is just a physiological response induced by repeated activation of nuclei involved in central pain processing, or whether the increased iron concentration could also damage these structures secondarily due to oxidative stress, and could be related to chronification of the disease in some migraine patients. From earlier studies, there is increasing evidence that migraine is associated with structural brain changes on MRI, including hyperintense cerebral white matter lesions (13, 36), cerebellar and brainstem hyperintensities (37), and clinical (38) and subclinical infarcts (13, 39). The risk of such brain lesions increases with increasing attack frequency. A similar effect seems to play a role with respect to iron concentration in deep grey nuclei.
Footnotes
Acknowledgements
This study was supported by a grant from the Netherlands Heart Foundation (Grant 97.108). The GEM study was conducted by the National Institute of Public Health and the Environment, Department of Chronic Disease and Environmental Epidemiology, Bilthoven, the Netherlands.