
Abstract
Usually limited information about the frequency of migraine episodes is derived from acute migraine trials. However, the design of some studies is such that they also provide relevant information about the attack frequency without the bias associated with patient expectations of treatment effect between attacks during prophylaxis trials. Using clinical data from repeated migraine attacks treated with placebo, naratriptan 2.5 mg or sumatriptan 100 mg, we show that attack and interictal periods can be described by a random probability distribution. Based on a gamma distribution, the mean interval between attacks was estimated to be 24 (17-34) days for placebo, 23 (18-29) days for naratriptan 2.5 mg and 22 (17-28) for sumatriptan 100 mg. These findings suggest that the interictal interval is not affected by abortive treatment with triptans. Interpretation of these results may be limited by the study type, yet the method represents a new tool for the evaluation of disease dynamics and treatment effect in the prophylaxis of migraine.
Keywords
Introduction
Although migraine manifests itself clinically in the form of episodic attacks, pathophysiological events are continuously unfolding in the period between attacks (1–3). In fact, premonitory symptoms precede the actual attack by several hours (2, 3). Also, evidence from electrophysiology studies reveals abnormal brain activity and raised sensitivity to pain stimuli in migraine patients during this period (4). A few hypotheses have been advanced to explain this alternating pattern of attacks and periods of neuronal instability. Among them is the energy imbalance model, suggesting hypoxia as the main cause of migraine attacks (5, 6). Another hypothesis compares the condition with epilepsy, where a disturbed equilibrium between excitatory and inhibitory cortical activity is at the basis of the migraine attack (7). Thus far, unravelling the dynamics of the different events and their underlying pathophysiological substrate(s) has proved a significant challenge in migraine prophylaxis research.
Recently, interest in time series analysis has arisen with the intention of expressing the dynamics of headaches in a quantitative manner (8, 9). This type of analysis has long been common practice in the field of epilepsy. Among the first questions addressed using this methodology was the matter of independence of consecutive seizures (10, 11). When seizures tend to cluster in time or, conversely, occur with a high degree of periodicity, this may indicate regulation by physiological control systems, such as feedback loops. A random distribution of times between seizures would, however, point at the involvement of chaotic systems or the influence of multiple external factors. Although the results of these analyses vary between studies, the majority of seizures patterns have been found to be random. Such findings have contributed to better understanding of epileptic seizure frequency and of paroxysmal diseases in general.
A requirement for time series analysis is the availability of suitable data. In particular, it involves observations of large series of events (attacks) within the same patient. In epilepsy there is a relative abundance of detailed datasets accounting the status of individual epilepsy patients on a day-by-day basis. This is partly due to the disease dynamics. Short durations of events and short intervals between events facilitate the collection of detailed longitudinal data. Furthermore, the recognized need for antiepileptic medications and severity of symptoms in refractory epilepsy have warranted longitudinal studies to be performed. Research practice in migraine is clearly different in this respect.
Conceivably, the largest data source on migraine is constituted by the randomized clinical trials of acute antimigraine medication. It has been exploited scientifically to study the course of migraine attacks in the presence and absence of drug treatment (12–14). Long-term studies aimed at efficacy and tolerability of drug treatment are also available (15, 16), yet these have not been utilized for the analysis of migraine disease dynamics. The current investigation explored the possibility of applying clinical trial data on triptans to advance the understanding of the dynamics of migraine and potential implications for the prophylaxis of an attack. Analysis of the episodic pattern of migraine attacks and interictal periods can also be of use in providing answers to practical problems arising in healthcare (17). Examples include the calculation of the expected number of migraine attacks in a population within a certain period, or more accurate calculation of the total number of headache days.
The aim of this analysis was to demonstrate that, within a limited time window, the time between migraine attacks can be described by a gamma distribution, whereas the duration of an attack can be described using the exponential distribution. Based on this evidence, it is demonstrated that the alternation of attacks and attack-free periods can be thought of as a chain of transitions, forming a simple stochastic process. The method is not intended primarily as a tool for the therapeutics of migraine. Rather, it can be used to improve understanding of migraine dynamics and enable optimization of clinical trials with regard to the duration of trials, differences in baseline for attack frequency, placebo response and potentially reduce the bias of certain inclusion criteria when evaluating drug effect. It also allows the description of migraine attack frequency irrespective of its nature, i.e. whether caused by a purely random (stochastic) or deterministic process. This means that, irrespective of external factors triggering an attack, the method can still be used to predict the interval between attacks.
Methods
Data
Data analysis was performed on a sample selected from a total of 1288 patients participating in a clinical study investigating the efficacy of naratriptan and sumatriptan over up to three migraine attacks. Recruited patients had one to six moderate or severe attacks per month, averaged over the previous 6 months, and had a history of migraine of ≥ 12 months. Patients suffering from migraine with aura, migraine without aura and patients experiencing both types of migraine were allowed to enter the study. During the study, patients were treated in an out-patient setting. Prophylactic medication was allowed, except for ergotamine and methysergide.
Patients were included in the data analysis if they had received single doses of placebo, naratriptan 2.5 mg or sumatriptan 100 mg during an attack. In addition, at least two subsequent migraine attacks had to have been recorded. The characteristics of the 394 patients complying with the inclusion criteria for data analysis are summarized in Table 1.
Clinical characteristics of the patient population included in the data analysis

Headache was measured on a four-point scale with scores 0, 1, 2 and 3 representing no pain, mild pain, moderate pain and severe pain, respectively. Measurement started once a patient's first migraine attack reached maximum pain intensity. Self-assessments of headache severity were scheduled at 0, 0.5, 1.0, 1.5, 2.0, 3.0, 4.0, 12.0 and 24.0 h after dosing. In the study data, assessments were also available at 2.5, 3.5, 6.0, 8.0, 42.0 and 48.0 h after dosing, though not for all attacks. Second and third attacks were recorded similarly to the first attack. To enable time series analysis of the headache recordings, data were reformatted in three steps. First, the sampling times of successive migraine attacks were expressed relative to the first attack. In the next step, the time unit was converted from hours to days. Lastly, equally spaced observations were created by (i) preserving only the integer time values and (ii) imputing ‘pain-free’ days during the periods between attacks on which headache severity was not measured. Changing the unit of time from ‘hours’ to ‘days’ should not have any implications for the data analysis other than a possible decrease in the precision of the parameter estimates. However, this was required to ensure balance in data distribution during and between attacks.
Distribution analysis
The interval between attacks was derived from the reformatted dataset by determining the length of ‘0’ score sequences (i.e. headache-free periods). This set of intervals was then modelled using a gamma distribution. This distribution is typically used to characterize processes involving waiting times. It is bounded at the lower end by zero and is unbounded at the upper end. Its appearance is determined by two parameters, a scale parameter reflecting the degree of shallowness of the distribution curve and a shape parameter reflecting the position of the top.
The duration of the attack itself was obtained by determining the length of all non-zero score sequences in the reformatted dataset. These durations were then fit to an exponential distribution. This distribution is characterized by only a scale parameter. The position of the maximum is at time zero, reflecting the observation that most patients experience resolution of headache within 1 day after headache has reached maximum intensity.
The parameters of the gamma and exponential distributions were estimated separately for naratriptan, sumatriptan and placebo treatment arms using maximum likelihood estimation in the statistical software package S-Plus 6.2.1 (Insightful, Seattle, WA, USA).
Stochastic process
Using the results of the distribution analysis, a simple stochastic process was constructed in the form of a Markov chain (Fig. 1). This evaluation was aimed at integrating the different components of disease (i.e. attack and non-attack) and parameterizing the events in a time series in terms of disease states. The Markov chain describes migraine as a process comprising a cycle of transitions that lead up to and away from a migraine attack. The characteristic property of a Markov chain is that only the current state determines what the next state in the process will be. Previous states do not influence the course of the process, making the Markov chain a powerful modelling tool. Furthermore, the transition time from one state to the next is a random variable, i.e. the time spent in the current state before progressing to the next state is exponentially distributed.
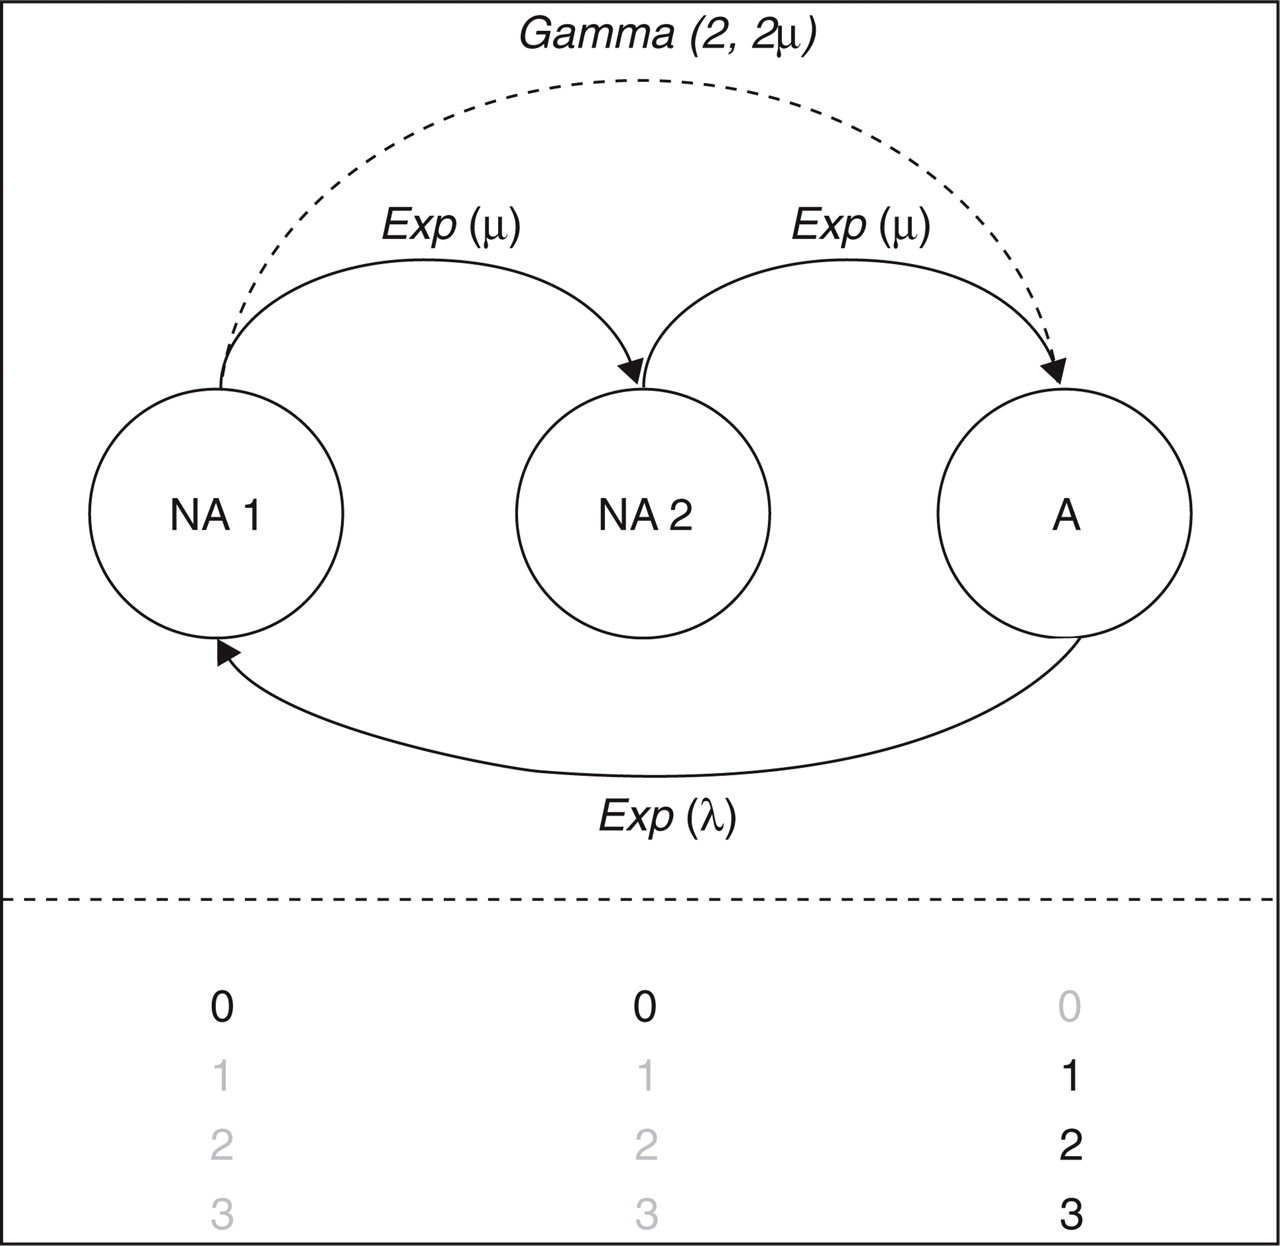
Structure of the stochastic process describing migraine dynamics in a clinical setting. Patients start in state A (attack), which is characterized by headache scores 1, 2 and 3. Pain resolution (state NA1, headache score 0) is achieved according to rate Exp(λ), which is exponentially distributed with scale parameter λ. The pathway to a subsequent attack is described by intermediate state NA2. This process is described by two identical exponentially distributed rates Exp(μ) with scale parameter μ. These rates correspond to a single gamma distribution with shape 2 and scale 2μ (i.e. across two transitions).
As in the distribution analysis, a single exponential distribution accounts for the duration of attacks. In Fig. 1, this is represented by the transition from state A (Attack) to NA1 (No Attack 1). The interval between attacks is modelled as the sum of two identical transitions, from state NA1 to NA2 (No Attack 2) and from state NA2 to A. This part of the model conveniently uses the statistical property that summing over a number of Markov transitions amounts to using a gamma distribution with the shape parameter equal to the number of transitions. Therefore, as in the distribution analysis, a gamma distribution accounts for the interval between attacks. The only difference is that, in the stochastic process, the shape parameter is restricted to positive integer values, whereas in the previous analysis any positive real number was allowed.
In total, the model contains only two scale parameters: one to characterize the duration of attacks and one to characterize the interval between attacks. These parameters were estimated separately for sumatriptan, naratriptan and placebo treatment arms.
In contrast to static distributions, stochastic processes evolve over time. Thus, instead of deriving attack duration (non-zero headache scores) and intervals between attacks (zero headache scores) prior to analysis, the reformatted time series dataset could be analysed directly. The model was implemented in open-source software (18), which was operated from within S-Plus 6.2.1 on a Linux workstation (Fedora Core 3).
Goodness-of-fit statistics
The results of the distribution analysis were assessed graphically. The accuracy of the gamma distribution fits was determined by inspection of quantile plots, showing the correspondence between the sample distribution and the distribution hypothesized by the model. The accuracy of the exponential distribution fits was analysed by comparing the predicted distributions with the histograms of the data. For each bar in the histogram, the area under the distribution curve in that interval should match that of the bar. This is because the total area under the histogram and under each curve is scaled to 1.
The estimates from the stochastic process were expressed in terms of their distributions: exponential distributions for the attack durations and gamma distributions with integer-value shape parameter for the intervals between attacks. These distributions were also compared by means of quantile plots and histograms.
Parameters and their standard errors were estimated. Estimates are reported including 95% confidence intervals (CIs). These were derived from the standard errors using log-normal approximations for scale parameters and normal approximations for shape parameters (19). Significant differences between parameters are indicated by non-overlapping 95% CIs.
To demonstrate the model's practical value, an example is given of inference on the stochastic process. Using a numerical procedure (20) in S-Plus, the stationary or long-term proportion of patients experiencing an attack was calculated based on the parameter estimates of the placebo, naratriptan 2.5-mg and sumatriptan 100-mg models. Mean and CIs for this prediction were derived from the standard errors.
Results
It can be verified that exponential transitions adequately fit the time-series data for attack frequency. Table 2 shows the distributions of the intervals between attacks as estimated by the gamma distribution analysis and by the stochastic process. The estimates of the scale parameter in the distribution analysis are similar across treatments. The shape parameters for naratriptan and sumatriptan are somewhat smaller than that for placebo (1.7 and 1.8 vs. 2.0, respectively). The overlap in the CIs indicates that this difference does not reach statistical significance. As a result, the means of the distributions, which are defined as the product of the scale and the shape, do not differ between treatments either. Although not significant, the estimates in the stochastic process are clearly different from those in the distribution analysis. In particular, the naratriptan and sumatriptan scale parameters are smaller than their corresponding values in the distribution analysis (9.9 and 9.7 vs. 12 and 13). Due to the model structure (Fig. 1), all shape parameters are confined to 2. The differences between the two models are consequently amplified in the means. The actual mean values calculated from the data (Table 1) lie approximately between those estimated for the two methods.
Mean and 95% confidence intervals of the distribution parameters describing the between-attack interval after treatment with placebo, naratriptan 2.5 mg and sumatriptan 100 mg

The stochastic process is presented in terms of the corresponding gamma-based parameters to facilitate comparison with the gamma distribution fit. The means of the estimated distributions are given by the equation: mean = scale × shape. The shape of the stochastic process was constrained to 2, as the model contains two transitions leading up to an attack (see Fig. 1).
Quantile plots were constructed to assess the goodness-of-fit and verify the accuracy of model predictions with respect to the observed data (Fig. 2). Although there is reasonable agreement between analyses, it immediately becomes evident from these plots that data are better predicted by the distribution analysis. Particularly for longer intervals (> 30 days), the stochastic process seems to underestimate drug treatment observations and overestimate placebo data.

Quantile plots showing the accuracy of the predicted between-attack intervals after treatment with placebo, naratriptan 2.5 mg and sumatriptan 100 mg. The distribution hypothesized by the model is plotted on the horizontal axis, the distribution of the data sample is plotted on the vertical axis. The diagonal represents equality between the hypothesized and the sample distribution. Left: results of the distribution fits. Right: results of the stochastic process fits.
Figure 3 illustrates the results of modelling between-attack intervals in terms of distribution plots. From Fig. 3 it also appears that the results from the distribution analysis agree best with the data. In contrast to the quantile plots, discrepancies are most evident in the relatively short intervals (< 20 days).

Predicted and observed distributions of the between-attack intervals for placebo, naratriptan 2.5 mg and sumatriptan 100 mg. The results of the distribution analysis (solid line) and the stochastic process (dotted line) are superimposed on the histograms of the observed distributions. For the purposes of comparison, the distributions are scaled so that the area under every curve and under the histogram adds up to 1.
Modelling results for the duration of the attacks are summarized in Table 3. The attack durations are significantly shorter in the presence of drug, irrespective of the type of analysis and drug. Consistent with the estimates obtained for between-attack intervals, a higher value for the scale parameter was observed for the placebo arm and lower values for the active treatment arms (naratriptan and sumatriptan) using the stochastic model compared with the distribution analysis (0.86, 0.54 and 0.54 days vs. 0.77, 0.61 and 0.61 days).
Mean and 95% confidence intervals of the distribution parameters describing attack duration after treatment with placebo, naratriptan 2.5 mg and sumatriptan 100 mg

By definition, the means of the estimated distributions are equal to the scale parameters.
Since the observed attacks lasted either 1 or 2 days, quantile plots cannot be constructed from these data. Instead, the accuracy of the predictions with respect to the data was assessed using the areas under the distribution plots (Fig. 4). From day 0 to 1 in the placebo plot, the areas are 0.73, 0.73 and 0.69, for the observed data, distribution analysis and stochastic process, respectively. Following treatment with either naratriptan or sumatriptan, the areas are 0.89, 0.81 and 0.84, respectively. The areas between days 1 and 2 need not be calculated since they are the complements of the areas between days 0 and 1. Thus, the stochastic process performs slightly better than the distribution analysis in predicting the attack duration after sumatriptan and naratriptan. However, it performs less well in predicting the attack duration after placebo.

Prediction of the distribution of attack durations for placebo, naratriptan 2.5 mg and sumatriptan 100 mg. The results of the distribution analysis (solid line) and the stochastic process modelling (dotted line) are superimposed on the histograms of the observed distributions. The area under every curve and under the histogram adds up to 1.
Lastly, an example is given of how the dynamics of the stochastic process can be used for statistical inference. This was done using the property that in the long term the proportion of patients residing in each of the states of this model becomes stationary. Based on the dynamics of alternating attack and no-attack periods in the stochastic process, it is possible to derive the proportion of patients suffering migraine pain at any given time beyond the observation window of the clinical study. The percentage of patients having migraine headache at any given moment was found to be 5.5% (3.8, 7.8) for placebo, 4.9% (3.8, 6.3) for naratriptan 2.5 mg and 4.9% (3.9, 6.3) for sumatriptan 100 mg (mean and CI). The clinical implications of the differences between placebo and active treatment become evident if pain severity is further taken into account.
Discussion
Clinical studies in preventive therapy are aimed at (i) reducing attack frequency, severity and duration; (ii) improving responsiveness to treatment of acute attacks; and (iii) improving function and reduce disability, as assessed by improved health-related quality of life measures (21–23). However, no data analysis has been proposed that integrates the different components of treatment response. In this study we have shown how migraine attack episodes and between-attack intervals can be characterized by an independent distribution analysis of each component and by an integrated stochastic process. In both approaches, an attempt is made to describe the dynamics of disease by a model parameterization that facilitates the evaluation of treatment effect in migraine prophylaxis.
Based on the distribution analysis performed on the attack durations and between-attack intervals, it was possible to establish how attack frequency and attack duration are correlated with each other. Although simple, the proposed model captures the alternating pattern of periods of attack and no-attack using gamma and exponential distributions. Most interesting is that our findings provide evidence that no statistically significant differences exist for between-attack intervals after treatment with triptans. The trend observed in the estimates obtained by the stochastic process for the active treatment is probably due to the fact that the shape in the model was confined to the integer 2. Previous investigations of the overuse of triptans have suggested an increase in attack frequency (24), but estimates from conventional data analysis based on headache days tend to overlook the time course of migraine attacks.
Inspection of different graphical goodness-of-fit criteria revealed that the distribution analysis predicted the attack frequency more accurately than the stochastic process. This can be explained by the presence of a shape parameter in the gamma distribution, which allows better description of the distribution of between-attack intervals and is missing in the stochastic process. As can be expected, the estimated attack durations were significantly shorter in the active treatment groups relative to the placebo group. A limitation of our analysis is the short duration of the trials. The data used for this evaluation were from a randomized clinical trial of the acute antimigraine drugs sumatriptan and naratriptan. For each patient in this trial, up to three subsequent migraine attacks were recorded. This number of events is too small to allow characterization of the overall (long-term) disease dynamics on an individual basis. However, the total number of patients (n = 394) included provides sufficient information to allow accurate population parameter estimates.
Durations and frequencies of migraine attacks are commonly reported in demographic studies using mean values and ranges, but no attention has been given to the distribution of these measures. A statistical distribution captures the complete information of a measure using only a few parameters. Recently, the individual distributions of migraine and tension-type headaches have been described by Houle et al. (25). To distinguish clearly between these types of headache, attacks and headache-free episodes were considered parts of a single distribution, which was found to be closer to normal when the headache condition was more chronic and bimodal (two-peaked) otherwise. In this study the emphasis was on the timing of migraine attacks. To this purpose, attacks were treated as separate events characterized by distributions which, in contrast to bimodal distributions, are quantitatively well-defined.
In formulating the model, the terms headache-free and attack-free have been used interchangeably. This assumption implies that the acute antimigraine drugs act by terminating the attack, rather than only suppressing the pain caused by it. This is visualized in Fig. 1, where ‘no headache’ scores are associated only with attack-free states NA1 and NA2. There is no obvious interpretation for intermediate state NA2. It was required to characterize the period between attacks, which spans over two identically distributed intervals (A–NA1 and NA1–NA2). It is, however, conceivable that the time between two attacks can be subdivided into periods according to their susceptibility to precipitating factors or occurrence of premonitory symptoms. These periods are not likely to have equal durations.
To our knowledge, with the exception of genetic susceptibility, gender and age are the most important demographic covariates to influence headache severity. Thus far, no published evidence is available about the effect of intrinsic and demographic factors on attack frequency. In this sense, we are not surprised by the fact that we have not found any significant relationships. Moreover, the analysis shows no impact of treatment either, which contrasts with myth about the role of treatment with triptans on attack frequency.
As our results are derived from data of an acute migraine study, the current findings may not fully represent the typical study setting used in migraine prophylaxis, in which reduction in the frequency of attacks or change from baseline in headache days are the primary end-points. These differences in study design should not invalidate the concepts of migraine dynamics described here. Of particular interest is the fact that this study setting is unlikely to be influenced by patient expectation about drug effect in the periods between attacks, which may occur in a prophylaxis study and often leads to a substantial placebo response. Furthermore, prophylaxis studies restrict inclusion into the study to patients who experience a high frequency of attacks. We strongly believe that current study conditions represent therefore a more realistic representation of the overall pattern of attacks in the population of migraineurs.
Statistical distributions are important tools for making inference on data samples. They summarize many properties of datasets using a few parameters. However, they cannot describe by themselves more complex dynamics such as alternating sequences of events. In order to describe such an interaction, distributions need to be linked by stochastic processes. Once a stochastic process has been defined, a system's dynamics can be investigated and its properties well characterized. With regard to this type of system, the property of interest is usually the stationary distribution of the process, reflecting its long-term behaviour. In epilepsy, simple Markov chains have been applied to test for the existence of stationary behaviour in a patient's seizures (26). A Poisson process has also been used to model the number of cardiac arrests that can be expected in a hospital population in a given time interval. Although migraine and headaches in general are characterized by more complicated time distributions, developing statistical descriptors for these conditions will prove useful in a practical sense and will help provide insight into disease mechanisms, particularly when describing treatment effects.
The method proposed in this study was not intended primarily for use as a tool in therapeutics of migraine. Rather, it was meant to improve the current understanding of migraine dynamics and enable optimization of clinical studies with regard to the duration of trials, differences in baseline frequency and the role of time dependencies in placebo response, and potentially reduce the bias of certain inclusion criteria on the estimates of treatment effect in migraine prophylaxis.