
Abstract
Between attacks, migraineurs lack habituation in standard visual evoked potentials (VEPs). Visual stimuli also evoke high-frequency oscillations in the gamma band range (GBOs, 20–35 Hz) assumed to be generated both at subcortical (early GBOs) and cortical levels (late GBOs). The consecutive peaks of GBOs were analysed regarding amplitude and habituation in six successive blocks of 100 averaged pattern reversal (PR)-VEPs in healthy volunteers and interictally in migraine with (MA) or without aura patients. Amplitude of the two early GBO components in the first PR-VEP block was significantly increased in MA patients. There was a significant habituation deficit of the late GBO peaks in migraineurs. The increased amplitude of early GBOs could be related to the increased interictal visual discomfort reported by patients. We hypothesize that the hypo-functioning serotonergic pathways may cause, in line with the thalamocortical dysrhythmia theory, a functional disconnection of the thalamus leading to decreased intracortical lateral inhibition, which can induce dishabituation.
Introduction
A lack of habituation of pattern reversal visual evoked potentials (PR-VEPs) during the repetition of the same stimuli has been observed in migraine patients between attacks (1).
This abnormality has been attributed to increased cortical excitability (2), possibly due to deficient intracortical inhibition (3) or to a reduced preactivation level of the visual cortex, which may be due to insufficient activation by aminergic projections from the brainstem (4).
Several electrophysiological methods, including evoked potentials, electromyography and transcranial magnetic stimulation, have been used to study this apparent controversy, but without solving it (5). Beyond the classical broadband components of standard evoked potentials, we have recently studied in migraine patients the high-frequency oscillations embedded in somatosensory evoked potentials and have found indications of a reduced activity of thalamo-cortical afferents (6), which would support the hypothesis that a decreased cortical preactivation level is the culprit in the habituation deficit in migraine.
In PR-VEPs, another type of high-frequency oscillation has mainly been analysed: gamma-band oscillations (GBOs). They can be identified after appropriate digital high-pass filtering (> 20 Hz) as high-frequency (∼20–80 Hz) rhythmical oscillatory activities embedded in the conventional scalp-recorded evoked potentials. GBOs have been recorded in animals (7–10) as well as in humans with depth (11) and scalp electrodes (12, 13).
GBOs have been attributed to the activity of inhibitory interneurons in cortical/subcortical structures (14), to synchronized thalamocortical discharges (15–17) and to the activity of cortical fast rhythmic bursting cells, so-called ‘chattering’ cells (9).
Two independent groups of investigators, using a particular algorithm applied to multichannel recordings (18) and a factorial analysis (19), have found that two separate components can be identified in visual-evoked GBOs: the first probably generated in subcortical structures, the second originating in the occipital cortex itself, probably in area V1.
In order to investigate more precisely the potential role of thalamocortical loops and inhibitory interneurons in the habituation deficit of visual information in migraineurs, we have performed a concomitant study of low- and high-frequency visual cortical activities.
Materials and methods
Subjects
Thirty migraineurs (nine male and 21 female, mean age 29 ± 9 years) were enrolled. According to the diagnostic criteria defined by the 2nd edition of the International Classification of Headache Disorders (ICHD-II, 2004), 15 patients had migraine without aura (MoA, code 1.1; five male and 10 female, mean age 31 ± 10 years; mean attack frequency 1.7 ± 1.5/month) and 15 migraine with aura (MA, code 1.2.1; four male and 11 female, mean age 30 ± 10 years; mean attack frequency 1.5 ± 1.2/month). Multiple diagnoses were not allowed. The migraine patients were compared with 15 healthy subjects of comparable age and gender distribution (six male and nine female, mean age 27.7 ± 8 years). The latter had never presented disabling headaches or aura-like symptoms, had no recurrent (> 1–2/year) mild headache and were not aware of any first- or second-degree family member suffering from disabling headaches. Subjects taking any medication on a regular basis were excluded, as well as subjects who did not reach a best corrected visual acuity of > 8/10.
Migraine patients had to be attack free for at least 3 days before and after the recordings (the latter checked by telephone interview) and without prophylactic antimigraine therapy in the previous 3 months.
All participants were given a complete description of the study and signed informed consent in accordance with the declaration of Helsinki, and the study was approved by the Ethics Committee of the Faculty of Medicine, University of Liège, Belgium.
Data acquisition
Subjects under examination were seated in a semidark, acoustically isolated room in front of the display surrounded by a uniform field of luminance of 5 cd/m2. Prior to the recording, each subject was adapted to the ambient room light for 10 min to obtain a constant pupil diameter. Stimulation was monocular after occlusion of the other eye. Visual stimuli consisted of full-field checkerboard patterns (contrast 80%, mean luminance 250 cd/m2) generated on a TV monitor and reversed in contrast at a rate of 3.1/s. At the viewing distance of 80 cm, the single check edges subtended 15 min of visual angle. Subjects were instructed to fixate a red dot in the middle of the screen with the left eye covered by a patch to maintain stable fixation. The bioelectric signal was recorded from the scalp by means of pin electrodes positioned at Oz (active electrode) and at Fz (reference electrode, 10/20 system); a ground electrode was placed on the right forearm. The evoked potential signals were amplified by CEDTM 1902 preamplifiers (band-pass 0.05–2000 Hz, Gain 1000) and recorded by a CEDTM 1401 device (Cambridge Electronic Design Ltd, Cambridge, UK). During uninterrupted stimulation 600 sweeps of 200 ms duration were sampled at 4000 Hz.
The recordings were partitioned in six sequential blocks of 100 responses, of which at least 85 artefact-free sweeps were averaged off-line (‘block averages’) using the SignalTM software package version 2.14 (CED Ltd).
Data analysis
Broadband PR-VEPs
We considered as broadband (B-B) PR-VEPs the averaged visual signals digitally filtered between 1 and 35 Hz (Barlett-Hanning window, 701 filters' coefficients) The various components were identified according to their respective latencies: N1 as the most negative peak between 60 and 90 ms after the stimulus, P1 as the most positive peak following N1 at a latency of 80–120 ms. The peak-to-peak amplitude of N1–P1 was measured.
Gamma-band oscillations
Digital zero-phase shift band-pass filtering between 20 and 35 Hz (Barlett-Hanning window, 701 filters' coefficients) was applied off-line in order to extract the GBOs superimposed on the broadband components N1 and P1 of the PR-VEP. In all traces it was possible to identify within the 200-ms poststimulus time period four separate bursts of wavelets and separate them into four negative (termed n0 to n3) and three positive peaks (from p1 to p3) (12). By analogy with previous studies (19), the first three peak-to-peak amplitudes (n0–p1, p1–n1, n1–p2) were considered as the early GBO bursts and the last 3 (p2–n2, n2–p3, p3–n3) as the late GBO bursts (Fig. 1).

Illustrative recordings of the conventional broadband (1–35 Hz) (upper) and gamma band (20–35 Hz) (lower) pattern reversal visual evoked potentials in a healthy volunteer (HV) and migraine with aura (MA) patient. The six components (n0–p1, p1–n1, n1–p2, p2–n2, n2–p3, p3–n3) of the gamma bursts are identified.
To avoid variability due to interindividual differences in PR-VEP amplitude, habituation of broadband N1–P1 and of GBO amplitudes was defined as the percentage change of the peak-to-peak amplitude between the first and the sixth block of averages.
Statistical analysis
The Statistical Package for the Social Sciences (SPSS) for Windows, version 15.0 was used for all analyses (SPSS Inc., Chicago, IL, USA). VEP BB and GBO data were similarly analysed.
The normal distribution of data for each group of subjects was tested with the Shapiro–Wilks test. Values were expressed as means ± SD. Multivariate analysis of variance was performed taking as within-subjects factors block amplitudes and the percentage change of the sixth block compared with the first and as between-subjects factor ‘Group’ [healthy volunteers (HV), MoA, MA] with a posthoc least-significant difference test. Values with a non-gaussian distribution were compared with the Mann–Whitney U-test and a Bonferroni correction.
Moreover, in order to determine which factors could explain most of the variance observed for B-B VEPs and VEP GBOs, a factor analysis was performed using a principal component analysis and a varimax orthogonal rotation method (19). Only factors explaining a variance > 1 were considered significant.
Results
Examples of VEP recordings before and after high-frequency filtering, obtained from a healthy subject and from a MA patient, are shown in Fig. 1.
Mean data and relative statistical analyses of electrophysiological data are presented in Tables 1 and 2.
Peak-to-peak amplitudes and percentage amplitude changes between first and sixth blocks of averages for broadband visual evoked potentials and gamma band oscillations (GBOs) in healthy volunteers (HV), migraine with aura (MA) and migraine without aura (MoA)

HV vs. MoA or MA;
MoA vs. MA.
Factor analysis on the B-B VEP and GBOs amplitude change (6th block−1st block/1st block) in the three groups of subjects (in bold: principal component loadings > 0.7000)

B-B VEP, Broadband visual evoked potential; GBO, gamma band oscillation; HV, healthy volunteers; MoA, migraine without aura; MA, migraine with aura.
B-B PR-VEP
In B-B (1–35 Hz) PR-VEP neither N1 and P1 latencies nor N1–P1 amplitudes were significantly different between HV, MoA or MA in any of the six averaged blocks (P > 0.05).
The mean percentage change of PR-VEP N1–P1 amplitude between the first and sixth blocks was −9.1 ± 10.8% in HV, +13.8 ± 25.3% in MoA and +12.1 ± 29.7% in MA. This difference was significant between HV and MoA (P = 0.017), and between HV and MA (P = 0.010, see Table 1 and Fig. 2).
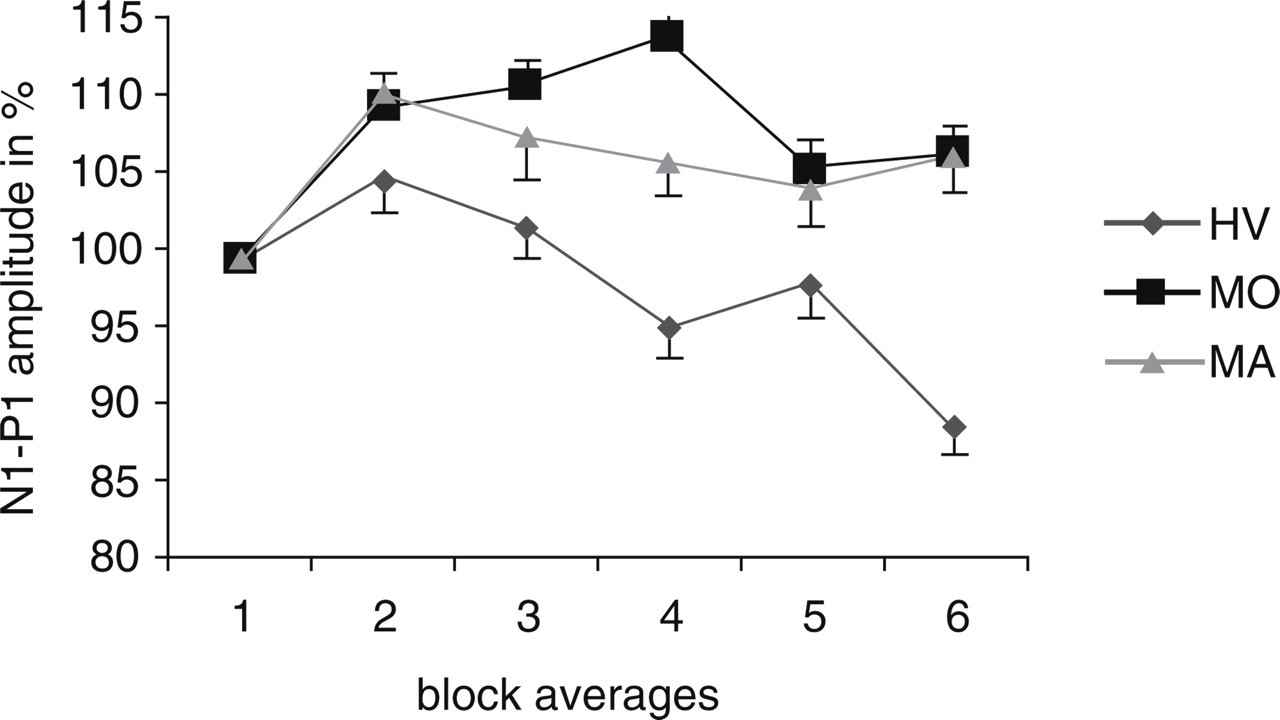
Conventional broadband pattern reversal visual evoked potentials (1–35 Hz): amplitude change over six blocks of averages (mean ± standard deviation). HV, Healthy volunteers; MoA, migraine without aura; MA, migraine with aura.
The VEP amplitude change between first and sixth blocks was negatively correlated with the first block amplitude in the HV (r = −0.514, P = 0.05) and MoA groups (r = −0.641, P = 0.01 in MoA). A tendency to a similar correlation occurred in MA patients (r = −0.456, P = 0.088).
GBOs
After band-pass filtering between 20 and 35 Hz, a burst of time-locked wavelets of oscillations (GBOs) was observed in every subject and in eachsequential block of averages. In agreement with Sannita et al. (12), we found the highest interindividual amplitude variability for the last p3–n3 GBO component (Fig. 1 and Table 1). In fact, distributions were not normal for this component, which was then compared between groups with non-parametric statistics (see Methods).
Wavelet peaks were not significantly different in latency between subject groups (HV, MoA, MA) along the six sequential blocks of averages.
In the first block of averages, the amplitude of the two early GBO components n0–p1 and p1–n1 was significantly greater in MA compared with HV (P = 0.026 and P = 0.043, respectively) or with MoA (respectively P = 0.024 and P = 0.050). The difference was not significant between MoA and HV, nor between any of the three subject groups for the three late peaks p2–n2, n2–p3 and p3–n3 (Table 1 and Fig. 3).
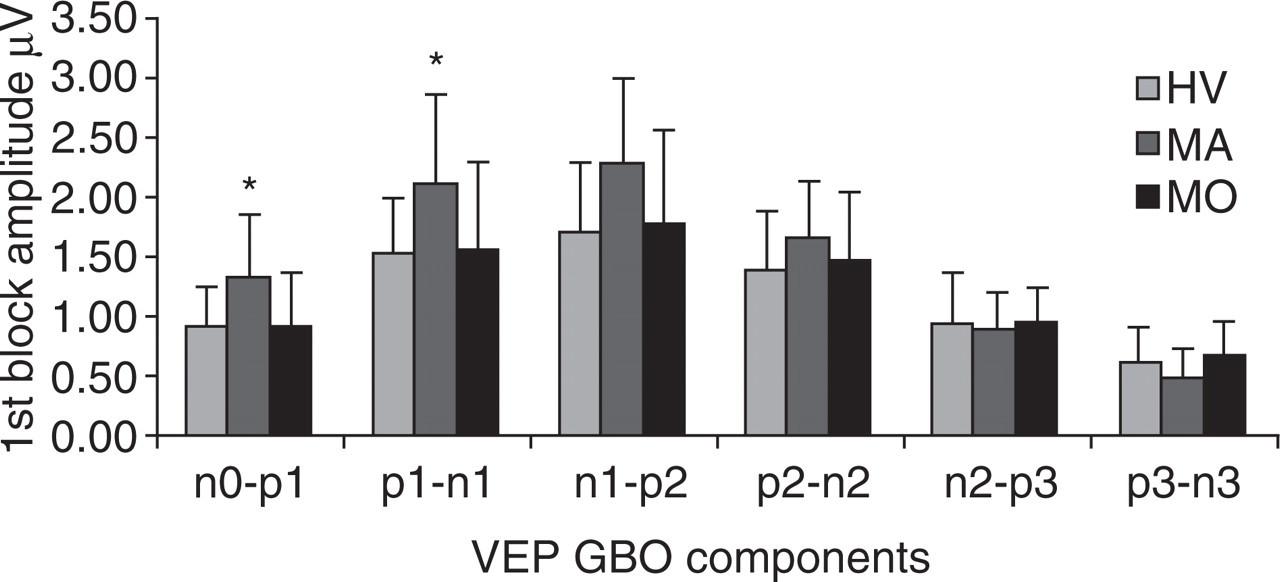
Visual evoked potential gamma band oscillations (20–35 Hz): peak-to-peak amplitude of the six components in the first block of 100 averages (mean ± standard deviation). HV, Healthy volunteers; MoA, migraine without aura; MA, migraine with aura.
When the percentage amplitude change between first and sixth blocks was calculated for each GBO component, there was a slight habituation, i.e. amplitude decrease, for the three early wavelets (n0–p1, p1–n1 and n1–p2) in all subject groups (Fig. 4).
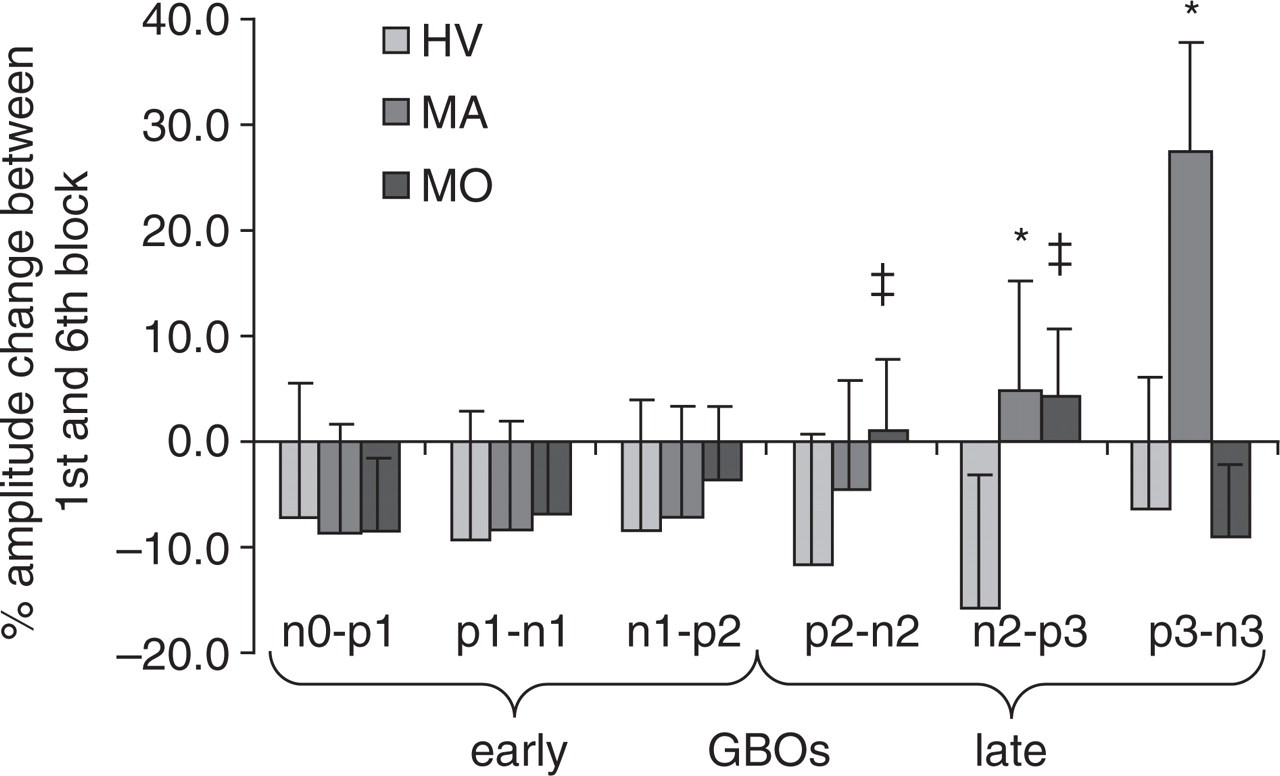
Gamma band oscillations (GBOs) (20–35 Hz): amplitude change (%, mean ± standard error) between first and sixth blocks of 100 averagings for the six components of the visual evoked potential gamma burst (∗P < 0.05 MA vs. HV; ‡P < 0.05 MoA vs. HV). HV, Healthy volunteers; MoA, migraine without aura; MA, migraine with aura.
By contrast, for the remaining GBO components p2–n2, n2–p3 and p3–n3, an amplitude increase (i.e. potentiation) was found, reaching the level of statistical significance for the fourth (p2–n2) and fifth (n2–p3) GBO component in the MoA group (P = 0.041 and P = 0.025, respectively) and for the fifth (n2–p3) and sixth (p3–n3) components in the MA group (P = 0.009; P = 0.007) compared with HV. The potentiation of the sixth (p3–n3) component was significantly greater in MA than in MoA (P = 0.048) (Fig. 4).
Principal component analysis of all measured VEP components identified three factors explaining most of the variance of the percentage amplitude change between first and sixth averaged blocks. Factor 1 is represented chiefly by the early GBO components (from n0–p1 to n1–p2 for HV and MA, from n0–p1 to p2–n2 for MoA), factor 2 by the late GBO components (p2–n2 and n2–p3 for HV and MA) and by habituation slope and amplitude of the B-B VEP N1–P1 component for MA, factor 3 by the late GBO components n2–p3 and p3–n3 for MoA as well as the habituation slope and amplitude of the B-B VEP N1–P1 component for HV and MoA (Table 2).
There were no significant correlations between the measures performed on B-B VEPs and those obtained for VEP GBOs.
Discussion
This study has confirmed our previous findings showing an interictal habituation deficit of the B-B PR-VEP in patients suffering from MA or MoA when compared with healthy volunteers (see Schoenen et al. for a review (5)).
As seen in previous studies, the amplitude in the first block of 100 averages was negatively correlated with habituation over six blocks in HV and MoA, but there was a trend for such correlation in MA, as reported by others (20). This could be related to the trend for greater first block amplitude in the B-B VEP of MA patients, confirming once more the inverse relationship between initial amplitude and habituation (21).
The absence of correlation between B-B VEPs and gamma band oscillations may indicate that these activities evoked by the same stimulus have different generators and different functional significance. This is supported by the principal component analysis, which shows that separate factors are responsible for the variance in habituations of B-B VEPs and of GBOs.
To the best of our knowledge, this is the first study to explore visual evoked potential GBOs in migraine patients. Before discussing the possible significance of our findings for the pathophysiology of migraine, it seems therefore adequate to review briefly the present knowledge about the neural generators of GBOs.
After appropriate visual stimulation, subpopulations of neurons in the lateral geniculate nuclei (LGN) (10) and visual cortex (7–9, 14) tend to synchronize and generate several successive bursts of oscillations at gamma band frequencies (20–80 Hz) (15–17). There is evidence that oscillatory responses are strongly correlated between retina, lateral geniculate nucleus and cortex, indicating that cortical neurons can become synchronized by oscillatory activity relayed through the lateral geniculate nucleus (22). On the cortex this oscillatory activity can be easily recognized after adequate band-pass filtering of the conventional visual evoked responses (12). A discrete network of inhibitory interneurons and fast spiking burst pyramidal cells, named ‘chattering cells’ (9), seems to be responsible for the coherent spatiotemporal oscillatory patterns at the cortical level.
The bursts of GBOs are likely to have different generators, depending on their latency. Using factor analysis, Carozzo et al. (19) have found that the variance in early and that in late gamma waves were explained by different factors and have proposed that this might be due to different precortical and cortical contributions. A subcortical contribution to visual-evoked GBOs has been suggested previously after multichannel scalp recordings (18).
We found that the amplitude of the early burst of GBOs is increased in MA patients when compared with controls. This increase persists, although not always at the level of significance, during the whole session of visual stimulation in all sequential blocks of averages. Interestingly, increased susceptibility to illusions when exposed to high-contrast square-wave grating stimuli has been chiefly found in migraine patients having auras (23), and this visual discomfort seems to be directly linked with a rise in gamma band activity in the visual cortex (24). Interestingly, unpleasant visual information presented in a checkerboard background with a spatial frequency of 2.2 cycles per degree (similar to our study) induced an increase of cortical visual oscillatory activity in the 20–35 Hz range (gamma band) between 60 and 90 ms following stimulus onset (25).
In both MA and MoA groups the dishabituation phenomenon involves the later, rather than the earlier GBOs. It begins at the end of the early burst of oscillations (n1–p2) and becomes significant only in the later bursts (p2–n2, n2–p3 and p3–n3).
Assuming that early and late GBOs are generated, respectively, at precortical and cortical levels and considering that the last component (n1–p2) of the early GBO peaks is in the same latency range as the N1–P1 wave of the B-B PR-VEP, which has a cortical origin, the n1–p2 component probably corresponds to the arrival of the visual information in the cortex (thalamocortical terminals), whereas the later components are strictly related to cortical activities. This would suggest that the VEP habituation deficit in migraine is chiefly, if not exclusively, restricted to the cortical level.
The cellular and molecular mechanisms of habituation in CNS information processing are multifactorial and still poorly understood. Although habituation occurs at multiple stages in sensory pathways, it is known to be more pronounced and modality dependent at cortical than at subcortical levels (26). Our results provide direct evidence in favour of this difference, because they show that in healthy volunteers habituation is more pronounced in the late GBOs, considered to be generated in the visual cortex, than in the early GBOs, assumed to be of subcortical origin.
High-frequency oscillations in thalamocortical neurons have been attributed to changes in dendritic and astrocytic calcium conductance (27, 28). In particular, thalamic T type Ca2+ channels are responsible for the frequency modulation of thalamic oscillations (17, 29). A change of thalamocortical activity due, for example, to anatomical or functional dysconnection of the thalamus can indeed favour low-frequency activity, which at the cortical level will reduce lateral inhibition and enhance high-frequency phase-locked discharges in cortical networks of inhibitory interneurons. This could underlie the so-called thalamocortical dysrhythmia syndromes (17, 30). Evidence favouring abnormal thalamic activity also comes from the analysis of high-frequency somatosensory evoked potentials, thought to reflect thalamocortical activity, in migraine patients between attacks (6). Migraine might thus be characterized interictally by functional dysconnection of the thalamus leading to increased gamma band oscillations in the cortex, as in other thalamocortical dysrhythmias, and to reduced cortical habituation.
We have previously postulated that hypofunctioning serotonergic projections to the thalamus and cortex could be responsible for the habituation deficit and change in high-frequency oscillations found interictally in migraine (4, 6). There is circumstantial evidence that migraine is a disorder with low CNS serotonin transmission (31), and this may cause a deficit in habituation (32). Various neurotransmitters are able to modulate thalamic and cortical high-frequency oscillations. For example, cholinergic activation increases gamma band activity and its frequency tuning (33, 34). In animals, microinjections of noradrenaline or serotonin into the cholinergic nuclei of the basal forebrain differentially modulate high-frequency gamma activity (35): noradrenaline produces an increase in gamma activity and waking, whereas serotonin decreases gamma activity with no effect on the sleep–wake cycle. We therefore propose that hypofunctioning serotonergic pathways may cause a functional dysconnection of the thalamus leading to thalamocortical dysrhythmia, which will induce both the abnormality of evoked gamma band oscillations and the habituation deficit in the visual cortex. This hypothesis can be tested in future studies on migraineurs by comparing surrogate markers of CNS serotonin activity with VEP GBOs, and by recording GBOs during a migraine attack (when serotonin activity increases) (31), and after preventive antimigraine therapy with selective serotonin reuptake inhibitors, both conditions that are known to normalize the habituation deficit of B-B VEPs (20, 36).
Acknowledgements
The authors thank Tracie Dornbusch for technical assistance in preparing the article. This work was supported by research convention no. 3.4563.04 of the National Fund for Scientific Research (Belgium) to J.S.