
Abstract
We aimed to estimate primary sensory evoked potential (EP) amplitude, amplitude–intensity functions and habituation in migraine patients compared with healthy control subjects and to investigate the possible relation to check size, sound and light discomfort thresholds, and the time to the next attack. Amplitudes of cortical visual evoked potentials (VEP, check size 8′ and 33′), cortical long latency auditory evoked potential (AEP N1P1; 40, 55 and 70 dB SL tones) and brainstem auditory evoked potential (BAEP wave IV–V; 40, 55 and 65 dB SL clicks) were recorded and analysed in a blind and balanced design. The difference between the response to the first and the second half of the stimulus sequence was used as a measure of habituation. Twenty-one migraine patients (16 women and five men, mean age 39.3 years, six with aura, 15 without aura) and 22 sex- and age-matched healthy control subjects were studied (18 women and four men, mean age 39.5 years). Low sound discomfort threshold correlated significantly with low levels of BAEP wave IV–V amplitude habituation (r = –0.30, P = 0.05). VEP and AEP amplitudes, habituation, and amplitude–intensity function (ASF) slopes did not differ between groups when
Keywords
Introduction
Migraine patients often have symptoms of visual and auditory dysfunction, e.g. photophobia and phonophobia. Psychophysical discomfort thresholds to light and sound stimuli are also decreased in migraineurs compared with healthy controls (1–4), and various electrophysiological abnormalities have been reported (5, 6). Migraine patients may have enhanced electroencephalogram (EEG)-‘H-response’, i.e. a persistent visible driving response to photic flash stimuli with high repetition frequencies (≥ 20 Hz) (7, 8), but past and recent research suggest that the H-response is not specific to migraine (7, 9). Studies of cortical sensory evoked potentials (EP) in migraine have yielded variable results (6). Consistent changes in conventional visual evoked potentials (VEP) and auditory evoked potentials (AEP) have not been observed Stimulus methods have varied in previous research, however, and we intended to test the hypothesis that pattern size has influence on VEP amplitude differences between migraine patients and headache-free subjects.
Reduced habituation in various cognitive event-related potentials such as contingent negative variation (CNV) and P300 has been found in migraine (10, 11). It has been reported that the normal habituation of visual evoked amplitudes to repeated stimuli seems to be suppressed in migraine patients (12, 13). A recent study failed to find VEP amplitude habituation differences between migraine and control subjects and habituation was most pronounced for small checks (i.e. high spatial stimulus frequency) (14).
In addition, the long-latency AEP intensity–amplitude function has been found to be increased in migraine patients compared with headache-free control subjects (15). Because AEP amplitudes evoked by low-intensity stimuli seemed to be low in migraine it has been suggested that cortical preactivation level is decreased interictally in migraine patients (16, 17). AEP intensity–amplitude steepness has been suggested to reflect cortical serotonin activity (18), although one recent study failed to confirm this hypothesis (19).
Brainstem auditory evoked potential (BAEP) is a sensitive measure of central nervous system (CNS) dysfunction (20, 21), and amplitudes of the late (pontomesencephalic) waves are suppressed by serotonin in rats (22). Because brainstem nuclei seem to be activated during migraine attacks (23), and because serotonin-depleting drugs may alter BAEP in migraine patients (24), we decided also to include this EP modality in our study. We would particularly like to test the hypothesis that increased cortical AEP amplitude intensity in migraine could be a passive reflection of a similar hyperactivity in the brainstem.
Migraine pathophysiology related to phonophobia and photophobia and to reduced light and sound discomfort thresholds is unknown. We hypothesized that the recently reported signs of electrophysiological CNS sensitization (12, 15, 25) may represent (or be related to) the process responsible for increased sensitivity to light and sound. One specific aim of our study was to investigate if either VEP amplitude and amplitude habituation or AEP and BAEP amplitude, amplitude habituation, and amplitude–intensity function slopes correlate with light and sound discomfort thresholds. Such information could shed some light on the possible CNS generators of photophobia and phonophobia in migraine patients. Another objective was to estimate EP amplitudes and the magnitude of the migraine-related habituation of pattern VEP evoked by different spatial frequency stimuli, as well as AEP and BAEP stimulus intensity functions, in a blind and balanced study design. The simultaneous acquisition of different EP modalities in the same patient would also allow us to test for the hypothesis that VEP, AEP and BAEP (habituation and intensity dependence) reflect a general CNS state or, alternatively, mirror modality-specific neural processes (26). We also wanted to investigate if any EP measure was related to time interval to the next attack, because electrophysiological changes in CNV amplitude (27) and alpha rhythm variability (28) have been found in the pre-attack period.
Patients and methods
Patients
Patients fulfilling the International Headache Society (IHS) criteria (29) for migraine and control subjects with no headache disorder history were recruited among those who previously were studied for light and sound discomfort threshold (3, 4). Patients with coexisting tension-type headache and patients who used analgesics daily for acute or chronic painful disorders, neuroleptic drugs, anti-depressive drugs or migraine prophylactic drugs were excluded. Patients who reported headache when they arrived to the test were also excluded from the analysis. Twenty-one migraine patients (Table 1) were included. Six patients had migraine with aura (mean age 41 years, two men) and 15 had migraine without aura (mean age 39 years, three men) according to the IHS classification. Twenty-two control subjects were recruited from hospital staff and community neighbours to match the patient group closely regarding age and sex.
Demographic data for migraine patients, migraine subgroups and healthy controls (mean,
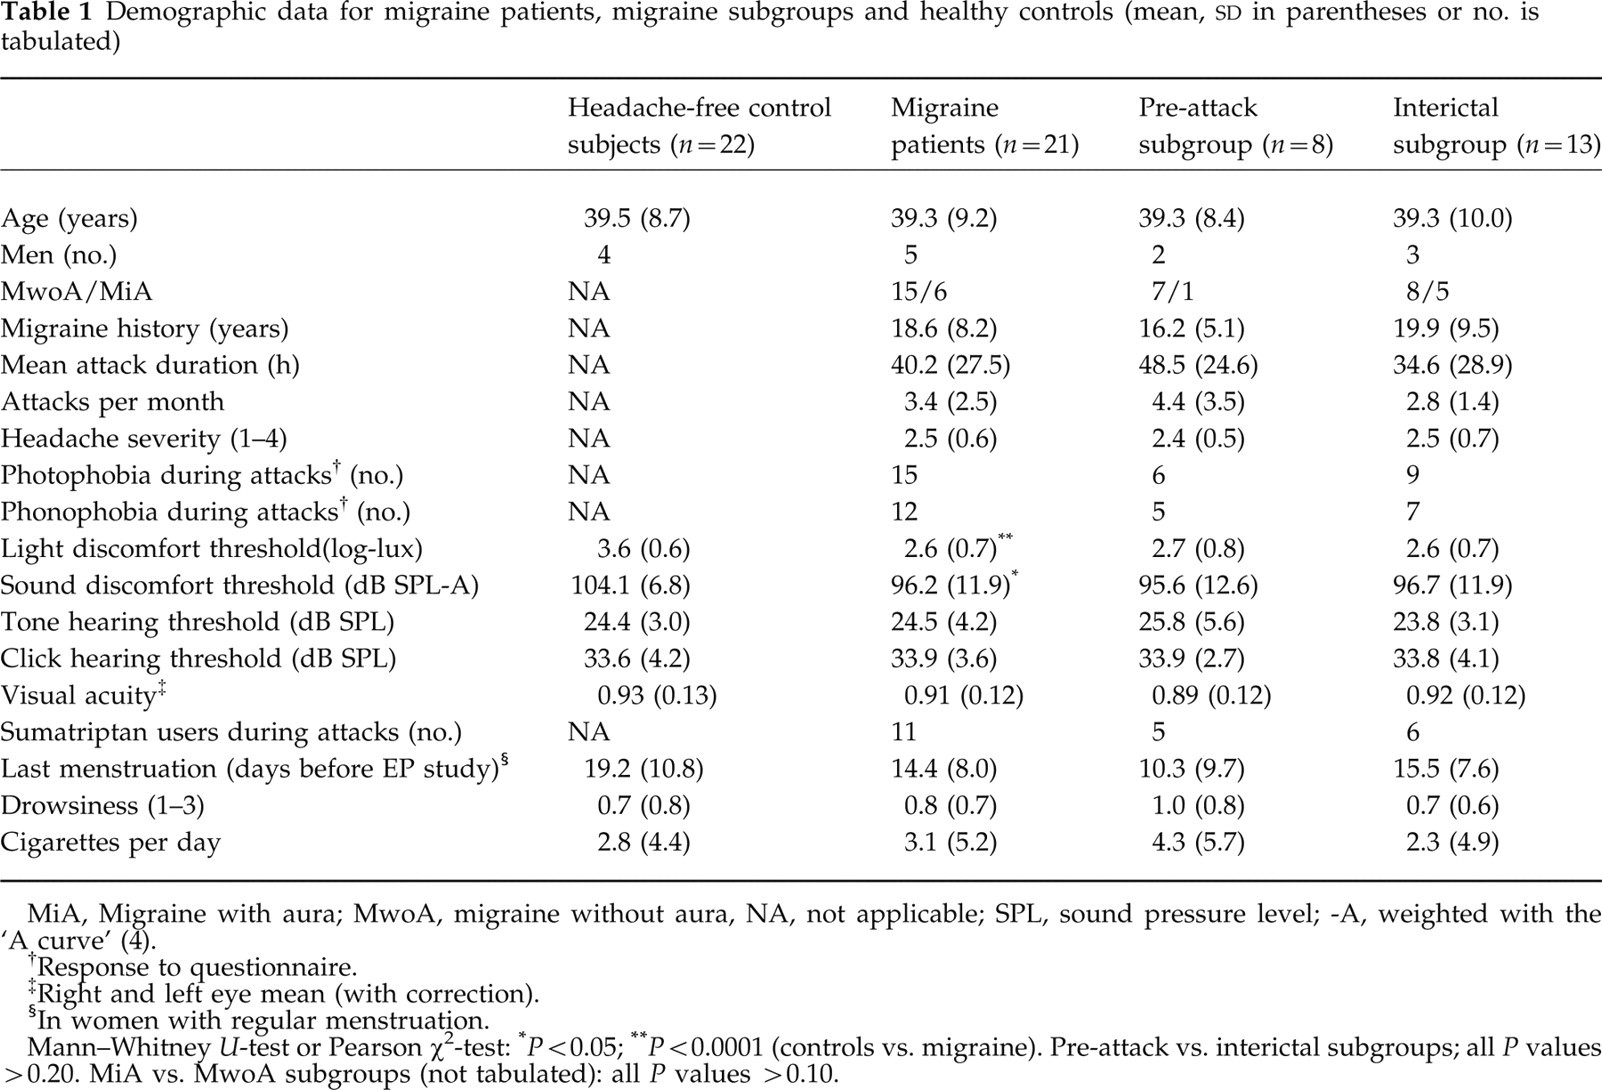
MiA, Migraine with aura; MwoA, migraine without aura, NA, not applicable; SPL, sound pressure level; -A, weighted with the ‘A curve’ (4).
Response to questionnaire.
Right and left eye mean (with correction).
In women with regular menstruation.
Mann–Whitney U-test or Pearson χ2-test:
P < 0.05;
P < 0.0001 (controls vs. migraine). Pre-attack vs. interictal subgroups; all P values > 0.20. MiA vs. MwoA subgroups (not tabulated): all P values > 0.10.
Patients responded to a structured interview before and after the test. Visual acuity was measured on Snellen's chart. The usual headache intensity was estimated by the patient on a four-point scale from mild to excruciating. On the test day, headache intensity was reported both before and after the test on a visual analogue scale (VAS; range 0–100%). The last migraine attack was at least 72 h before the EP study. A mailed questionnaire about the time to the next attack was returned by 20 of the 21 patients. The first attack (in 16 patients) occurred with a median latency of 1 day (range 0–29 days, mean 5 days) after the test. Eight patients (‘the pre-attack subgroup’) had headache within 24 h after the test. Seven of the eight patients had migraine without aura, the median latency from end of examination to onset of headache was 2.8 h, and the latency range was 0.5–18 h. The remaining 13 patients are referred to as ‘the interictal subgroup’ (Table 1). Seven of the interictal patients reported headache onset 3–30 days (median 5 days) after the examination.
The patients spent approximately 2 h in the laboratory. In order to control the possible effects of fatigue on the test results, subjective drowsiness was rated on a four-point scale before and after the test. Neither menstruation period, mean drowsiness, visual acuity, hearing thresholds or smoking differed between groups. Headache history was also comparable between subgroups (Table 1).
Psychophysical thresholds had been determined on the average 18 months (19.4 in controls, 17.5 in patients; range −4 to 38 months) prior to the evoked potential study (3, 4). Light and sound discomfort thresholds were significantly lower in migraine patients (Table 1) as reported previously (3, 4). The study was approved by the local ethics committee.
Methods
Recordings were made on Dantec Keypoint equipment from October 1997 to January 1998. VEP was elicited by monocular 33′ and 8′ TV-generated checkerboards with 2-Hz reversal rate in a dimly lit room. The screen covered 18° × 14° of the visual field and the contrast was 97%. A 2–200-Hz filter and 200 averaged sweeps (first block of 100 sweeps + second block 100 sweeps) was used. Midoccipital (Oz′) to midfrontal (Fz) derivation VEP was analysed in this study. Oz′ was defined to be 2.5 cm above the inion in the present study.
Individual binaural sensory thresholds to tones and clicks were determined for each subject and the stimulus was presented in decibels relative to threshold (dB SL). Auditory thresholds did not differ between groups. AEP was elicited by 40, 55, and 70 dB SL binaural 1000-Hz tones of 40 ms duration and 0.6 Hz repetition rate. A 1–200-Hz filter and 160 averages for each intensity (first block of 80 sweeps+second block 80 sweeps) were used. Mid-central (vertex) to left and right earlobe derivations (Cz-A1 and Cz-A2) were analysed. The subjects were asked to count the number of tones presented in order to keep arousal and attention stable throughout the procedure.
BAEP was elicited by 40, 55, and 65 dB SL binaural broadband rarefaction clicks of 0.2 ms duration and 10 Hz repetition rate. A 200-Hz to 2-kHz filter and 2000 averages (first block of 1000 sweeps + second block 1000 sweeps) were used. Cz-A1 and Cz-A2 derivations were analysed. (70 dB SL BAEP was recorded in two controls and three patients. The intensity was reduced to 65 dB because the higher intensity induced discomfort in some patients.)
Silver-chloride cup electrodes were used and the electrode-skin impedance was kept < 5 kΩ. Both the sequence of EP modalities and the order in which the different intensities (or check sizes) were presented were random. Large-amplitude artefacts were rejected on-line. EP was recorded and analysed by T.S., who was blind to clinical information and diagnosis.
The methods for light and sound discomfort thresholds have been described in detail previously (3, 4). Light intensity was varied in steps (2 s stimulus duration) from 50 to 23 000 lux, and the light source was a 800-W Ianebeam halogen lamp (3). Five thresholds were determined for the right, left and both eyes. One mean threshold (in log lux) was computed for analysis in the present study. The sound stimulus was a 200-Hz square wave of 2 s duration presented by TDH39 headphones varying from 67 to 113 dB SPL-A (4). Five thresholds were determined for the right, left and both ears. One mean threshold (in dB SPL-A) was computed for analysis in the present study.
Data analysis
EP amplitudes were measured separately for the first block and the second block of the acquisition period. AEP N1 and P2 peaks with maxima in the 80–130 ms and 130–250 ms ranges, respectively, BAEP vertex-positive waves IV and V, and vertex-negative VN peaks with peaks in the 4–7 ms range, and VEP N70, P100, and N145 peaks with maxima in the 50–80, 80–120, and 120–200 ms ranges, respectively, were identified manually. VEP amplitude was defined as mean of N70-P100 and P100-N145 peak-to-peak amplitudes. The average amplitudes from right and left eyes were used in the analysis. BAEP amplitude was defined as the difference between the highest of vertex-positive waves IV or V and negative wave VN. AEP amplitude was defined as N1-P2 peak-to-peak amplitude. For AEP and BAEP we used mean of Cz-A1 and Cz-A2 amplitudes in the statistical analysis. Individual BAEP and AEP amplitude intensity stimulus function (least-square) slopes (ASF slopes (15, 18)) were also calculated.
Repeated measures
Another post hoc
P< 0.05 was considered to be significant. Demographic variables were compared with Mann–Whitney U-tests or Pearson χ2-test (Table 1). The power to detect an effect equal to 90% of the population
Results
EP amplitudes in controls and migraine patients are shown in Table 2. One control subject had the VEP (and BAEP 65 dB block 2) recording removed from analysis because of technical failure. VEP amplitude did not differ between migraine and control subjects (Table 2,
Amplitude variables for visual evoked potentials (VEP), auditory evoked potentials (AEP) and brainstem auditory evoked potentials (BAEP) in migraine and control subjects

VEP (right and left eye average): check size 8 and 33 min of arc. AEP: binaural 1000 Hz tone stimuli; BAEP binaural clicks. Intensity levels in decibel sensory level (dB SL).
Subgroup of migraine patients who experienced a migraine attack within 24 h after the test: post hoc contrasts (Mann–Whitney U-test).
Migraine patients vs. controls.
Pre-attack vs. interictal subgroup.
Amplitude vs. intensity slopes (ASF) for AEP and BAEP.
AEP amplitude was similar in migraine patients and controls (Table 2,

Individual visual evoked potential (VEP) amplitude–checksize curves, long-latency auditory evoked potential (AEP) and brainstem auditory evoked potential (BAEP) IV–V wave amplitude–stimulus intensity curves in healthy headache-free controls (CO) and migraine patients (MIG). Linear regression lines are included. Intensity is in dB sensory level (SL) (tones for AEP, clicks for BAEP). Visual check sizes are 8′ and 33′, respectively. Amplitudes have been averaged across the first and second block.
BAEP wave IV–V amplitude did not differ between migraineurs and controls (Table 2,
Mean amplitudes for the first and the second block are displayed in Table 3. VEP habituation was not significant (
Visual evoked potential (VEP), auditory evoked potential (AEP) and brainstem auditory evoked potential (BAEP) amplitude habituation: comparison between the first and second blocks
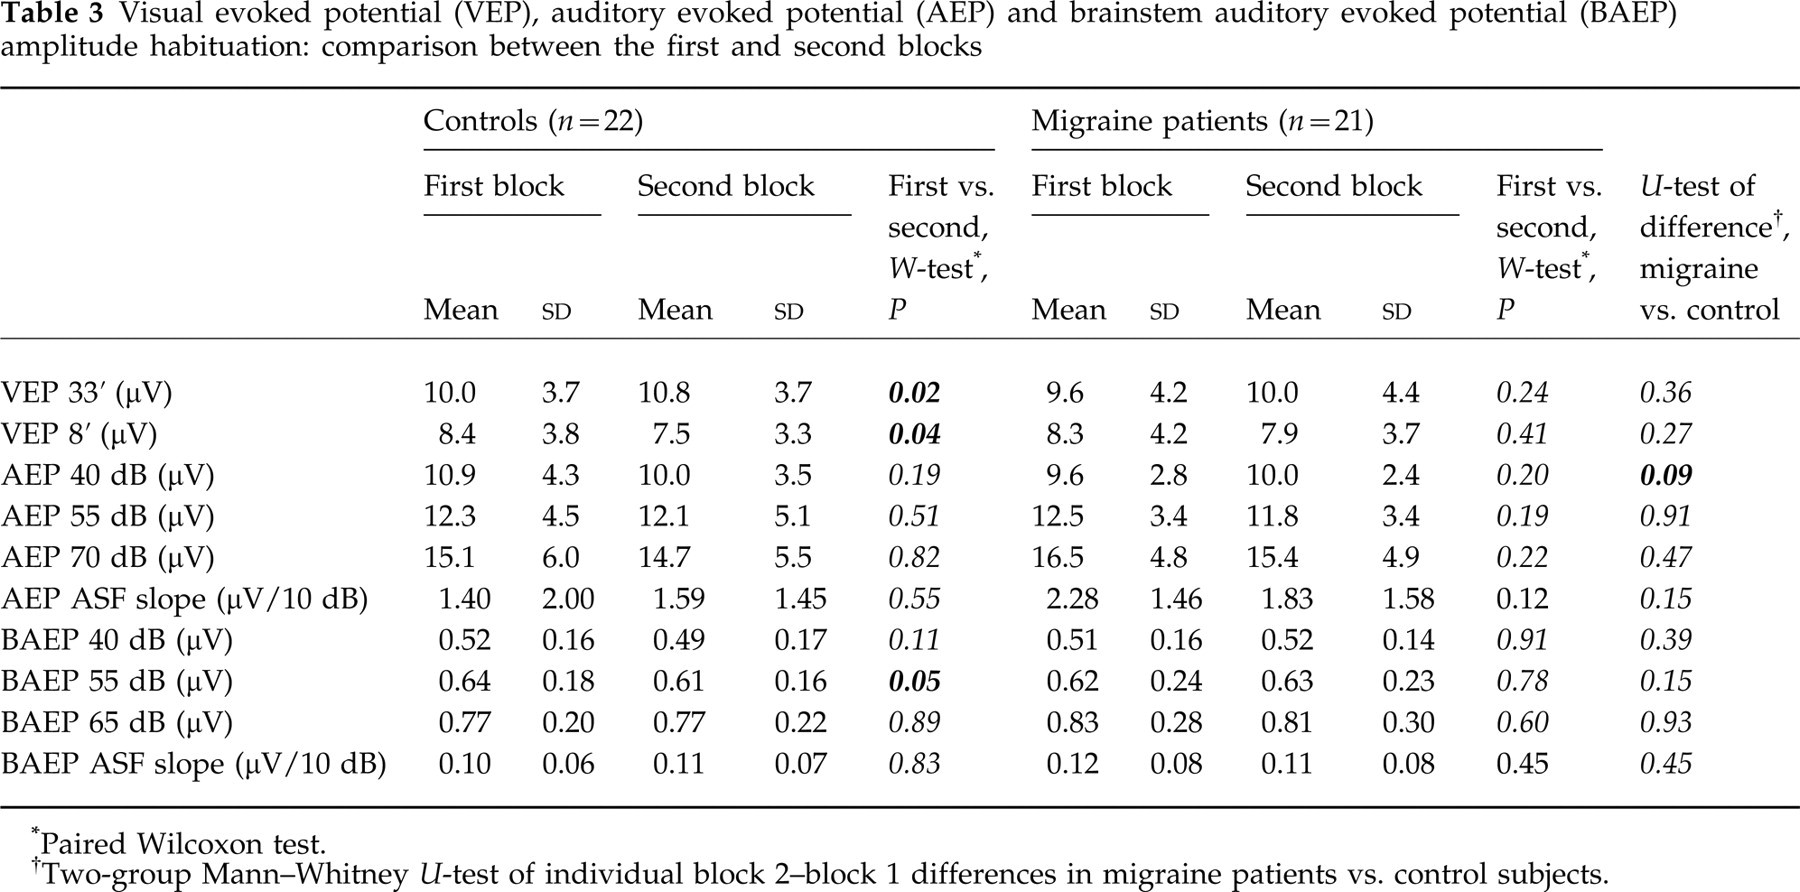
Paired Wilcoxon test.
Two-group Mann–Whitney U-test of individual block 2–block 1 differences in migraine patients vs. control subjects.
A non-significant trend towards habituation of BAEP amplitudes was seen (lower amplitude in the second block,

Individual amplitude habituation curves for cortical visual evoked potential (VEP), cortical auditory evoked potential (AEP) and brainstem auditory evoked potential (BAEP) in healthy controls (CO) and migraine patients (MIG). Block 1 (first half of stimulus sequence) and block 2 (second half of stimulus sequence) for individual subjects are shown (first and last 80 responses for long-latency AEP, first and last 1000 responses for short-latency BAEP, first and last 100 responses for VEP). AEP and BAEP have been averaged across stimulus intensities and VEP amplitudes have been averaged across check sizes 8′ and 33′. Linear regression lines are included.
BAEP wave IV–V habituation, expressed as the block 2–block 1 amplitude difference (Fig. 3), tended to vary with sound discomfort threshold (
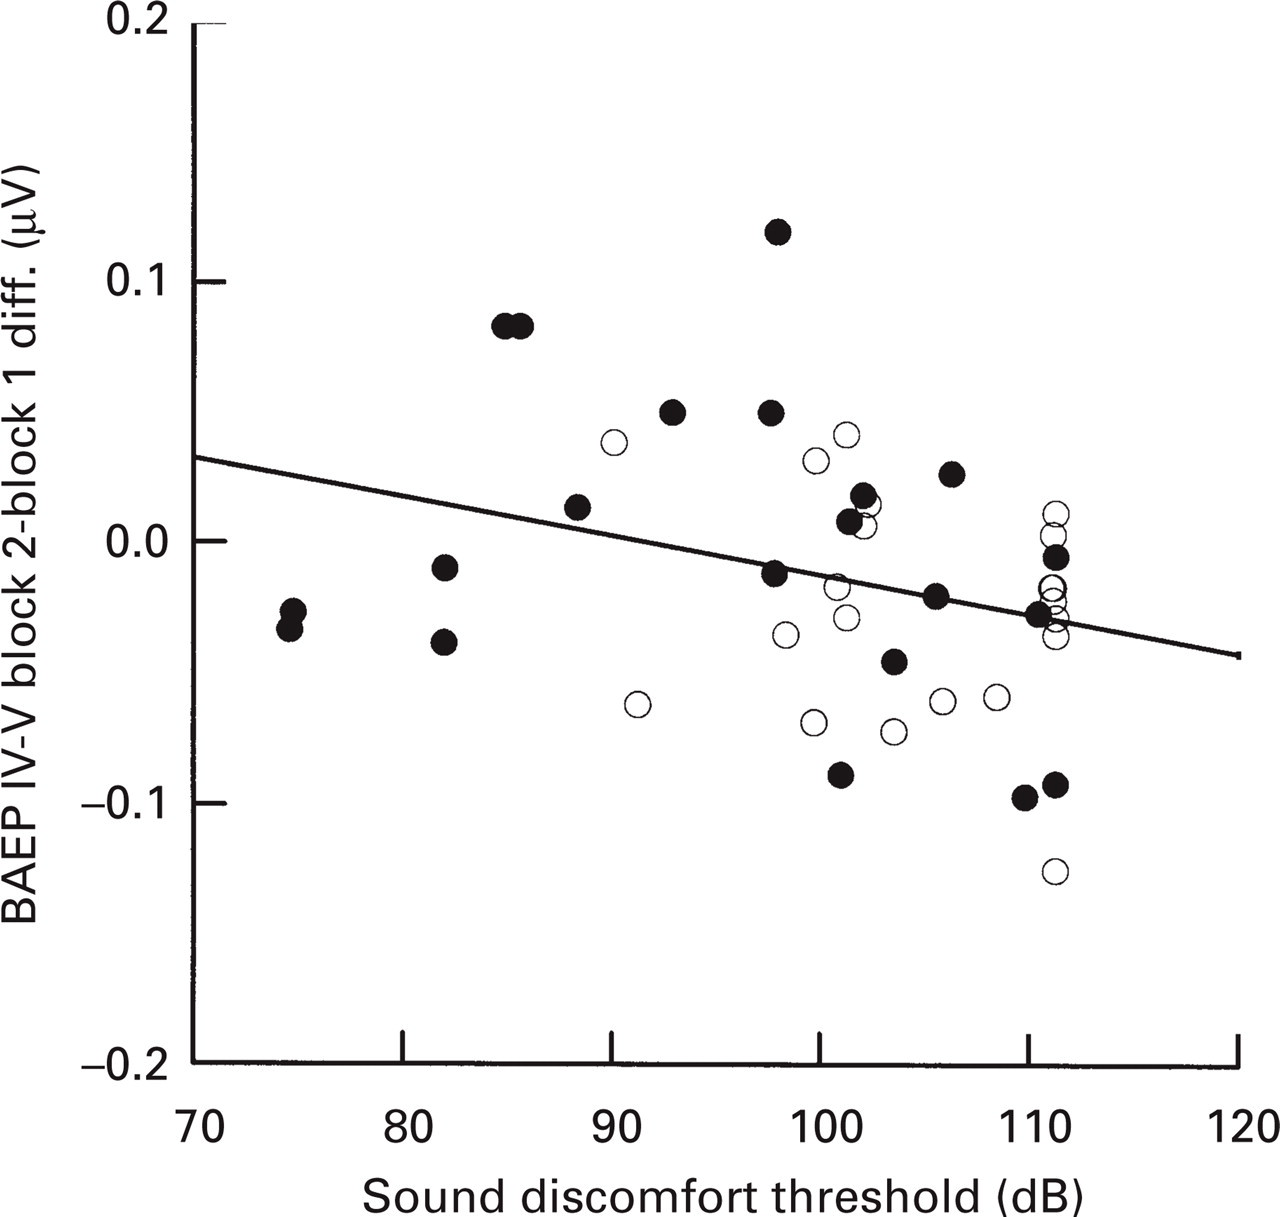
Brainstem auditory evoked potential (BAEP) wave IV–V habituation is defined as the amplitude difference between the second block of 1000 averaged responses minus the first block of 1000 averaged responses. Negative values reflect habituation. The mean amplitude across the three stimulus intensities has been used. Loss of BAEP habituation is associated with hypersensitivity to sound stimuli (Pearson r =−0.30, P = 0.05). •, Migraine patients; ○, healthy controls. Linear regression line (patients and controls combined) is included.
Habituation trends were not significant for AEP (
No differences were found between migraine with and without aura either for VEP, AEP, or BAEP amplitudes. In migraine patients, no significant correlation was found either between light discomfort thresholds and VEP amplitudes or between sound discomfort thresholds and BAEP or AEP amplitudes. Migraine history duration, mean attack duration, headache severity, and days from last menstruation did not affect amplitudes, habituation or ASF slopes (Pearson correlation).
VEP habituation to 8′ checks was seen in the preattack subgroup (Table 4, mean amplitude 8.1 μV in first block and 6.5 μV in the second) compared with the interictal subgroup (mean 8.4 μV in first block and 8.8 μV in the second). The block × check-size × subgroup interaction F(1,19) was 6.6 (P = 0.02) and the habituation was significantly different between subgroups in non-parametric post hoc analysis (P = 0.01, Table 4). VEP block 2–block 1 amplitude differences for 8′ checks were significantly different between the control group and the interictal subgroup (P = 0.02), while no amplitude habituation difference was found between the pre-attack subgroup and the control group (P = 0.35). Habituation trends were not observed for 33′ checks (Table 4).
Evoked potential (EP) amplitude habituation: first and second block values in migraine pre-attack and interictal subgroups

Paired Wilcoxon test.
Two-group Mann–Whitney U-test of individual block 2–block 1 differences in pre-attack migraine patients vs. interictal migraine patients.
The pre-attack subgroup also tended to have increased BAEP amplitude vs. stimulus–intensity steepness (Fig. 4,

Migraine patients in both panels. Brainstem auditory evoked potential (BAEP) wave IV–V amplitude–intensity functions are steeper in the subgroup of patients studied in the preattack phase, i.e. patients who had their next migraine attack within 24 h after the examination.
No correlation was found between VEP and BAEP, VEP and AEP, or AEP and BAEP parameters. AEP ASF slopes were not correlated to BAEP ASF slopes (Table 5) and we found no correlation between low-intensity (40 dB) EP and ASF slopes (Table 5). ASF slopes did not correlate with habituation variables except for one significant negative correlation between AEP 55 dB habituation and ASF slope (r =–0.47, P = 0.03) in control subjects.
Correlation between auditory evoked potential (AEP) and brainstem auditory evoked potential (BAEP) amplitudes and amplitude–intensity function (ASF) slopes (Pearson correlation coefficients)
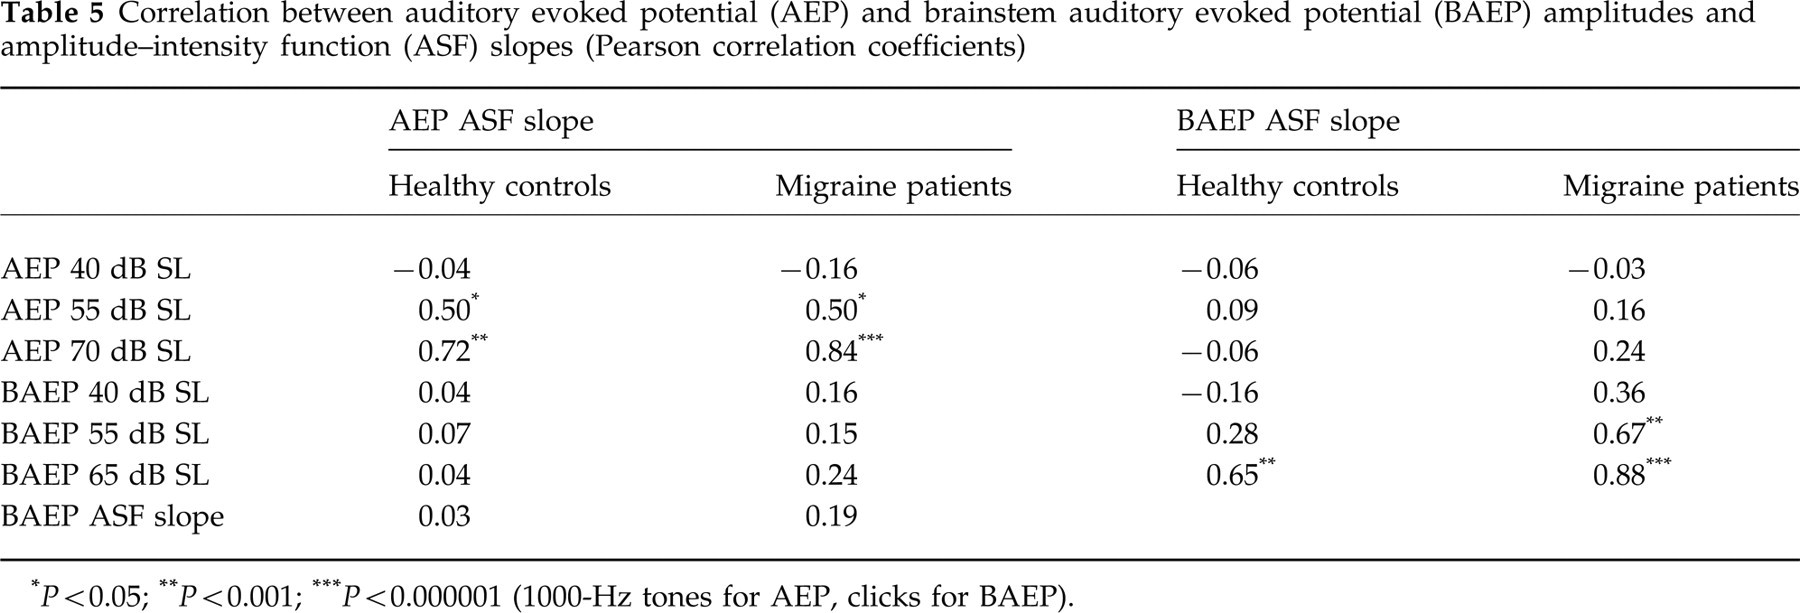
P < 0.05;
P < 0.001;
P < 0.000001 (1000-Hz tones for AEP, clicks for BAEP).
Discussion
VEP amplitudes
Are VEP amplitudes increased in migraine patients? A review of previous studies using patterned checkerboard stimuli (Table 6) disclosed that several earlier studies were negative (14, 31–36) in concert with the present results, while others found increased midline VEP amplitudes (37–41) (Table 6). Reduced amplitude of lateral VEP components, generated in the hemisphere responsible for visual aura, has been described (35, 40). P100 latency evaluations have also yielded inconsistent results (37, 38, 42, 43). Different stimulus parameters have been used previously (Table 6) and this may explain some of the variability in previously reported results.
Pattern reversal visual evoked potential (VEP) studies of migraine patients in the headache-free interval

MwoA, Migraine without aura; MiA, migraine with aura; TH, tension-type headache; HA, non-migrainous headache; CO, healthy controls; ME, migraine equivalents; P1, P100; N1, N70; N2, N145; TIA, transitory vertebrobasilar ischaemic attacks.
Mean age (or range) for patients. Check angle = 60 × ′cpd/(2√2) (45).
Binocular, monocular, full-field and half-field.
Oz, 10/20 system or 2.5 cm above inion; 5 cm above inion, LO/RO: 5 cm lateral to MO. F'z: 12 cm above nasion, Oz: 5% above inion, O1′, O2′, 5 cm lateral to Oz.
VEP amplitude potentiation, or reduced habituation, may be a finding more specific to migraine (12, 25, 44). It should be noted that our group recently reported psychophysical support for this concept as we found a gradual reduction in discomfort thresholds to bright light stimuli in migraine patients and in control subjects (3). This increasing sensitivity (or potentiation), interpreted as possible ‘central fatigue’, was of slightly greater magnitude in migraine patients than in headache-free control subjects.
In the present study we were not able to replicate the recent results regarding VEP potentiation in migraine, but we observed an interesting response difference related to check size. The control group did in fact show significant potentiation with medium sized checks, while habituation was observed with the small check stimulus. A partly similar result was reported in a recent study in which VEP habituation in migraine was investigated with four different check sizes (0.5, 1, 2 and 4 cycles per degree); a trend towards habituation was observed with small checks both in migraine and control subjects (14). In concert with this result, we found no significant differences when habituation was compared statistically between migraine patients and controls, either for small or medium checks.
A significant 8′-stimulus VEP amplitude difference was found when the preattack subgroup was compared with the interictal subgroup (Table 4). Interestingly, habituation was observed in the former subgroup. It may accordingly be hypothesized that reported lack of VEP habituation in migraine depends both on stimulus spatial frequency and on the migraine cycle. A longitudinal study might clarify this question. A practical drawback with the 8′-check stimulus is that it evoked very low VEP amplitudes in some control and migraine subjects.
Why did we not find similar control group habituation with the 33′ check stimulus? While larger check stimuli mainly activate the magnocellular (Y) motion/luminance channel, smaller checks also activate the parvocellular (X) contrast/contour type visual channel (45), and it is probable that habituation is more closely related to the latter visual pathway (14). Ôelkers et al. (14) found increased N2 latency in VEP evoked by small checks in migraine and they attributed this finding to a Y system predominance in the migraine interval.
It could also be argued that the stimulus sequence was too short-lasting (< 2 min per eye). Indeed, in another recent study where the authors used a stimulus sequence lasting 15 min, they found that the lack of migraine habituation was most pronounced from the third 1-min block to the end (Figs 2 and 3 in (13)). On the other hand, habituation differences have been detected as early as 30 s after stimulus onset (12) and the habituation difference is clearly seen even in the second 1-min block (13). Another possible explanation is that we used a slightly lower reversal rate (2 Hz) compared with 3.1 Hz in some previous publications (12, 13). Lastly, a type II error should be considered because rather few subjects were included, but we did not even observe a trend towards 33′ VEP habituation, in fact a slight potentiation was seen (Table 3).
There are some additional methodological drawbacks with long-lasting sessions because visual evoked potential amplitudes are sensitive to drowsiness and to muscular artefacts. In one study controlled for drowsiness by measuring the reaction time (46), VEP amplitude seemed to increase from the first to the second 2-min block in eight healthy subjects. Amplitude reduction was evident later in the 16-block experiment (Fig. 4 in (46)). It is our experience that blocks with as few as 40–50 averaged responses may contain a significant amount of artefacts and activity unrelated to the stimulus in some subjects. In this situation it may be difficult to identify reliable component peaks within blocks. We would accordingly stress the need for blinding both during recording and analysis in order to avoid potential bias. Most previous VEP studies were indeed not blinded (Table 6).
BAEP amplitudes
BAEP amplitudes have apparently not been studied previously in migraine, although amplitude and dispersion variables seem to be sensitive measures of brainstem dysfunction (21). BAEP wave IV–V amplitude increases almost linearly with increasing stimulus intensity (in dB) (47) and some saturation is observed with high intensities (48). BAEP waves may reflect serotonergic as well as cholinergic activity in the brainstem. Rat BAEP wave III and IV amplitudes decrease following serotonergic (22) and increase after cholinergic (muscarine receptor) activation (49).
BAEP latencies seem to be normal in the headache-free phase (24, 50), although increased asymmetry has been reported (51). Latency abnormalities have also been reported during basilar migraine (52) and reserpine-induced headache attacks (24).
We did not find overall group wave IV–V amplitude differences in the present study. On the other hand, BAEP habituation was observed in controls but not in patients, and habituation tended to correlate with sound discomfort threshold. Although the direct statistical comparison of BAEP habituation in migraine patients and controls failed to reach significance, this result may suggest that subcortical pontomesencephalic structures are involved in migraine, because wave IV–V has its generators mainly in the lemniscus lateralis and colliculus inferior (53). Based on the present results, it may also be hypothesized that increased sensitivity to sound stimuli, and phonophobia, partly depend on reduced inhibition in pontomesencephalic auditory pathways.
Involvement of brainstem structures in migraine is to some degree supported by the trend towards increased BAEP amplitude–intensity slope in the subgroup of patients who were recorded shortly before a headache attack (Fig. 4). The nature of the EEG changes (5) and recent PET studies (23) do also suggest a brainstem and midbrain dysfunction in migraine.
We used rarefaction clicks, but condensation click-evoked BAEP changes may be less influenced by cochlear disorders (54). It might be worthwhile to explore the utility of BAEP further by repeating the study with condensation clicks and measure the wave IV–V ‘shape ratio’, a parameter that reflects brainstem synchronization (21). BAEP amplitudes IV–V were not related to menstrual cycle in this study, in agreement with recent results (55). BAEP wave V and III–V latency and wave I and III amplitude were found to decrease across the cycle however (55).
AEP amplitudes
We found no differences between controls and migraine patients regarding the amplitude–intensity relationship of long-latency AEP in the present study. Although mean slopes were higher in patients than controls (Table 2), the difference was far from being significant. AEP amplitudes as such were previously found to be non-significantly lower in 30 migraine without aura patients than in healthy controls (61), but no such trend was observed in the present study.
One AEP study reported that the ASF slope differences seem to be caused by a lower AEP amplitude to the low-intensity (40 dB SL) stimulus in migraine compared with healthy controls (15), but this has not been confirmed, either by the present results (Table 2) or in another recent AEP study (56). We found AEP ASF slopes to depend mostly on the response amplitude at the higher intensities (Table 5). Increased ASF slopes in migraine without aura children and adults were found in the latter partly blinded study (56). Click-evoked AEP ASF slopes were higher in Chinese migraineurs without aura than in healthy controls according to another recent non-blinded study (57).
AEP ASF repeatability is rather low (58). A type II error should be considered as an explanation to our negative result because more than 150 subjects in each study group are needed to detect really small population mean differences (e.g. in the magnitude of 0.3
AEP amplitude–intensity function slopes in healthy subjects were, in concert with previous results (e.g. Fig. 5 in (60)), clearly more positive (mean 1.5 μV/10 dB) in the present study than the 40–70-dB slope reported in one much cited study (0.07 μV/10 dB) (15). Higher mean control subject ASF slopes have more recently been published, i.e. 0.36 μV/10 dB (17), 0.78 μV/10 dB (1.34 in children) (56), 0.89–1.07 μV/10 dB (59) and 0.34–1.09 μV/10 dB (58). A possible explanation may relate to the actual shape of the ASF. The method preferred by most authors in this field (15, 18, 56, 58, 59) assumes that the ASF is linear, which may not be true (60). If the curve saturates at a low intensity, i.e. around 50 dB SL, linear ASF slopes will be slightly lower when four levels (40, 50, 60 and 70 dB) are used for the calculation compared with three levels used by ourselves (40, 55, and 55 dB), but this factor can only explain a small part of the observed discrepancy. The inter- and intra-individual variation of AEP ASF slopes is substantial (15, 58), but the calculated 95% confidence intervals of ASF slope means fail to overlap in several studies (e.g. 15, 58). Thus, there seem to be unexplained sources of variance related to the methods of AEP ASF slope analysis used to date. Different equipment may possibly explain some of the discrepancy, and these factors should be identified if this type of analysis is going to be useful in future headache studies.
EP amplitudes related to visual and auditory discomfort thresholds
We found no consistent relationship between subjective individual sound and light discomfort thresholds and ‘objective’ cortical EP amplitude measures, either for VEP or for AEP. Interpretation has to be cautious, because the stimuli we used to measure discomfort thresholds (bright light of 2 s duration, 200 Hz sound of 2 s duration) differed from the stimuli used in EP studies (transient patterns, 1000-Hz tones, clicks) and also because the sample size was too small to rule out small effects. If we accept the notion that EP amplitudes reflect (or depend on) the number of simultaneously active cortical neurones in the primary and secondary visual and auditory cortex (62), high amplitudes may reflect low levels of cortical inhibition (e.g. giant somatosensory evoked potential (SEP) in myoclonic epilepsy (63)). The present results are compatible with the hypothesis that increased sensitivity to light and sound (1–4), as well as phonophobia and photophobia, are not exclusively caused by cortical potentiation or disinhibition.
It has been shown that spatial and temporal detection responses are lost in migraine (64). This was interpreted as dysfunction of both magnocellular (Y) and parvocellular (X) visual pathways, a result which may suggest a precortical dysfunction in migraine (64). Retinal function seems to be normal in migraine (41), retinal ganglion cells do not habituate to prolonged 1 Hz flash stimulation in rabbits (65), but habituation was clearly shown to take place in thalamus and visual cortex (65). It is tempting to speculate that hypersensitivity to light in migraine may depend on potentiation or disinhibition in the visual thalamic relay station lateral geniculate nucleus, or in the parallel visual pathway from retina to pretectum and colliculus superior. To some extent, this hypothesis is compatible with the demonstration of superior ‘low level’ visual processing in migraine patients compared with control subjects (66).
Similarly, it may be hypothesized that hypersensitivity to sound also may be related to disinhibition at a subcortical level, e.g. in the important auditory relé nucleus of the brainstem, the colliculus inferior, or in the medial geniculate nucleus of the thalamus. The relatively high BAEP ASF slope in the preattack subgroup is compatible with disinhibition in auditory relé nuclei at the colliculus inferior level.
Phonophobia is seemingly not related to cochlear dysfunction because loudness recruitment has not been found (1). Some patients have increased hearing thresholds during the attack however (1, 67), and it is the thresholds to low-frequency sounds that are mostly affected, similar to the pattern which is typical for Menière's disease (67). We found normal (binaural) 1000 Hz tone and click detection thresholds in our interictal patients however. BAEP is generally normal in Menière's disease (54) because it is the sound energy in the 2–4-kHz band that is most important in the generation of the brainstem potentials.
Positional nystagmus (86%) and low-frequency hearing loss (80%) were the most prevalent findings in an uncontrolled study of 50 patients with basilar migraine (68). The sympathetic innervation of the inner ear may possibly be involved (68). It is difficult to interpret these slight vestibular and auditory dysfunctions because basilar migraine and Menière's disease may coexist and because CNS lesions also may cause audiometric loss. How basilar migraine relates to migraine with and without aura regarding pathophysiology is also uncertain.
Could the long time interval between the EP study and the discomfort threshold study explain the low correlation between psychophysical thresholds and EP parameters? This part of our study design is not ideal, but it is probably acceptable because phonophobia and photophobia seem to be rather constant from one attack to another in the same patient, at least based upon a clinical impression. A longitudinal measurement of visual and auditory discomfort thresholds has not been done. Some authors suggest that duration of the migraine history may influence VEP (34, 41), a result we were unable to verify. In principle it is an advantage to measure all relevant parameters simultaneously.
Cognitive ERP in migraine
A number of studies have reported changes in cognitive event-related potentials (ERP) in migraine. Increased CNV amplitude in migraine patients (69), particularly on the day before the attack (27), has been reported. Loss of visual and auditory P300 habituation has also been reported in migraine (11, 70), but cognitive processing abnormalities were not found in one recent study (71) and the validity of the reported electrophysiological deviations in migraine remains to be proven. Cognitive evoked potentials have more complex generators than the sensory evoked potentials we have studied (72), and it is accordingly uncertain to what extent the results from primary sensory modality EP studies can be compared to cognitive ERP study results. Recent studies report ERP deviations related to the migraine cycle which, if replicable, may shed considerable light on migraine pathogenesis (see below).
EP amplitudes and the migraine attack cycle
Recent evidence in the literature suggests that the time interval to the next attack influences electrophysiological CNS dysfunction. This relationship has been shown for EEG α rhythm variability (28, 73), VEP amplitude (26), CNV amplitude (27, 73, 74), and cognitive P300 latency habituation (75). We confirmed a similar relationship regarding BAEP wave IV–V amplitude intensity dependence and 8′ VEP amplitude habituation in the present study. We found that VEP 8′ habituation (presumably reflecting a normalization of this inhibitory process) coexists with increased BAEP ASF slope (presumably reflecting hyperexcitation or loss of inhibition) in the pre-attack period. It may be speculated that brainstem activation coexists with (and possibly causes) visual cortex (or thalamic) inhibition in the pre-attack period. One transcranial magnetic stimulation study found evidence of hypo-excitability in the affected motor cortex in familial hemiplegic migraine (76). Other studies that use transcranial magnetic stimulation of visual and/or motor cortex in migraine are inconclusive; hypo-excitability (77), hyperexcitability (78), or no differences (79) are reported. Perhaps the time interval to the next attack, if recorded, could have explained the reported differences?
The increased CNV amplitude found on the day before the attack was interpreted as a sign of changed cortical excitability, possibly an adaptive process to control brainstem intrinsic hyperactivity (27). The authors propose, based on CNV amplitude rhythmicity, that a migraine attack may be possible every 3 days. Such a cyclic nature of excitation/inhibition might also explain why as many as eight of 21 migraine patients happened to have their next attack within 24 h after the examination in the present study. Possibly, the (moderately stressful) EP procedure was capable of triggering the attack in those patients who happened to be studied within a susceptible phase.
While loss of normal P300 latency habituation (i.e. potentiation) was found up to 1 day before a migraine attack, normal habituation seemed to reappear on the attack day (75). Apparently, no P300 amplitude habituation was found in the latter, partially blinded, study. In addition, P300 latency was significantly shorter on the day before the attack than on the attack day (75). In the present study, we observed ‘normal’ VEP 8′ amplitude habituation in patients studied within the time window 0.5–18 h before the next attack. This subgroup may have entered the ‘attack state’ with a normalized cortical habituation and, presumably, coexisting brainstem hyperreactivity. However, it is far from clear how P300 latency relates to CNV and VEP amplitude.
A generally changed CNS excitability in migraine?
A general hypothesis has been proposed to explain increased AEP ASF slopes and EP habituation as a consequence of low serotonergic brainstem ‘state setting’ and low levels of cortical preactivation in migraine (16). Serotonin did not seem to be involved in cognitive P300 latency habituation, although platelet serotonin correlated negatively with P300 latency in migraine (75). No effect of the 5HT1B/1D agonist zolmitriptan on P300 latency was observed in healthy volunteers, however (80). A recent study reported negative correlations between initial VEP amplitude and subsequent amplitude increase, and a negative correlation between AEP 40 dB amplitude and ASF slope (17). These results seem to be supportive of the concept of low cortical preactivation in migraine, but the findings were not replicated in the present study either for AEP (see above) or VEP. We found no trend towards lower VEP amplitudes in the first block in migraine patients compared with controls (Table 3).
The lack of correlation between EP parameters between different modalities confirms recent results (17). EP excitability parameters (amplitude, habituation, ASF slopes) seem to reflect sensory modality-specific parts of the neuraxis. Our results do accordingly not add support to the concept of a generalized across-modality brain state (or reactivity) in the migraine interval, at least not one that can be measured by sensory cortical EP amplitudes. This conclusion is in concert with the modality specificity that has been observed regarding evoked potential ‘augmenting/reducing’ (26).
Increased brainstem excitability modulated by serotonergic neurones in migraine?
The trend towards increased BAEP ASF slope is compatible with a concept of variable brainstem excitability throughout the attack–interval cycle. Several observations in the literature suggest that serotonin might modulate this excitability. BAEP latency was found to increase more with decreasing stimulus intensity after serotonin depletion in a primate study (81), and this result suggests that serotonin may exert a tonic facilitation on the brainstem auditory pathways. Reserpin-induced serotonin depletion was found to prolong BAEP latency in migraine patients (24). Serotonin seems to regulate AEP intensity dependence (18). When a 5-HT1A receptor agonist was injected into the dorsal raphe nucleus in cats, cortical AEP intensity dependence decreased (82). The inferior colliculus, the main generator for BAEP wave V, also receives serotonergic input from the dorsal raphe nucleus. Although serotonin depresses tone-evoked single unit firing in a majority of bat colliculus inferior neurones, a significant proportion of neurones increased their firing rates and the response to more composite frequency-modulated stimuli was even more evenly distributed between inhibition and excitation (83). Effects of 5HT1B/1D receptor agonists on AEP ASF slopes in control subjects and migraine patients have been described in the literature, but the results do not agree between studies (59).
It is accordingly probable that serotonergic neurones can modulate auditory responsiveness both in colliculus inferior of the brainstem and in the primary auditory cortex. The dorsal raphe nucleus may be a common source of this modulation, but the regulation system may be complex and dynamic, influenced by arousal, attention, the menstrual cycle and, in patients, the migraine cycle. The thalamus may also be involved. It is still not clear if (or how) habituation, and amplitude–intensity function slopes are physiologically related. The low correlation that we found between habituation response measures in the different modalities and ASF slopes suggests that the interdependence is rather weak.
Concluding remarks
Our results may suggest that VEP habituation/potentiation state and brainstem activation state depend on the migraine attack–interval cycle. Our results also seem to support the notion that pattern VEP habituation/potentiation depends on the type of visual subsystem which is preferentially activated, the magnocellular/luminance and motion sensitive system or the parvocellular/contrast and colour sensitive system. Colour vision system function should also be examined more closely (84) and one recent small study suggests that VEP habituation in healthy controls is reversed by red glasses (85). Phonophobia and possibly photophobia may depend more on subcortical function than on cortical mechanisms. BAEP amplitudes may reflect serotonergic activity in the brainstem and further studies may possibly shed more light on the hypothesized brainstem hyperexcitability related to phonophobia in migraine. We could not confirm the existence of a generalized low cortical preactivation state in migraine, at least not reflected in EP amplitudes. The results of our EP habituation and ASF analysis seem to suggest that CNS state changes, to the extent that they can be measured with primary sensory EP amplitudes, are preferentially modality-specific.
Confirmatory studies are obviously needed. The electrophysiological differences between migraine patients and headache-free subjects are probably small compared with other types of variability in the response parameters. Such variability may stem from various sources (complex overlapping EP generators with overall non-linear stimulus–response characteristics, variable gyral anatomy, subject selection bias, different stimulation and recording parameters, affective state and personality (57, 86), migraine type, possible uncontrolled nicotine and caffeine effects, sleep–wakefulness cycle, and migraine cycle). It may be time to consider more joint efforts (58, 59) in order to design and perform blinded longitudinal multicentre studies in large randomly selected patient and control samples.