
Abstract
Among the few independently replicated genetic associations in migraine are polymorphisms in the methylenetetrahydrofolate reductase (MTHFR) and oestrogen receptor (ESR1) genes. We studied the contribution of these genes to migraine susceptibility by genotyping six MTHFR and 26 ESR1 polymorphisms in 898 unrelated migraine with aura (MA) patients and in 900 unrelated healthy controls. There were no differences in the genotype distributions of the previously migraine-associated SNPs C677T (MTHFR) and G2014A (ESR1) between cases and controls (P-values 0.83 and 0.55, respectively). Thus, we were not able to replicate the previous findings, although our study had considerable power. However, five of the ESR1 SNPs (rs6557170, rs2347867, rs6557171, rs4870062 and rs1801132) that were in strong linkage disequilibrium were nominally associated with MA (uncorrected P-values 0.007-0.034). These results did not, however, remain significant after taking multiple testing into account. Thus it seems unlikely that the studied genes are involved in migraine susceptibility, at least in this sample.
Keywords
Introduction
Migraine is a common, disabilitating neurological disorder characterized by recurrent attacks of typically severe, pulsating and unilateral headache and associated symptoms such as nausea, vomiting and photo- and phonophobia (1). Twin and family studies have provided strong evidence of genetic susceptibility factors in migraine, especially in the less common subtype of migraine, migraine with aura (MA), with a population prevalence of approximately 5% (2–4). This type of migraine is characterized by the neurological, typically visual symptoms that precede headache (1). The mode of inheritance of MA is most likely multifactorial, with both multiple gene variants and environmental factors contributing to the liability (3). This complexity has made the identification of the underlying genetic factors difficult. Although several whole-genome scans and candidate locus studies in families segregating MA have provided significant evidence of linkage to several loci (4q21–24, 11q24, 15q11-q13 and 19p13), the corresponding susceptibility genes have not yet been identified (5–8).
Since positional cloning of complex disease genes is not as straightforward as had been hoped, an alternative study design, called the candidate gene strategy, has become popular. This study design is always based on hypothesis that the candidate gene is involved in the disease pathophysiology, with the restriction that our understanding of these processes is relatively limited. One of the advantages of this strategy is that unrelated cases can be used instead of families with multiple affected individuals, which makes patient recruitment typically easier (9). A substantial number of genetic association studies on migraine have been published, but most of these have tested only one or two polymorphisms per candidate gene and have had limited power due to small patient samples. Furthermore, confirmatory replication studies are rare.
Methylenetetrahydrofolate reductase catalyses the reduction of 5,10-methylenetetrahydrofolate to 5- methylenetetrahydrofolate. A common polymorphism, C677T (Ala222Val), within this gene has been shown to decrease the enzyme activity and homozygous individuals for this variant have mild hyperhomocysteinaemia (10). The initial association of the C677T (Ala222Val; dbSNP rs1801133) polymorphism of the methylenetetrahydrofolate reductase gene (MTHFR) with MA was reported in a Japanese population and subsequently replicated in Turkish, Australian and Dutch populations (11–14). Furthermore, in a Spanish study the homozygous T677 genotype was shown to be more common in MA patients than in migraine without aura (MoA) patients (15). The sample sizes of all these studies were modest, as shown in Table 1. Migraine has also been associated with variants in several hormone receptors (16, 17). Recently, the G2014A variant (dbSNP rs2228480) of the oestrogen receptor gene ESR1 located on chromosome 6q25 was reported to be associated with migraine susceptibility in the Australian population (18). In this paper, the result was also replicated in an independent case–control sample. Subsequently, the effect of the ESR1 G2014A variant on migraine susceptibility was reported to be modulated by an insert variant in a progesterone receptor gene (16). This association of oestrogen receptor gene polymorphism with migraine is particularly interesting because it has been argued that the additional trigger of the fluctuating female hormones of the menstrual cycle could be related to the known female preponderance among migraine patients (2, 19). Furthermore, migraine attacks related to menstruation are very common and thought to be associated with the falling concentrations of oestrogen (19). Pregnancy, oral contraceptives, menopause and hormone replacement therapy also commonly affect the course of migraine and thus speak for the importance of hormonal factors in this disease (19).
MTHFR gene association studies of migraine

MA, Migraine with aura; MoA, migraine without aura; HA, tension headache; NA, not available.
All cases compared with controls.
MA cases compared with MoA cases.
The MTHFR and ESR1 genes are good functional candidate genes for migraine. The initial positive associations have been replicated either by other groups or in independent sample sets. Thus, it was intriguing to study the allelic distribution of these genes in a considerably larger case–control sample than used so far.
Materials and methods
Subjects
The study population consisted of 898 unrelated migraine patients and 900 unrelated migraine-free controls. Cases were mainly selected from our large collection of MA families recruited since 1996 from four headache clinics situated in different parts of Finland (Helsinki, Turku, Jyväskylä and Kemi) and using advertisements in the newsletter of the Finnish Migraine Society. The recruitment of the families is described in more detail elsewhere (8). Most of the selected patients are index cases of the families. However, to increase the number of cases, affected spouses were also included. In addition, from bi-linear pedigrees (when, for example, both the mother and the father of the index case were affected), two genetically unrelated patients were selected instead of the index case. A third of the cases (n = 279) originated from a Finnish cohort of same-sex twin pairs born before 1958 (20). Only one individual of each twin pair was eligible as a case. We have previously described the clinical characteristics of migraine in 805 twins belonging to this cohort (21). Of the patients, 718 (80.0%) were women, reflecting the typical gender bias in this disease. Furthermore, all cases had a family history of migraine. All individuals were of Finnish origin and represented no specific sub-isolate. Table 2 summarizes some demographic factors of the cases divided by the source of subjects.
Demographic factors of the case and control groups
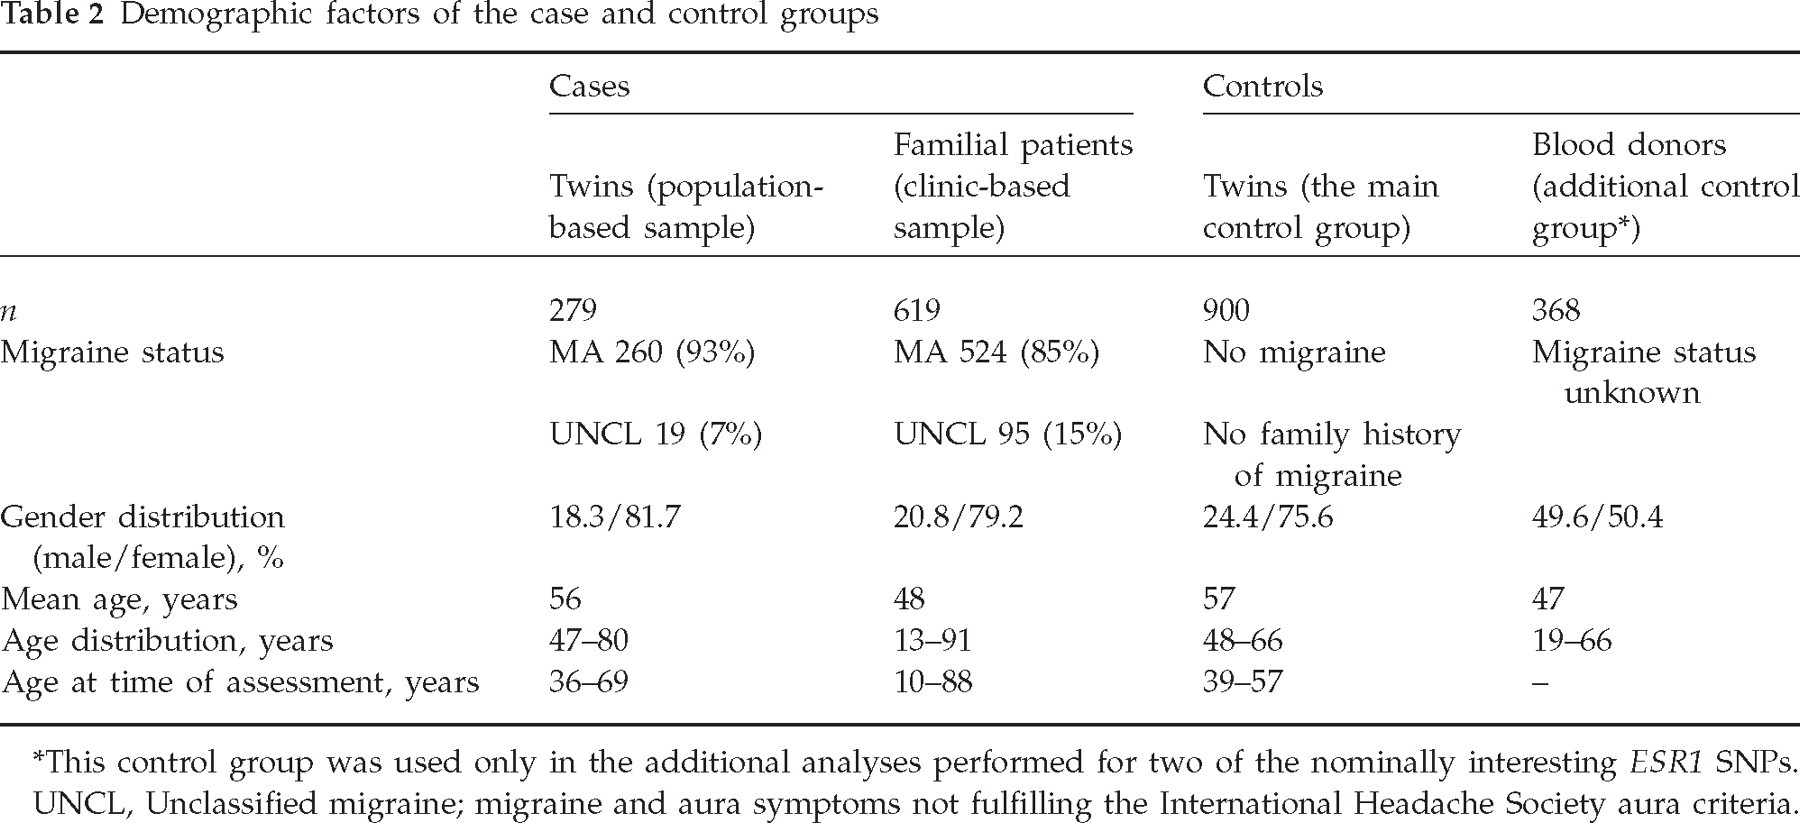
This control group was used only in the additional analyses performed for two of the nominally interesting ESR1 SNPs.
UNCL, Unclassified migraine; migraine and aura symptoms not fulfilling the International Headache Society aura criteria.
Diagnosis was based on the validated Finnish Migraine-Specific Questionnaire for Family Studies (22). All 898 patients had aura symptoms before their migraine headache. In 784 patients (87.3%), these aura symptoms fulfilled the International Headache Society (IHS) criteria for MA (1), while the remaining 114 patients (12.7%) were classified as having migraine and aura symptoms not fulfilling the IHS aura criteria. The headache phase of all patients met the IHS criteria for migraine headache. Unless otherwise stated, MA refers always to this broader definition in this study.
The controls were selected from a Finnish twin-cohort of opposite-sex pairs born from 1939 to 1957. During the years 1996–1997 these twins had answered to a comprehensive questionnaire covering many diseases, one of them being migraine. To minimize the genetic risk factors for migraine, individuals comprising the control group of this study self-reportedly: (i) did not have migraine, (ii) their co-twin did not have migraine and (iii) their other first-degree family members did not have migraine. In most cases, responses from both twins were available, thus increasing the reliability of the answers. Only one subject from each pair was selected so that the sex distribution of the controls (76% women) was matched to that of the cases. The demographic factors of the controls are summarized in Table 2.
Based on the initial results, we genotyped 368 additional controls for some of the most interesting SNPs. These controls were Finnish blood donors and their migraine status is unknown.
The Ethics Committee of the Helsinki University Central Hospital approved the study protocol and informed consent was obtained from each participant.
Genotyping
We investigated two genes previously associated with MA, namely MTHFR encoding the methylenetetrahydrofolate reductase and ESR1 coding for the oestrogen receptor type 1. Instead of studying only the previously migraine-associated polymorphisms, we wanted to cover the entire genes including 5′- and 3′-flanking areas. SNPs distributed in and around these genes were chosen from the public dbSNP database (http://www.ncbi.nlm.nih.gov/projects/SNP/) (23). Information about the validation status, minor allele frequency and gene structure were used for selecting the SNPs. MTHFR is localized to chromosome 1p36 and the 12 exons of this gene span only ∼19 kb. Seven SNPs within this gene were selected for genotyping. The ESR1 gene consists of eight exons spanning >200 kb. We aimed at covering this gene with evenly spaced SNPs with a frequency of approximately one SNP every 10 kb and thus overall 31 ESR1 SNPs were selected for genotyping.
Genomic DNA was extracted from whole blood according to standard procedures. SNP genotypes were determined in a 384-well format using the Homogenous MassExtend MassARRAY system (Sequenom, San Diego, CA, USA) in which the distinction between genotypes is based on the mass differences between the primer extension products of the two alleles. Assays were designed using the AssayDesign software (Sequenom); primer information is available from the first author upon request. The multiplex polymerase chain reaction and primer extension reactions were performed under standard conditions according to the manufacturer's instructions using 9 ng of DNA as a template.
Statistical analysis
Genotype distributions were tested for Hardy–Weinberg Equilibrium. LD measures (D′ and r 2) were determined using Haploview software (24). Power calculations were performed using a program developed by Purcell et al. available at http://statgen.iop.kcl.ac.uk/gpc/cc2.html (25). Allele and genotype distributions between cases and controls were compared using standard χ2 analyses. For the five most interesting ESR1 SNPs, logistic regression analysis was applied to calculate odds ratios (OR) for the individuals with one and two copies of the minor allele (compared with those having none). Alternatively, the subjects carrying two copies of the minor allele were compared with all the other subjects. SPSS program version 12.0 was used in these analyses (SPSS Inc, Chicago, IL, USA).
Haplotypes formed by five ESR1 SNPs providing nominal evidence of association when analysed individually were reconstructed with PHASE software (26) and the haplotype association analysis was performed using the Haplo-assoc program developed by V. Ollikainen and available at the Centre for Scientific Computing in Finland (http://www.csc.fi). This program uses the data-mining approach to find all haplotypes that occur in the data and tests their statistical significance by χ2 test.
Results
Power calculations
We calculated the power of our sample size to replicate the associations of MTHFR C677T and ESR1 G2014A SNPs with MA. MA disease prevalence of 5% was assumed (2). In the case of MTHFR C677T, the OR for the homozygous MTHFR T677T genotype in the previous studies was estimated to be at least 2.3 (Table 1). Assuming a somewhat smaller figure, OR 2.0, and a minor allele frequency of 0.24 as found in our study, our sample provided ∼84% power to reject the null hypothesis at the P = 0.05 level. In the case of the ESR1 G2014A variant, an OR of 1.8 in carriers vs. non-carriers was assumed (previously reported OR 1.96). Using a minor allele frequency of 0.20 as seen in our sample, our sample provided >99% power at the P = 0.001 level.
Genotyping
Of the 38 SNPs, none was monomorphic but eight assays did not provide reliable genotype calls and were thus eliminated. Thus, genotype results were obtained from six MTHFR and 24 ESR1 SNPs (Table 3), altogether comprising over 53 000 genotypes. The average success rate of accepted assays was 98.6%. Each 384-well had 16 duplicate samples and no discrepancies were observed among the duplicates, indicating high genotyping quality. The accepted assays had minor allele frequencies of 10–45%. All but two of the genotyped SNPs were in Hardy–Weinberg equilibrium (HWE): rs746432 was not in HWE among patient samples (P = 0.029), although it was among control samples (P = 0.29). Similarly, rs3853248 genotype distribution was consistent with HWE in controls (P = 0.17), but not in patients (P = 0.0025). These SNPs are located at the beginning of the ESR1 gene and separated by approximately 10 kb. Careful examination of the genotyping results did not reveal any genotyping errors. However, several potentially heterozygous genotypes had been rejected because of their weak allele heights, providing a possible explanation for the observed HWE violation. On the other hand, since 30 SNPs were genotyped, a small number of HWE failures is expected by chance alone. The two SNPs that were not in HWE among patient samples did not show any association with migraine in this or the previous studies, the deviation thus being of minor importance.
Genotyped SNPs, their allele and genotype frequencies and the corresponding P-values (a more detailed table showing allele frequencies by subgroups is available online)

Nt, Nucleotide; aa, amino acid; MAF, minor allele frequency; CI, confidence interval.
The genotype frequencies do not necessarily sum up exactly to 1 due to rounding.
Linkage disequilibrium analysis
Within both studied genes, marker–marker linkage disequilibrium (LD) measures, D′ and r 2 were computed. The pairwise D′ results produced by the Haploview program are presented graphically in Fig. 1. Several regions of high LD were identified within the ESR1. Of the six genotyped MTHFR SNPs, most were in complete or near complete LD according to D′ measures, while the pairwise r 2 values varied between 0.02 and 0.99.

Structure of the ESR1 (a) and MTHFR (b) genes, location of the studied SNPs and the intermarker linkage disequilibrium (LD) plot. D′ values are shown. If there is no number inside the box, the pairwise D′ value is 1.
Association studies
The allele and genotype frequencies of the studied SNPs in patients and controls are summarized in Table 3, together with the corresponding uncorrected P-values and ORs for minor alleles. There were no differences between the MA patients and controls with regard to allele and genotype frequencies of the MTHFR SNPs. Furthermore, no association of MA with the ESR1 G2014A SNP was seen in our study. However, nominal evidence of association was detected for five other ESR1 SNPs (rs6557170, rs2347867, rs6557171, rs4870062 and rs1801132) located within a 62-kb region in the intron 3 and exon 4 of ESR1, 155–217 kb from the G2014A variant. The pairwise linkage disequilibrium of these markers is shown in Table 4. The observed allele frequency differences of these five SNPs produced P-values of 0.008–0.067 (OR 1.15–1.21). When the genotype distributions were used, the corresponding P-values were 0.007–0.034 (Tables 2 and 4). These results do not, however, remain significant if a conservative Bonferroni correction for multiple testing is performed. Since some of the SNPs were in high LD, we also applied a method developed by D. Nyholt (27) to estimate the actual number of independent tests we should be correcting for. The studied 30 SNPs were shown to be equivalent to 18 independent tests. If we correct our most significant result of 0.007 by multiplying it with 18, the result does not remain significant (0.007 × 18 = 0.126).
Linkage disequilibrium values of the five ESR1 SNPs showing nominal evidence of association
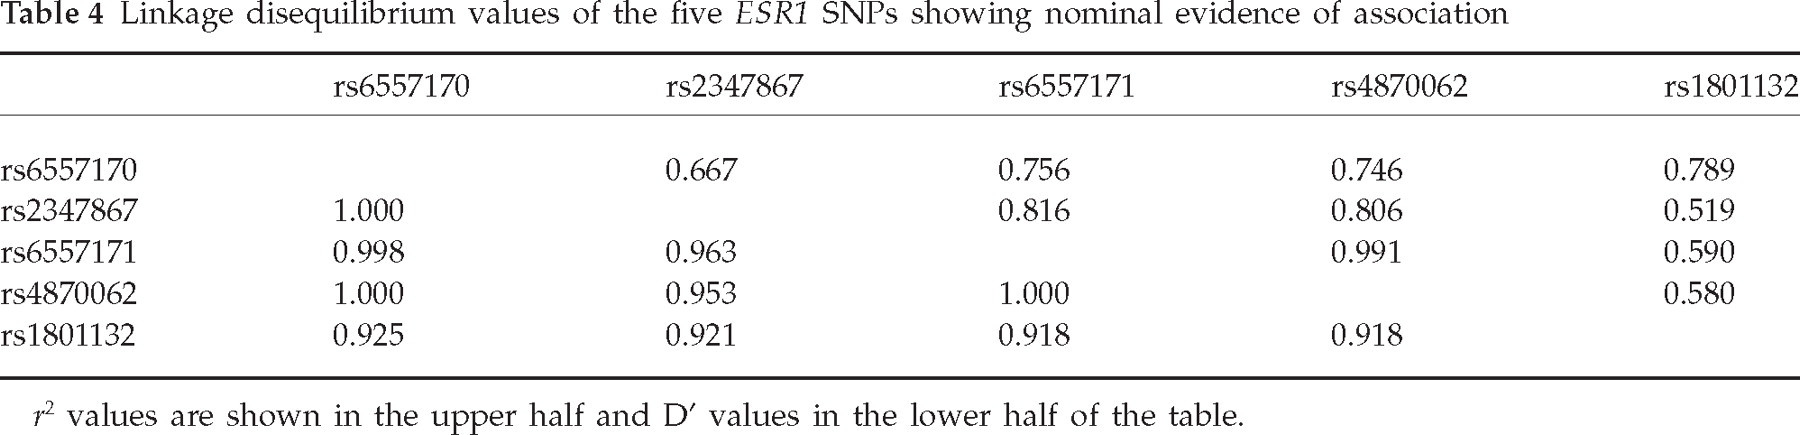
r 2 values are shown in the upper half and D′ values in the lower half of the table.
In addition to the standard association analysis, some subgroup analyses were conducted: females only (n = 718), males only (n = 180) and the patients with the IHS MA diagnosis only (n = 784). Furthermore, we also performed an analysis where the youngest (<39 years) and the oldest (>57 years) of the patients were excluded so that the age distribution of the cases was matched to that of the controls (n = 619). These comparisons did not produce any new evidence of association (data not shown). The results of the subgroup analyses of the five ESR1 SNPs showing some evidence of association were in line with results using the broader MA definition, except the P-values produced by rs6557170 and rs1801132 were approximately halved (Table 5). Furthermore, the cases were separated according to the source of the subjects (headache clinics/population cohort). The five ESR1 SNPs showed association only when the controls were compared with the group of cases collected from the headache clinics (best allele frequency-based P-value 0.003 compared with P-values >0.25 when twin cases were used). On the other hand, another ESR1 SNP, rs1514348, gave a P-value of 0.0068 and two SNPs within MTHFR (rs2066470 and rs3753588) gave P-values of 0.02–0.03 when the group of twin cases was compared with controls. No other comparison produced P-values <0.05.
Results of the five ESR1 SNPs analysed more thoroughly

Individuals with the 2 2 genotype compared with all the others; HWE, Hardy–Weinberg equilibrium.
Results of the logistic regression analysis of these five SNPs provided no evidence of an additive genetic model since the ORs for heterozygous individuals (compared with those having no minor alleles) were very close to 1 (1.01–1.15). Thus the ORs shown in Table 5 were calculated so that the individuals with two minor alleles were compared with all others. SNPs rs6557170 and rs1801132 showed the strongest evidence of increased risk (OR 1.81).
Association analyses were also performed using haplotypes formed by these five ESR1 SNPs instead of single SNPs (Table 6). PHASE software gave a global P-value of 0.01 for the overall haplotype distribution. The most common haplotype, G,A,C,T,C, was under-represented among cases (P = 0.024) and the haplotype formed by the minor alleles over-represented (P = 0.016). However, none of the haplotype association P-values was more significant than those produced by single SNPs. This is not surprising given the high LD between the SNPs.
Haplotypes with estimated frequencies >1%

Because of the fact that five ESR1 SNPs produced borderline interesting P-values specifically when analysing the more severe group of migraineurs, we selected two of these interesting SNPs and genotyped them in a group of 368 additional Finnish blood donor controls. The allele frequencies and the corresponding P-values of these SNPs are shown in Table 7.
Association result comparison of two ESR1 SNPs after genotyping 368 additional blood donor controls

P-value A = compared with twin controls; P-value B = compared with blood donor controls.
Discussion
The aim of our study was to try to replicate previous positive association findings in migraine. Since matching the cases and controls as carefully as possible is crucial in association studies, we paid a lot of attention to the selection procedure. All the cases and controls were Finnish and did not represent any specific sub-isolate of Finland but were collected from all over the country. The sex distribution of the controls was matched to that of the cases. The mean age of both cases and controls was between 50 and 60 years. On the other hand, the age distribution of the cases at the time of assessment was 10–88 years while the age of the controls at the time of assessment was 39–57 years. However, since the population prevalence of migraine is so high, we felt that it was important to select controls that would have had time to develop migraine. In addition, when performing an association analysis where the youngest and the oldest patients were excluded, we were able to show that the age difference of the cases and controls did not seem to affect the results.
We were not able to replicate the previous association findings of the MTHFR C677T or the ESR1 G2014A genotypes with MA. These variants did not show any association with MA in any of the subgroup analyses performed. Since type II error is the primary concern in replication studies, we estimated the power of our sample size to replicate these associations. Our sample was well powered to detect association even assuming a somewhat smaller OR for the at-risk genotype than reported in the previous studies. However, the OR of 2 used could be argued to be too high as the initial positive studies often tend to overestimate the size of the genetic effect (28, 29). Furthermore, most meta-analyses of complex disease associations have produced ORs <1.5 (30). If this is the case with migraine also, our sample size of ∼900 patients might be too small. In any case, it is clearly the largest sample of MA patients genotyped in any of the published association studies on migraine and three to nine times the number of patients studied in the previous MTHFR publications (Table 1).
As shown in Table 1, the allele frequency of the MTHFR C677T allele is somewhat lower in our sample (0.24) than in the other populations studied, the exception being the Turkish sample. However, the allele frequencies of our study are in accordance with other studies performed in the Finnish population (31, 32). Furthermore, international variations in the frequency of this allele have been thoroughly studied and there is some evidence of a north-to-south increase in the frequency of the T677T genotype in Europe (33). Similarly, the allele frequency of the ESR1 G2014A variant was somewhat lower in our population (20%) than in that of Australia (24–28%). These allele frequency differences between populations might have an effect on the power of this study. However, when performing the power calculations we used the actual allele frequencies seen in the Finnish population and were able to show that the estimated effect sizes should be visible in our study material in spite of the lower allele frequencies.
In addition to inadequate power, variations in study design, e.g. testing of a slightly different phenotype or a nearby genetic variant, can produce false-negative replication results (34). Most of our patients (87.3%) strictly fulfilled the IHS criteria for MA. Excluding those patients not fulfilling the aura criteria (n = 114) from the association analysis had only a negligible effect on the results: the largest effect was seen on the P-values produced by markers rs6557170 and rs1801132, which were approximately halved (Table 5). In previously published MTHFR and ESR1 studies both MoA and MA patients were studied but the strongest evidence of association was always seen with the subgroup of MA patients. Thus it seems unlikely that our negative results would be due to a different phenotype. On the other hand, in the Spanish study the association with the MTHFR C677T SNP was seen only when MA patients were compared with MoA patients instead of healthy controls. Since our study did not include MoA patients, we cannot confirm or contradict this finding. Furthermore, since migraine is a complex disorder, it is possible that the end diagnosis MA actually comprises several phenotypic subtypes, thus adding heterogeneity and hampering the genetic analyses.
One possible explanation for our inability to replicate the previously reported association signals is that those associations could have been statistical fluctuations due to the small number of patients tested. Alternatively, some of the inconsistency of results can be explained by true variability between populations due to either different disease alleles specific to some ethnic groups or different effect sizes because of modifying genetic or environmental factors (34). Although Finland, due to its relative geographical isolation, has a specific genetic background of monogenic disease alleles (known as the Finnish disease heritage), no evidence exists of a similar effect in genetic factors predisposing to complex diseases. The extent of LD can also differ between populations (29). This is, however, relevant only when the causative variant is not directly studied, while the proposed model has been that the migraine-associated MTHFR and ESR1 SNPs are functional. This assumption is more justified in the case of the MTHFR C677T variant since it has been shown to reduce the activity of the enzyme. The potential functional effect of the ESR1 G2014A SNP is, however, still unknown and difficult to prove, since this SNP does not change the corresponding amino acid. Thus the possibility remains that the association signal reported by the Australian group may not be due to the G2014A variant itself, but to some other variant that is in LD with G2014A.
Interestingly, we saw nominal evidence of an association with five other ESR1 SNPs located at a distance of 155–217 kb from the G2014A variant. These SNPs were in LD with each other but not with the G2014A variant. Furthermore, one of these SNPs (rs1801132) was also genotyped in a breast cancer association study of the Australian group and shown not to be in LD with G2014A in this population either (35). Although it is possible that both these positive ESR1 association signals are due to some other variant that has not been genotyped in either of these studies, it seems unlikely that this variant could be in LD with both the G2014A variant and with the SNPs associated with migraine in our study. Since ESR1 is a large gene, it is possible that the SNP coverage used in our study was inadequate to represent every variant within ESR1.
To collect as much case–control material as possible for this study, we had to combine cases from two sources, namely from our large migraine families recruited from headache clinics and from a population-based twin sample. This is perhaps not the optimal way of collecting cases, since these two patient samples may differ regarding the severity of migraine. For this reason, we also analysed our results so that the two case groups were separated. The results turned out to differ somewhat depending on the case group used in the analysis. Interestingly, the five ESR1 SNPs showing the lowest P-values were associated with migraine only when the headache clinic-based population was compared with controls. To clarify this issue, we genotyped two of these SNPs in a group of 368 additional non-twin controls. When the cases were compared with this new control group, no P-values <0.05 were seen (Table 7). It seems that a 2% difference in the minor allele frequency of these SNPs between the two control groups was enough to diminish the association. Thus, these potentially interesting results are probably due to random statistical fluctuation of the allele frequencies.
We conclude that in the Finnish population, no evidence of association of MA with the previously reported MTHFR C677T and ESR1 G2014A variants was detected. We studied the largest sample of MA patients (n = 898) thus far, but despite this we were not able to see even a trend of association. However, if these SNPs have only a very weak positive effect on MA susceptibility, it is possible that even larger sample sizes or combined meta-analysis of all the available data are needed to detect association. On the other hand, five other SNPs located elsewhere in the ESR1 gene were nominally associated with MA in our study. However, these SNPs were in relatively strong LD with each other and the results do not remain significant when multiple testing is taken into account. Furthermore, genotyping two of these SNPs in a group of additional controls diminished the association. Thus it seems unlikely that the studied genes are involved in migraine susceptibility, at least in this sample.
Footnotes
Acknowledgements
This study was supported by the EU Eurohead (LSHM-CT-2004-504837), the EU GenomEUtwin project (QLG2-CT-2002-01254), the Helsinki University Central Hospital, the Academy of Finland (200923 to A.P.; 00213 to M.W.), the Sigrid Juselius Foundation, the Biomedicum Helsinki Foundation, the Finnish Cultural Foundation, the Maud Kuistila Foundation, the Finnish Neurology Foundation, the Farmos Science and Research Foundation, and National Institutes of Health (RO1 NS37675 to A.P.). Sara Fröjdö MSc is warmly thanked for her kind help with the PHASE and Haplo-assoc software and Verneri Anttila BM for his assistance with the multiple testing issue. We also thank Ms Tanja Moilanen for her expert assistance with contacting the families. We especially wish to thank the Finnish migraine patients for their devoted participation in this study.