
Abstract
Nociceptive mechanisms in the craniofacial muscle tissue are poorly understood. The pain pattern in individual pericranial muscles has not been described before. Experimental muscle pain was induced by standardized infusions of 0.2 ml 1 M hypertonic saline into six craniofacial muscles (masseter, anterior temporalis, posterior temporalis, trapezius, splenius capitis and sternocleidomastoid) in 20 healthy subjects. The pressure pain thresholds (PPTs) were determined before and after infusions. The subjects continuously reported intensity of saline-induced pain on an electronic visual analogue scale (VAS) and the perceived area of pain was drawn on anatomical maps. The pain areas were measured and the localization determined by a new centre-of-gravity method. The PPTs were lowest on the sternocleidomastoid muscle (ANOVA: P < 0.001), but the saline-evoked VAS pain scored highest following injection into the masseter muscle (ANOVA: P < 0.05). The centre-of-gravity measures demonstrated significantly different localization of the pain areas (ANOVA: P < 0.001). The trigeminally vs. the cervically innervated muscles had significantly different patterns of spread and referral of pain according to trigeminally vs. cervically innervated dermatomes (P < 0.005). In conclusion, there appear to be characteristic pain patterns and pain sensitivity in different craniofacial muscles in healthy volunteers, which may be of importance for further research on different craniofacial pain conditions.
Introduction
The pathophysiology of many craniofacial pain conditions such as tension-type headache (TTH), temporomandibular disorders (TMDs) and cervicospinal disorders is largely unknown despite intense research efforts (1–5). Nociceptive processes in craniofacial muscles are believed to play a role in development and maintenance of TTH (6, 7), but sensitization of neurons in the central nervous system may also be of major importance (1, 5, 8). Little is known, however, about differences in pain sensitivity and manifestations of pain in different craniofacial muscles. Mense and Simons (7) have suggested that focal tender points in the muscle tissue, the so-called trigger points, could be an important key to understanding the symptomatology of TTH. Manual palpation of craniofacial muscles in TTH patients has indicated differences in tenderness scores with high scores in the lateral pterygoid, sternocleidomastoid and trapezius muscles (9). The trapezius muscle appears to be the tenderest muscle to manual palpation in both healthy subjects and chronic TTH patients (8). However, manual palpation involves only a phasic stimulus (2–4 s) and the pain responses and patterns to more tonic muscle stimuli (>5–10 min), which may better mimic a chronic pain condition, have not yet been systematically described. Numerous techniques exist for experimental pain testing (10, 11), but in particular intramuscular infusions of hypertonic saline and other algogenic substances have been used to study somatosensory and motor manifestations of longer-lasting muscle pain (12–15). It is important that manual palpation includes stimulation of skin, muscles and underlying tissues, whereas intramuscular infusion of hypertonic saline affects only muscular tissue.
The first aim of the present study was to apply the validated and reproducible experimental technique with painful infusions of hypertonic saline into various craniofacial muscles to determine if there were differences between the muscles in the perceived intensity of pain and size and localization of area of perceived pain, and to determine the similarities, if any, to the general pain description of TTH. An additional aim was to test for correlations between PPTs and measures of the perceived pain intensity and area of perceived pain to clarify possible relationships between the combined afferent inputs from skin, muscles and underlying tissues (represented by the PPT) and more selective inputs from muscle afferents [represented by the visual analogue scale (VAS) pain scores]. These findings could contribute to the development of a standardized technique of experimental pain investigation in craniofacial pain conditions.
Methods and materials
Subjects
A total of 20 healthy volunteers (eight male and 12 female) with a mean age of 25.4 ± 5.6 (SD) years were examined in two sessions separated by about 7 days. The inclusion criteria were: headache ≤1 day per month on average during the last year, no persistent TMDs (16), no other chronic pain condition and no intake of analgesics during the last 72 h before the examinations. The allowed monthly 1 day of headache could be of any kind of headache, and no further interview was made about this or other headache conditions. Data from one muscle in a single subject were lost because of technical problems. The women were not tested in any particular phase of their menstrual cycle. None of the participants had taken analgesics within 48 h of the investigations. The same investigator (P.T.S-H.) examined all the subjects. The local Ethics Committee in Aarhus County approved the experiments and informed consent was obtained from all participants. The study was conducted in accordance with the Declaration of Helsinki.
Experimental design
The sequence and side of infusions into the six test muscles were randomized in the two experimental sessions in a balanced order. The sequence and side of infusions were written on cards, which the subjects drew before the first session. Individual subjects had all muscles examined on the same side. The experiments took place with the subjects in a semisupine position in a dental chair. First, the pressure pain threshold (PPT) in the test muscle was determined. Then the infusion of hypertonic saline was started, at the site where the PPT had been determined, and the subjects continuously reported the perceived pain intensity on a 0–10-cm VAS. Immediately after return of VAS pain score to 0, the PPT was again determined at the previously examined site, and the subjects drew the perceived area of pain on anatomical maps of the head and face. The same sequence was repeated after 15 min in the next test muscle on the same side. Three muscle sites were examined per session, which lasted about 1–1.5 h.
Infusion of hypertonic saline
The methodology has been described in detail previously (17, 18). In brief, infusion of hypertonic saline was done using a computer-controlled syringe pump (IVAC, model 770) with a plastic syringe. A tube (IVAC G30303, extension set with polyethylene inner line) was connected from the syringe to the stainless disposable needle (27 G, 40 mm). A total volume of 0.2 ml hypertonic saline (5.8% = 1
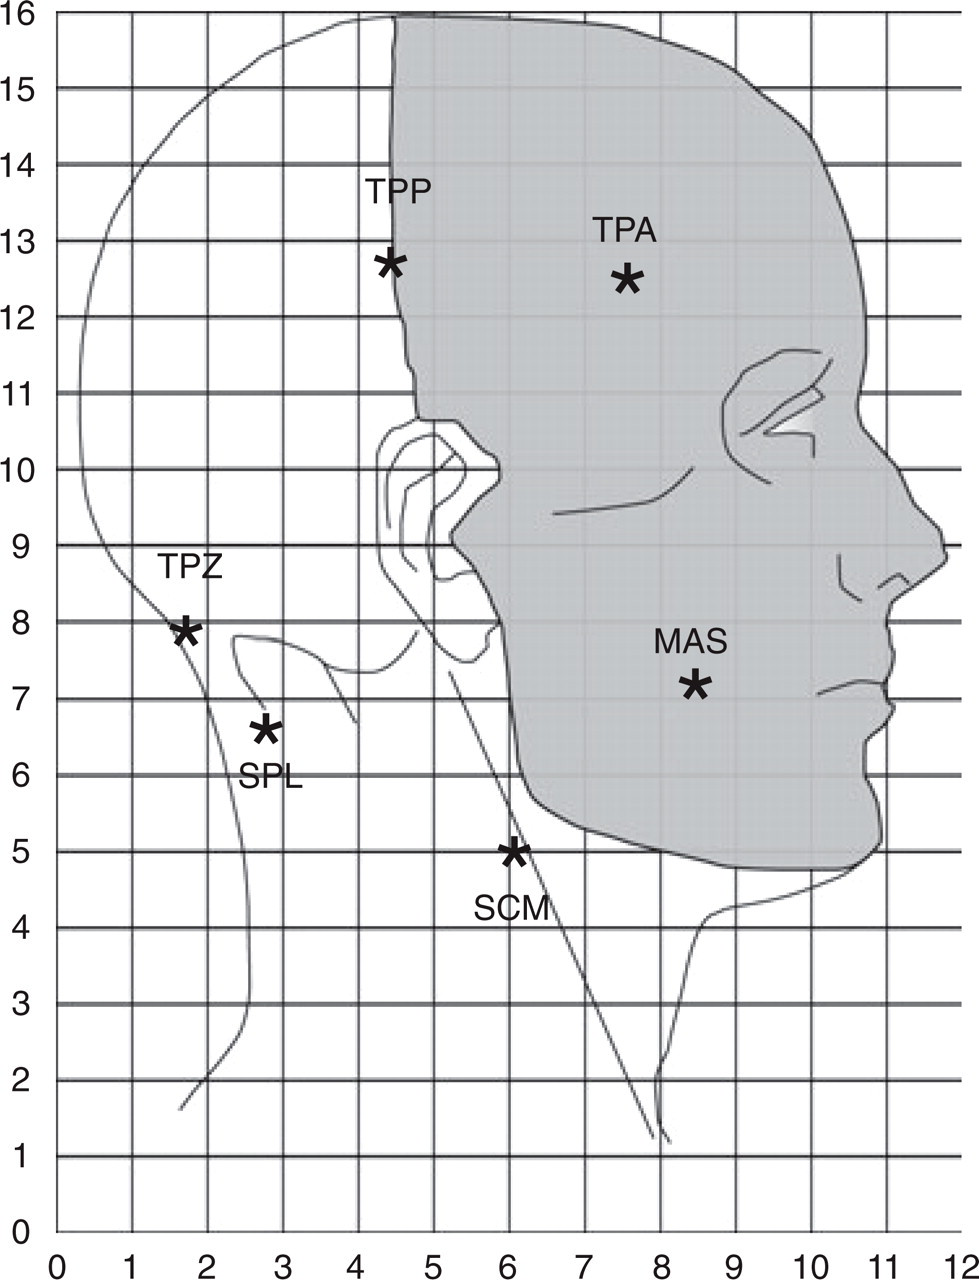
Subjects drew their perceived pain on standard anatomical maps. The coordinate system for the centre-of-gravity analysis and the marking of the trigeminal (grey) and C2-C3 innervated areas are shown. ∗Infusion sites. MAS, Masseter; TPA, anterior temporalis; TPP, posterior temporalis; TPZ, trapezius; SPL, splenius capitis; SCM, sternocleidomastoid.
Pressure pain thresholds
The PPT was defined as the amount of pressure applied by a handheld algometer (Somedic production AB, S-192♯05, Sallentuna, Sweden) that the subjects first perceived as painful, i.e. the transition from a feeling of pressure to a painful sensation (19). When a painful sensation was experienced the subjects pressed a button and the pressure value was stored on the display. The increase in pressure rate was manually controlled with use of visual feedback and aimed at 40 kPa/s. The area of the probe was 1 cm2. Measurements of PPTs were performed on maximally relaxed muscles perpendicular to the surface after careful palpations of the muscle. All PPT measurements were determined as the mean of three recordings with at least 30-s intervals.
Perceived pain intensity and area
The perceived pain intensity of the hypertonic saline infusions was scored on a 0–10-cm electronic VAS where 0 indicated ‘no pain’ and 10 ‘worst imaginable pain’. VAS data were sampled every 5 s and stored on a computer. The area under the VAS pain curve (VAS-AUC), maximum pain (VAS-peak), and onset and offset of pain were calculated from the VAS data. The subjects then drew the distribution of pain on anatomical maps of the lateral aspect of the head. The circumference was digitized with an ACECAD D9000+ digitizer and the area calculated in arbitrary units (Sigma-Scan, Systat Software, Inc., Point Richmond, CA, USA). Furthermore, the head was divided into areas innervated by the cervical (C2-C3) nerves and by the trigeminal nerves (V1, V2, V3) in accordance with standard descriptions (Fig. 1).
In order to make a quantitative estimate of the localization of the perceived pain area, a new technique was used. The centre-of-gravity (COG) has been used as a measure of the spatial extent of, for example, motor evoked potentials (20), but this technique has only recently been applied to pain maps (21). In the present study a grid with 5-mm resolutions, i.e. a total of 12 × 16 = 192 grids, was superimposed on the lateral pain maps and each grid in the coordinate system was assigned a value on a dichotomous basis (0 = no pain, 1 = pain) (Fig. 1). The COG coordinates (x = horizontal coordinate; y = vertical coordinate) in arbitrary units were calculated according to the formula:
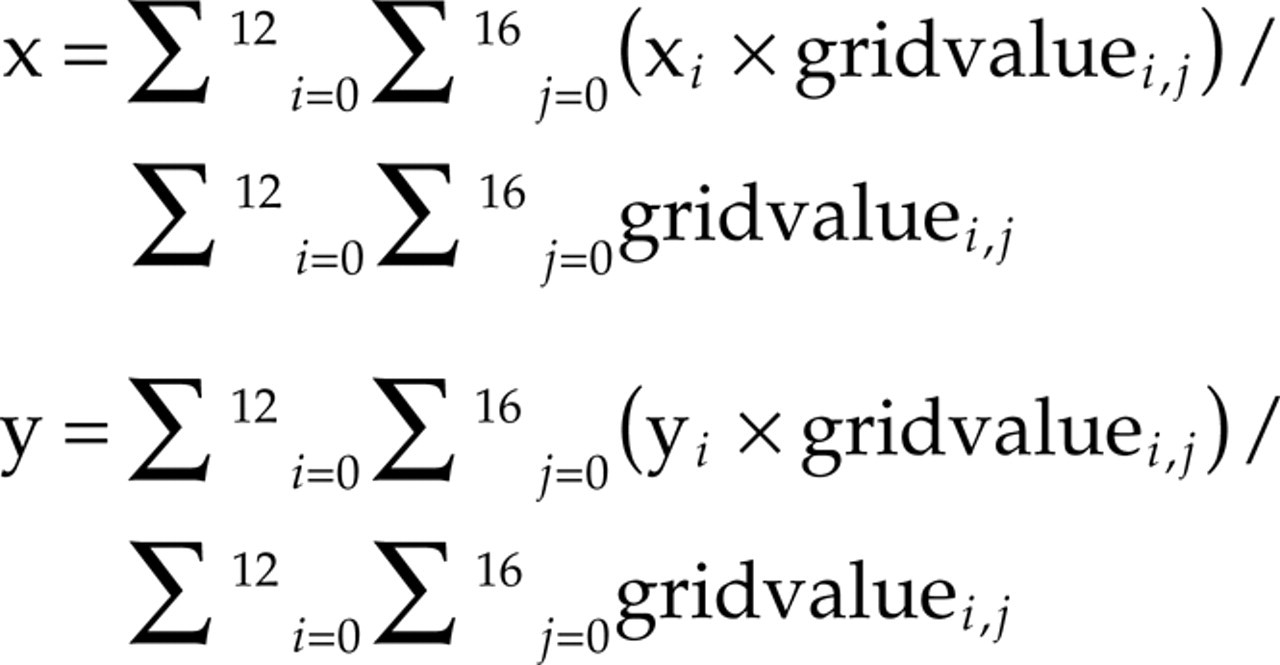
Furthermore, the length of the pain vector (X, Y), expressing the distance from 0,0 to the centre-of-gravity was calculated.
Statistics
The PPT and VAS data are presented in boxplots with medians and ranges. Pain area and COG means are presented as means with standard of the mean (SEM). One- or two-way analysis of variance (
Results
All 20 subjects completed the six infusions, which were always associated with a distinct sensation of deep, diffuse, moderate to intense levels of pain.
Pressure pain thresholds
Repeated measures

Boxplot (median and range) of pressure pain threshold values (PPT) at baseline (□) and post infusion (hatched) in six pericranial muscles (n = 20). ∗Significantly higher values in posterior temporalis (TPP) compared with masseter (MAS) and sternocleidomastoid (SCM) (Tukey: P < 0.001). †Significantly lower values in SCM compared with TPP, trapezius (TPZ) and splenius capitis (SPL) (Tukey: P < 0.05).
Perceived pain intensity
Infusion of hypertonic saline into the six tested muscles caused significant differences in VAS pain scores (Fig. 3). There were differences in the VAS-AUC (F = 4.273; P < 0.01) and post hoc analysis revealed significantly higher values in the masseter muscle compared with anterior temporalis, trapezius and sternocleidomastoid muscles (Tukey: P < 0.05) (Fig. 3a). Also, the VAS-peak pain scores were different between muscle sites (F = 2.752; P < 0.05) and post hoc analysis demonstrated higher values in the masseter muscle compared with the trapezius muscle (Tukey: P < 0.05) (Fig. 3b). The time for VAS onset (time when first pain was reported) was not significantly different between muscle sites (Fig. 3c) in contrast to the time for VAS offset (time when last pain was reported) (F = 4.472; P < 0.002). The post hoc analysis showed later offset times for the masseter muscle compared with the anterior temporalis, trapezius and sternocleidomastoid muscles (Tukey: P < 0.01) (Fig. 3d). Additional analysis indicated no significant gender differences in any of the VAS pain scores.

Boxplots (median and range) illustrating measures of the perceived pain intensity assessed on visual analogue scales (VAS) following infusion of 0.2 ml hypertonic saline into six pericranial muscles: (a) Area under VAS pain curve (VAS-AUC). (b) Maximum pain (VAS-peak). (c) Time in seconds for onset of pain (VAS-onset). (d) Time in seconds for offset of pain (VAS-offset). ∗Higher values in masseter (MAS) compared with anterior temporalis (TPA), trapezius (TPZ) and sternocleidomastoid (SCM) (Tukey: P < 0.05). †Higher values in MAS compared with TPZ (Tukey: P < 0.05). ‡Higher values in MAS compared with TPA, TPZ, SCM (Tukey: P < 0.01).
Perceived pain areas
The

Illustration of subject-based and superimposed drawings (n = 20) of perceived pain following infusion of 0.2 ml hypertonic saline into six pericranial muscles. The mean (±SEM) area of pain is provided for each muscle.
Centre-of-gravity measurements of the pain drawings from 20 subjects (mean ± SEM)
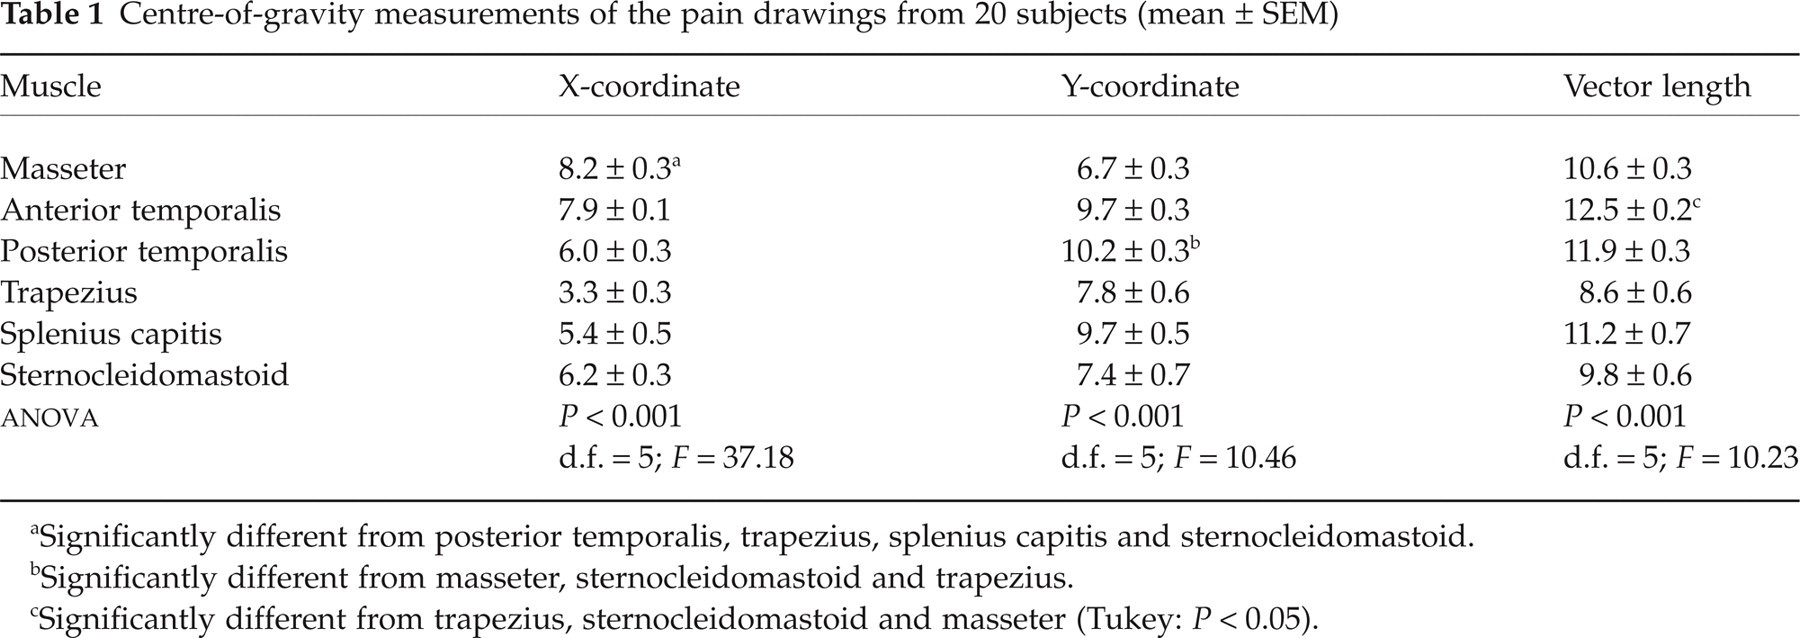
Significantly different from posterior temporalis, trapezius, splenius capitis and sternocleidomastoid.
Significantly different from masseter, sternocleidomastoid and trapezius.
Significantly different from trapezius, sternocleidomastoid and masseter (Tukey: P < 0.05).
The pain drawings were also related to the trigeminal and cervical innervation territories and showed that the masseter and anterior temporalis muscles were almost exclusively associated with a spread and referral of pain to the trigeminal territories, whereas pain in the posterior temporalis muscle frequently spread to the cervical territories. In contrast, pain in the trapezius muscle was only rarely associated with pain in the trigeminal territories, whereas pain in the splenius and sternocleidomastoid muscles was frequently reported in the ophthalmic division (V1). The distribution of pain patterns with respect to trigeminally vs. C2-C3 innervated dermatomes demonstrated significant difference (χ2 test: P < 0.005).
Correlations between PPT, VAS and pain areas
The PPT at baseline was inversely correlated to both the VAS-AUC and the VAS-peak for the masseter, anterior temporalis and splenius muscles. The perceived area of pain was positively correlated to the VAS-AUC for the splenius muscle and to the VAS-peak for the posterior temporalis muscle.
Discussion
The present study is the first to provide a standardized description of the pain patterns and pain sensitivity following intramuscular infusion of hypertonic saline into six craniofacial muscles. There were significant differences in PPTs between muscles and in pain scores to experimental pain. The location of pain varied widely between the trigeminally and cervically innervated muscles. These findings point to differential sensitivity of the craniofacial muscle tissue and characteristic pain patterns.
Methodological issues
Efforts were made to inform the participants thoroughly about the experiments and the distress and pain involved. Participants could at any time leave the study, which in every way was conducted in accordance with the Declaration of Helsinki. The local Ethics Committee in Aarhus County, Denmark approved the experiments and informed consent was obtained from all participants. The method of intramuscular injection of hypertonic saline as experimental pain model is well known and was well accepted by the participants in accordance with previous studies: Kellgren (12), Graven-Nielsen et al. (17), Svensson et al. (18), Svensson et al. (19). All the participants returned to session 2 to complete the examinations planned. The experimental model is relatively easy to use, but it should be mentioned that injections into the splenius muscle may be technically more difficult than injections into the masseter muscle due to the layered arrangements of the cervical muscles and that electromyographic recordings could offer an advantage for the identification of the correct position of the needle. However, in this study we relied on a standard manual palpation of the muscle during head movements and voluntary contractions. A theoretical risk of muscular bleeding exists, but none of the subjects experienced any complications or complained of longer lasting pain. Thus, injection of hypertonic saline can generally be regarded as a safe and useful model of muscle pain.
Pressure pain thresholds
Pressure pain thresholds are often used in studies on musculoskeletal pain conditions as a quantitative measure of muscle sensitivity (i.e. mechanical allodynia and hyperalgesia). Relatively few studies have systematically addressed the question if PPTs differ between craniofacial muscles: Chung et al. (23), Kim et al. (24) and Sand et al. (25). The present results indicate that the sternocleidomastoid muscle is the most sensitive to phasic pressure stimulation and that the posterior temporalis muscle is the least sensitive. This is in agreement with the findings of Chung et al. (23), who observed mean PPTs of 193–239 kPa in the superior sternocleidomastoid muscle and 296–365 kPa in the posterior temporalis muscle, although no direct statistical comparison was performed. Sand et al. (25) also observed the highest PPTs in the posterior temporalis muscle when compared with 12 other craniofacial test sites. A number of physical or physiological differences could account for these results. First, the skin thickness and/or the sensitivity of the skin and subcutaneous tissue may vary between different regions. Studies by Reid et al. (26) and Fujisawa et al. (27), which applied topical local anaesthetics to the facial skin, have revealed minor or no changes in the PPTs, suggesting a modest role of superficial inputs to the PPTs. It is also conceivable that differences in topography, thickness, composition and organization of the craniofacial myofascial tissues may influence the transduction of pressure stimuli and the subsequent deformation of mechanoreceptors, depolarization and generation of receptor potentials. Yet another possibility is that the PPTs reflect true differences in muscle sensitivity, which might be related to the density of high-threshold mechanosensitive afferent fibres. It is likely that the different structures under the sternocleidomastoid muscle contribute to the lower PPT found in this muscle, compared with the other muscles.
From a clinical point of view, it is important to recognize that there are muscle-specific differences in PPTs in healthy controls, because standardization of manual palpation procedures may then require a grading of the pressure applied to the muscle. Bendtsen et al. (28) found that the PPTs and pain tolerance thresholds, in addition to pressure-controlled palpation, provide useful information on the pain sensitivity to phasic stimuli lasting seconds; however, Stohler et al. (29) and Svensson et al. (15) found that more tonic stimuli lasting several minutes may better mimic clinical pain conditions and allow description of spread and referral of pain.
Pain evoked by hypertonic saline
Kellgren (12) was the first to use injection of hypertonic saline into deep tissues to study spread and referral of pain. Campbell et al. (30) used Kellgren's technique in 20 subjects and tested the paravertebral tissues from the level of the atlanto-occipital joint to the C4-C5 level. They observed pain in the frontal and parietofrontal regions (V1-V2 areas) in the majority of subjects (62–85%) only with injections at the occipital and C1 regions. Injections of 0.5–1.0 ml 6% hypertonic saline into the paravertebral muscles of five subjects at the cervical level were later shown to produce pain in the occipital and posterior neck regions, but Feinstein et al. (31) found that only painful stimulation at the C1 level was associated with referral of pain to the forehead (V1 area) in a single subject. Experimental pain in the sternocleidomastoid muscle was also found by Ashton-Miller et al. (32) to be referred to the ipsilateral temporomandibular region leading to headache. The present study has confirmed the previous experimental studies suggesting that pain in the splenius muscle and sternocleidomastoid muscle can quite frequently (70–80%) be found in the V1-V2 areas and may mimic the clinical representation of TTH.
Although there is considerable subject-to-subject variability in the location of muscle pain, the new COG technique was sufficiently sensitive to discriminate between the localization of the craniofacial muscle pain. The COG may therefore prove useful in the quantitative analysis of pain maps in patients with craniofacial pain conditions.
Painful stimulation of the trapezius muscle in the present study was less frequently (25%) associated with pain in the V area (Fig. 4) in accordance with preliminary data showing that injection of 0.5 ml hypertonic saline into the trapezius muscle causes local pain in the posteriolateral part of the neck with involvement of the V12 areas in up to 36% as found by Arai et al. (33). Steinbrocker et al. (34) also observed that injection of 0.2–0.5 ml 6% saline into the trapezius muscle caused pain, which spread toward the head in 13/14 subjects, but they provided no detailed description of the location. Recently, M⊘rk et al. (35) found that combinations of algesic substances (bradykinin, serotonin, histamine and prostaglandin E2) injected into the trapezius muscle under electromyographic guidance caused moderate levels of pain, which was localized primarily around the injection side.
Injection of hypertonic saline into the anterior temporalis muscle was found by Simons et al. (36) to cause local pain around the injection site, which increased to include the ipsilateral neck area following repeated stimulation. The occurrence of referral of pain from the anterior temporalis muscle has been found by Jensen et al. (13) to be dependent on the perceived intensity of pain; however, we observed a significant correlation between the pain area and VAS pain scores only for the posterior temporalis and splenius muscles. Differences in assessment of pain intensity (ratio-interval scales vs. ordinal scales) and definition of spread and referral (size of an area vs. occurrence or not) may explain the discrepancies, in addition to the relative small number of subjects. Painful stimulation of the masseter muscle has been extensively described by Stohler et al. (14) and Svensson et al. (15, 18, 19) and the present findings were in accordance with the previous results.
In this study the same amount of saline was injected into all the different muscles without regard to their volume or architecture. This makes it possible to compare the pain response to this standardized stimulus between the different muscles and thereby describe differences between the muscles. We found that the masseter muscle was the most sensitive (highest VAS pain scores) to infusion of hypertonic saline, more sensitive than the bigger anterior temporalis, trapezius and sternocleid muscles, whereas no difference was found when compared with the splenius muscle. Kellgren (12) and Stohler and Lund (14) suggested similar findings, whereas Graven-Nielsen et al. (17) found no difference in pain intensity when the same amount of hypertonic saline was injected into muscles of different size. This difference may be due to the relative amount of injected saline compared with muscle volume (17). It is interesting to note that the sternocleid muscle was the most sensitive to phasic stimulation with the pressure algometer. This clearly demonstrates that it is important to consider different types of stimuli in a comprehensive description of muscle pain sensitivity.
It is noteworthy that all the subjects returned to baseline (i.e. no pain) fairly quickly (about 3–13 min) after the hypertonic saline injections. Analyses of specific pattern or delay in the normalization after repeated injections could be of interest but was not part of the design of this study, as it would require considerably more subjects to be examined.
Analyses of VAS-peak demonstrated the same differences in results as VAS-AUC, probably due to a strong correlation between these parameters. Analyses of VAS-onset did not demonstrate any differences between the muscles, whereas analyses of VAS-offset demonstrated significant differences between the muscles similar to VAS-AUC. Again, the VAS-offset is strongly correlated to the VAS-AUC. For descriptive purposes it may, however, be useful to report all these parameters.
Gender
Recent studies by Cairns et al. (22) and Svensson et al. (37) have shown gender differences in perceived pain intensity and pain areas following glutamate injections into the masseter muscle. Also, the frequency of referred pain following hypertonic saline injections into the anterior temporalis muscle has been shown to be gender dependent, with more women reporting referred pain by Jensen et al. (13). However, in the present study we could not support these findings using hypertonic saline as a painful stimulus, whereas the PPTs showed significantly lower values in women compared with men. This difference between PPT and saline-evoked VAS pain scores could be related to a higher interindividual variability for the latter pain measure. However, calculation of the coefficient of variation for the PPT values and VAS-AUC did not indicate major differences. It should be noted that the present study was not designed specifically to test for gender differences and larger groups may be needed in order to detect this effect.
Spread and referral of muscle pain
The clinical significance of the size of the perceived pain area remains unclear. Several theories regarding the phenomenon of spread and referral of pain have been suggested. Basically, they state that nociceptive dorsal horn or brainstem neurons receive convergent inputs from various tissues, thus higher centres cannot identify correctly the actual input source, as described by Mense et al. (7) and Arendt-Nielsen et al. (38). Most recent models have included newer theories where sensitization of dorsal horn and brainstem neurons plays a central role. Amano et al. (39) and Sessle et al. (40) describe how single neuron recordings in experimental animals have shown an extensive convergence between trigeminal and cervical afferent inputs into the caudal part of the trigeminal sensory nucleus complex. It has been proposed by Mense et al. (7) that TTH could be the manifestation of referred pain from trigger points located in either the temporalis, sternocleidomastoid, upper trapezius or suboccipital muscles. The pathophysiology of trigger points remains an enigma, but a study by Simons et al. (41) has claimed abnormal electrical activity in focal points. It is obvious how the reported localization of perceived pain in the splenius and trapezius muscles resembles similar mappings of habitual pain in TTH patients (Schmidt-Hansen et al., unpublished data). There were different sensitivities among the six tested craniofacial muscles, which also depended on the methods used to test. The most striking finding was the different patterns of pain, which were clearly different between trigeminally and cervically innervated muscles. This finding is significant, as it clarifies the importance of the localization of muscles examined in experimental headache research. This difference could be quantified by a new COG measure and suggests that there is only a partial functional overlap between upper cervical and trigeminal afferents, such as suggested in animal studies by Bartsch et al. (42). The COG measure is demonstrated to be a tool sensitive enough to detect differences between localization of referred pain, and may be useful when examining craniofacial pain conditions, where the drawings show less clear patterns than what has been found here.
Footnotes
Acknowledgements
The present study was supported by Danish Pain Research Centre and Department of Neurology, Aarhus University Hospital, Denmark, Centre for Sensory–Motor Interaction, Aalborg University, Denmark, Department of Neurology, Viborg Hospital, Denmark, Rosa and Asta Jensens Found, the Danish Headache Society.