
Abstract
Partial microcirculatory stasis after cerebral ischemia and reperfusion is a potential factor in delayed cell death. Sometimes described as the “no-reflow” phenomenon, limitations in current detection techniques have left the extent and spatial distribution of the phenomenon undetermined, which has led to some doubt as to its actual existence. The authors describe a new method, based on erythrocyte autofluorescence, that allows the erythrocytes trapped in the microvasculature, and thus blocking recirculation, to be directly visualized. Using this method, the authors have examined the spatial and temporal characteristics of this phenomenon in the rat intraluminal model of cerebral ischemia and reperfusion. Up to 15% of the capillaries in the ischemic penumbra remained occluded at least 2 hours after reperfusion. The amount of capillary bed showing trapped erythrocytes was more severe in the ischemic penumbra region than in the ischemic core. These results indicate that the no-reflow phenomenon may contribute to the developing damage in ischemic penumbra region, leading to additional injury after reperfusion.
When the main blood supply to a particular region of brain is abruptly stopped, the pathophysiologic changes that result are different between the central and peripheral regions of the involved area. Acute neuronal death occurs within the first hour of initial loss of blood flow in the central region (ischemic core), whereas some of the neurons in peripheral regions (ischemic penumbra) undergo slow degeneration over a period of several hours or days (Hermann et al., 2001). In contrast to the core, the penumbra undergoes dynamic changes throughout the ischemia and reperfusion process, and it may coalesce either with the ischemic core or with the normal tissue, depending on the reperfusion conditions. A significant therapeutic goal of clinical management in stroke patients is to salvage the viable tissue in this penumbra. The concept of an ischemic penumbra region was first proposed over 20 years ago (Astrup et al., 1981), and many factors have since been proposed as mediating the delayed cell death therein, including disturbance of cerebral blood flow (Baron, 2001; Rohl et al., 2001), energy crisis (Folbergrova et al., 1992; Nowicki et al., 1988), cerebral edema (Haseldonckx et al., 2000; Kempski et al., 2000), excitotoxicity and calcium overload (Dirnagl et al., 1999; Lipton, 1999; Obrenovitch and Richards, 1995), free-radical generation (Peters et al., 1998), periinfarct depolarization (Higuchi et al., 2002; Pinard et al., 2002), and intracellular biochemical cascades (Ay et al., 2001; Dirnagl et al., 1999). The effective balance of these and other potential factors is still unclear.
We consider here the often-overlooked possibility that local preischemic circulatory conditions at the capillary level are not fully restored long after blood flow is resumed in the major arteries, rendering the penumbra volume vulnerable to a much longer period of partial ischemia. This condition has in the past been termed the “no-reflow” phenomenon (Ames et al., 1968), and describes a microvasculature perfusion failure after cerebral ischemia and reperfusion. A no-reflow phenomenon was first observed in rabbit brain after transient interruption of cerebral blood flow (Ames et al., 1968) and has been found to occur in a number of tissues after ischemic insult, including brain (Ames et al., 1968; Aspey et al., 1989; Fischer et al., 1977), heart (Eeckhout and Kern, 2001), and extremities (Law et al., 1994). Nearly all no-reflow studies have been made using distributions of contrast-enhancing agents, such as carbon-black particle suspensions injected into the vasculature, and comparing animals subject to ischemic insults with control animals. Such measurements have suggested that the phenomenon exists (Bottiger et al., 1997; Mori et al., 1992; Thomas et al., 1993), but offer limited quantitative information on the extent of the persistent ischemic condition or its time course and spatial distribution. At least one study (de la Torre et al., 1992) has questioned the existence of the phenomenon based upon this indirect type of evidence. A more direct technique using fluorescent antibody labeling of capillaries together with infusion of a second fluorophore in the same animal also failed to support the no-reflow concept (Li et al., 1998a).
Here we introduce a procedure that exploits the fluorescence of native porphyrin species contained in erythrocytes. The cerebral vasculature is flushed with heparinized saline by cardiac perfusion to remove erythrocytes from the functional postischemic brain microcirculation. Fixed tissue is then treated with a strong reducing agent, sodium borohydride (NaBH4), which renders trapped erythrocytes highly fluorescent, probably by liberating Fe from its quenching position in the porphyrin ring of hemoglobin. This method suggests not only that a significant fraction of the capillary bed is occluded, but also that it is blocked by trapped erythrocytes, with relatively greater trapping in the penumbra. Moreover, the density of trapped erythrocytes shows no significant decrease after in vivo reperfusion times up to 2 hours. The results show not only that oxygenation is compromised for extended periods owing to the loss of flow in the capillary bed, but also that erythrocytes are trapped in the vasculature for considerable periods and could therefore be a source of cytotoxic breakdown products.
MATERIALS AND METHODS
Animals and surgical procedures
The Laboratory Animal Care and Use Committee of the University of New Mexico Health Science Center approved all experimental protocols.
Experimental groups
Sprague-Dawley rats (Charles River Laboratory, Wilmington, MA, U.S.A.) weighing 310 to 330 g were randomized into the following five groups: (1) no ischemia, without perfusion fixation; (2) no ischemia, with perfusion fixation; (3) 90-minute middle cerebral artery occlusion (MCAO), with perfusion fixation; (4) 90-minute MCAO followed by 20 minutes of reperfusion, followed by perfusion fixation; (5) 90-minute MCAO followed by 120 minutes of reperfusion, followed by perfusion fixation. Each group consisted of six rats.
Anesthesia and perfusion fixation
Anesthesia was induced by inhalation of 3% halothane in 70% nitrous oxide and 30% oxygen. Halothane was then reduced to 1.2% for anesthesia maintenance during the MCAO procedure. Body temperature was monitored and maintained at 37°C. Animals in group 1 (no ischemia and without perfusion fixation) were killed by decapitation while anesthetized. Brains were removed immediately and immersed in 10% formalin in 0.1 mol/L phosphate-buffered saline (PBS) for 24 hours. Animals in all other groups were killed by intraaortic perfusion of 200 mL 10% formalin at a pressure of 150 cm H2O while anesthetized. Before the formalin perfusion, the rats were flushed thoroughly with an intraaortic perfusion of heparinized PBS (12.5 U/mL). Brains were removed after formalin perfusion and immersed in 10% formalin for 24 hours of postfixation. Two additional rats in group 5 were further perfused with 200 mL 0.017% Cascade Blue-labeled dextran (D-1976; Molecular Probes, Eugene, OR, U.S.A.) and gelatin solution after perfusion fixation.
Ischemia and reperfusion
Middle cerebral artery ischemia and reperfusion were conducted according to the method of Longa et al. (1989) with some modifications. Briefly, a midline incision was made in the neck and the right common carotid artery (CCA), external carotid artery (ECA), internal carotid artery (ICA), and pterygopalatine artery (PPA) of ICA were exposed. The ECA was ligated, and the CCA, ICA, and PPA were distally closed by microclips. A loose loop was made using 4–0 silk suture around the origin of the ECA and a slit was made near the bifurcation. A silicone rubber-coated monofilament nylon suture was inserted into the ICA via the ECA slit. The suture was advanced along the ICA to a distance of 18 or 19 mm from the bifurcation and fixed firmly at the final position by applying a microclip on the ICA. The microclips on the PPA and CCA were released and the incision was closed. The animals were allowed to recover from anesthesia during the 90 minutes of ischemia, but were reanesthetized briefly for the reperfusion procedure. No heparin was used in these procedures. The incision was reopened, the microclip on the ICA was removed, the blood flow was restored by gently withdrawing the suture until the suture tip reached the bifurcation, and the incision was reclosed. Rats were allowed to recover from anesthesia and move freely after reperfusion.
Tissue processing
For assessment of infarction volume, preliminary experiments were carried out on rats (n = 20) given 90-minute MCAO followed by 22.5 hours of reperfusion. Brains from these animals were sectioned at 1-mm thickness using a brain matrix. Slices were then immersed in 2% triphenyltetrazolium chloride (TTC; Bederson et al., 1986) in PBS for 15 minutes and subsequently fixed in 10% formalin in PBS.
For examination of cell morphology and erythrocyte fluorescence, brains from experimental groups (prepared as described in Anesthesia and perfusion fixation) were rinsed thoroughly with PBS and sectioned at 50 μm using a vibratome. Sections were treated with 0.2% (W/V) NaBH4 (Clancy and Cauller, 1998) in PBS for 20 minutes, rinsed in PBS for 5 minutes, and then mounted in Gel/Mount (Biomeda, Foster City, CA, U.S.A.) on glass slides to be examined on a fluorescence microscope. Cell morphology from groups 3 through 5 was used to distinguish penumbra from ischemic core.
Image acquisition and analysis
Tissue sections were viewed using a microscope equipped with epifluorescence optics (model BH2-RFCA; Olympus, Tokyo, Japan). Filter set TRITC (545-nm excitation, 570-nm dichroic, 610-nm emission) was used for erythrocyte autofluorescence and cell morphology observation, and DAPI (360-nm excitation, 400-nm dichroic, 460-nm emission) was used for Cascade Blue observation. Images were acquired using a digital camera (Olympus MLH 020550) controlled by Olympus MagnaFire software.
Determination of the penumbra, ischemic core, and normal region
It is technically difficult to distinguish the early ischemic core from the penumbra since the infarction following artery occlusion takes time to develop fully. Although there are no readily available criteria, neurons in the ischemic region with a collapsed or shrunken configuration are intensely damaged (Kalimo and Smith, 1986; Petito et al., 1997; Radovsky et al., 1997). There is increasing evidence that in the early stage of ischemia the areas containing collapsed or shrunken neurons represent the developing infarction area, the ischemic core (Czurko and Nishino, 1993; Liu and Guo, 2000; Onizuka et al., 1996). In this study, we considered the area containing collapsed or shrunken neurons to be early ischemic core, and the zone between the core and the normal tissue the penumbra.
Special terms and methods used in tissue section analysis
In order to quantify the number of capillary segments that contained trapped erythrocytes, we initially determined the no-reflow fraction. The percentage of occluded vessels, or no-reflow fraction, was defined as area of capillaries containing erythrocytes per field of view (0.58 mm2) in the ischemic region divided by area of total capillaries per field of view (0.58 mm2) in the corresponding regions of immersion-fixed brains from control rats. In a more comprehensive analysis, we employed an empirical parameter that we termed the microcirculatory stasis index. This parameter, used as a measure of severity of the no-reflow phenomenon, was defined as the actual capillary area containing fluorescent erythrocytes in 0.58 mm2. Microcirculatory stasis indices were expressed in units of micrometers squared per field. Therefore, the microcirculatory stasis index for nonischemic brain would be zero, as no erythrocytes were found in the perfusion-fixed brain sections. Six 50-μm sections from each rat, beginning caudally from level of optic chiasma with intervals of 0.5 mm, were used for analysis. For each section, two images were obtained from the cortical ischemic core, one image from the basal ganglia ischemic core, and two images from cortical penumbra, all with 10x magnification. Areas of capillary fluorescence were determined using Image Pro Plus (version 4.1) software. A flattening function in the filter sets was used to minimize the effect of nonuniform excitation intensity. Segmentation thresholds were based on the intensity histogram range. Fluorescent capillaries in most images were well recognized with a threshold range of 170 to 196 (8-bit scale). The area of capillaries per x10 field in control rats was 4.3 × 10 and 4.7 × 10 μm corresponding to ischemic core and penumbra regions in ischemic rats, respectively.
Confocal images
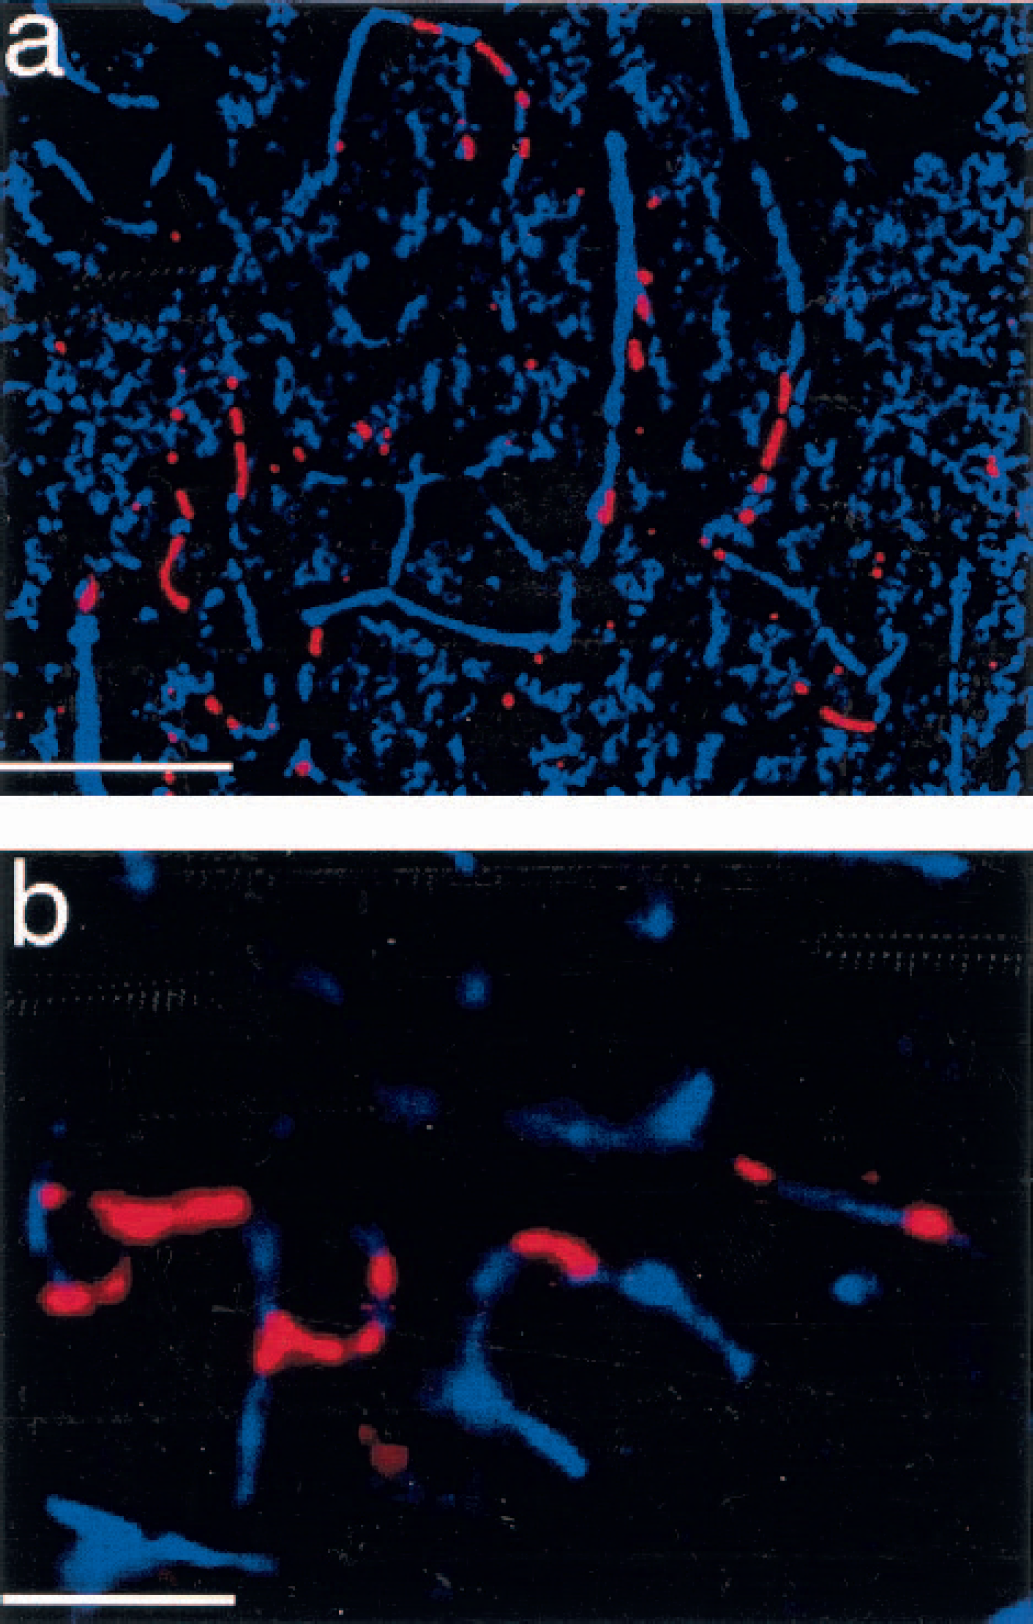
In addition to conventional microscopy, preparations were also examined by making a series of optical slices through 150-μm tissue sections on a confocal microscope (Bio-Rad MRC-600 scanning head [Bio-Rad, Hercules, CA, U.S.A.] mounted on a Zeiss IM35 microscope [Carl Zeiss Corp., Oberkochen, Germany]). Images shown in Fig. 4 were made using a x20 objective with 488-nm excitation with z-axis steps at 5 μm.
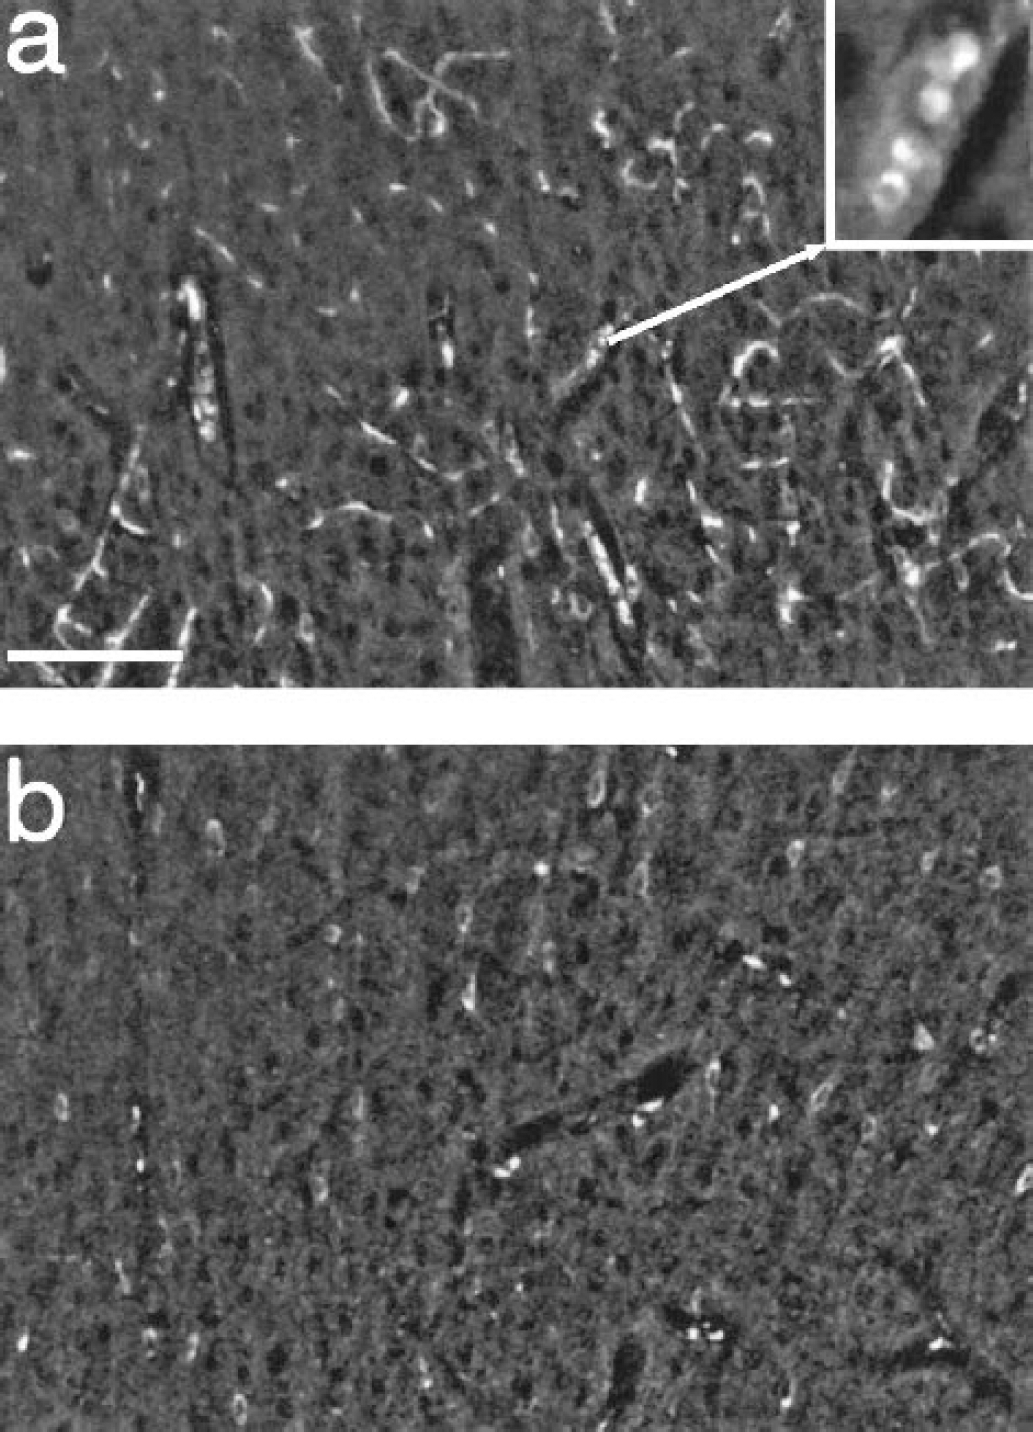
Image stacks acquired by confocal microscopy from brain sections of rats subjected to 90-minute middle cerebral artery occlusion and 20 minutes of reperfusion. The images are a composite of 15 optical sections taken at 5-μm steps from 150-μm brain sections obtained from the penumbra region
Blood fluorescence spectrometry
Rat blood (100 μL) acquired from tail veins was dissolved in 1 mL normal saline. The solution was centrifuged at 2,000 g for 1 minute, the supernatant was discarded, and the pellet was resuspended in 1 mL normal saline and recentrifuged. The procedure was repeated three times. Then the pellet was either treated with 0.2% NaBH4 in normal saline or resuspended in normal saline for 20 minutes. After washing the pellets with normal saline three times, erythrocytes were lysed in 100 mL distilled water. The lysates were centrifuged at 10,000 g for 30 minutes, and the supernatants were analyzed in a 1-cm cuvette at a noise-limited low concentration in a Shimadzu RF-1501 spectrofluorimeter.
Statistics
Analysis of variance and Scheffé multiple comparison were used to analyze microcirculatory stasis index, and Student's t-test was used to analyze no-reflow fraction. A P value < 0.05 was considered to indicate significance.
RESULTS
Autofluorescence of erythrocytes treated with NaBH4
Figure 1 illustrates fluorescence visualization of the capillary bed in neocortex (Fig. 1a) and basal ganglia (Fig. 1b) from a control animal (no ischemia) where the brain was not perfused, but fixed by immersion in 10% formalin PBS. Brains from animals in this group (n = 6, group 1; Materials and Methods) were then sectioned (50 μm) and treated with NaBH4 (Materials and Methods; group 1). This fixation protocol was used to gain an estimate of the total capillary bed as viewed by autofluorescence. This pattern could be observed using either a standard fluorescein or rhodamine filter set (Materials and Methods); however, better contrast was obtained with the rhodamine filters. Where the NaBH4 step was omitted from the procedure, capillaries were indistinguishable from background autofluorescence in both neocortex and basal ganglia (Fig. 1c). Fig. 1d is representative of brains of control animals (n = 6, group 2) where intracardial perfusion with heparinized PBS was performed to flush the microcirculation before fixation. With this protocol, brain sections treated with NaBH4 failed to show the prominent fluorescence seen in Figs. 1a and 1b; indeed, lumens of the apparent capillaries were darker than the background (Fig 1d). These observations suggest that the fluorescence patterns seen in Figs. 1a and 1b arise from erythrocytes in the brain vasculature.
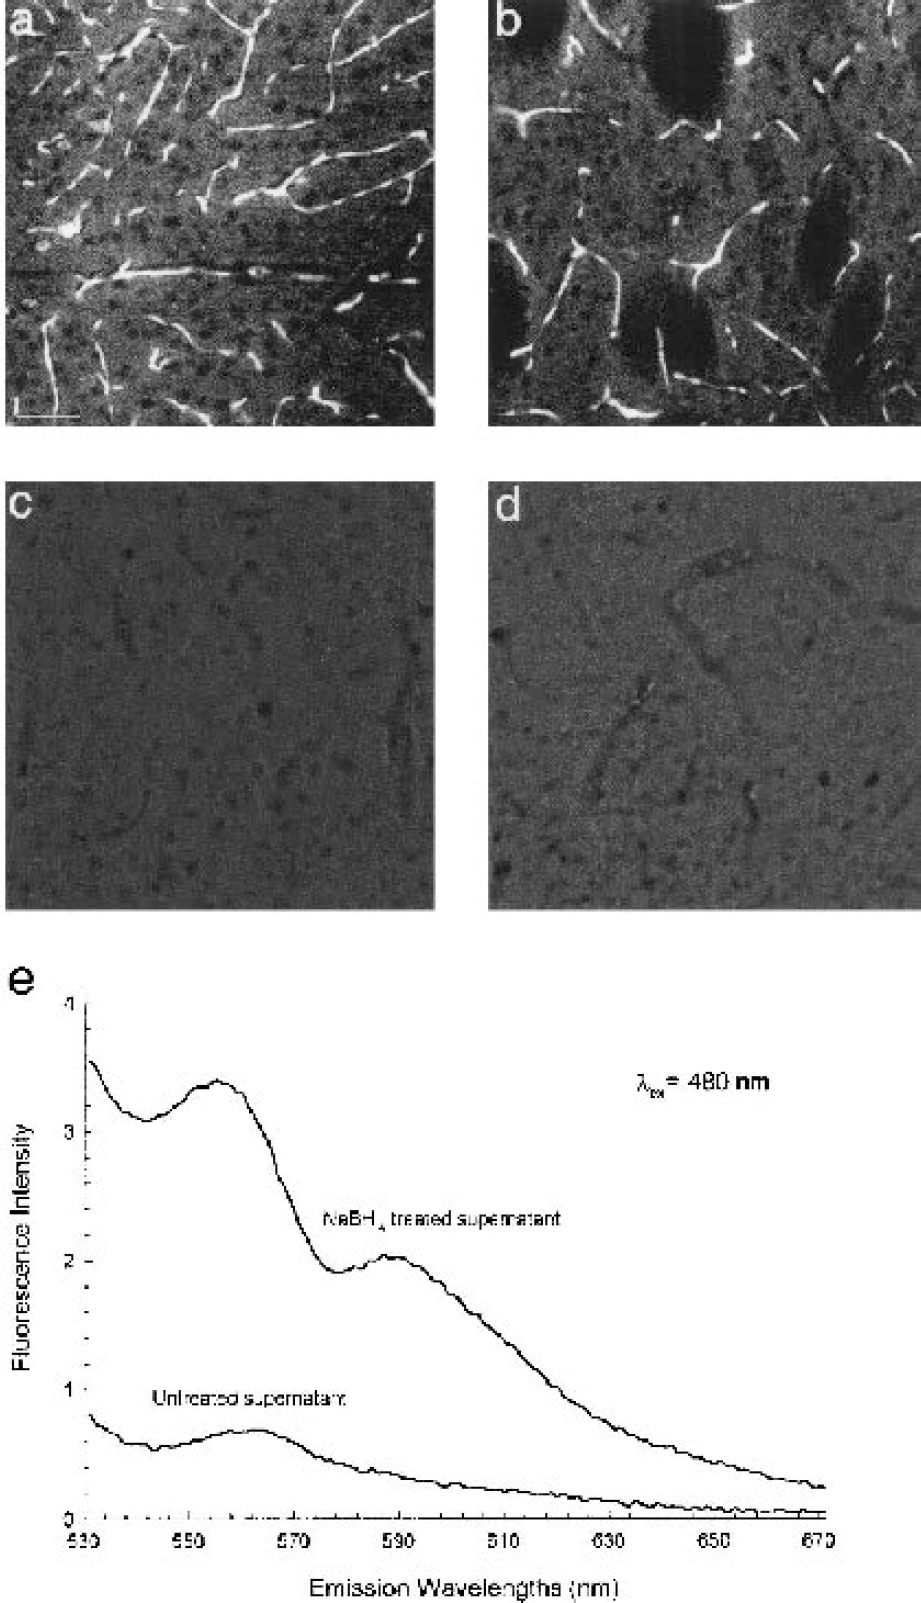
Fluorescence micrographs of sectioned brain tissue from control rats.
We hypothesize that the increased visibility of the erythrocytes after NaBH4 reduction is due to free base porphyrin or its many reduction products. Fluorescence spectra of crude lysates from untreated and NaBH4-treated blood cells are shown in Fig. 1e. Treatment with NaBH4 increased fluorescence approximately 6.5-fold for emission wavelengths of 590 nm and above, where visualizations of erythrocytes were routinely made in the standard light microscope. This increase is to be expected since a reducing agent such as NaBH4 will liberate Fe from the porphyrin ring of hemoglobin so that it will no longer quench the porphyrin fluorescence. The spectrum of the treated lysate displayed two broad peaks, at 555 and 590 nm, at neutral pH. These are blue-shifted from the spectral peaks of a purified porphyrin, 585 and 620 nm for octaethylporphyrin (Gouterman, 1978). Separation of the peaks in the present study is approximately the same as the value reported by Gouterman (30–35 nm). Probable causes of the blue shift are reduction of double bonds within the porphyrin ring to yield others of the many fluorescent species derivable from this molecule. The characteristic orange-red band of fluorescence is a unique property of the porphyrin family among biologic molecules (Gouterman, 1978).
Freshly prepared blood smears treated with NaBH4 were also examined in the confocal microscope at high magnification (x63 Zeiss Acroplan) objective. The fluorescence of individual cells in this configuration was diffuse and doughnut shaped with no indication of membrane localization, consistent with our hypothesis of porphyrin fluorescence. Autofluorescence of untreated cells was less than 5% of the cells treated with NaBH4.
Trapped erythrocytes in the capillaries of ischemic brain sections
Figure 2 summarizes how areas chosen for microvasculature analysis below were selected. Figure 2a shows a TTC (Bederson et al., 1986) stain of a coronal section at the commisural level made 22.5 hours after 90-minute MCAO. At this time there is a well-developed infarct (white region, C1-C3) for which we use the customary term, ischemic core. In adjacent regions (P1 and P2), referred to as penumbra, cell damage, although present, is less pronounced at this time. As noted previously, neither of these regions is stationary in time, with the infarct volume expanding over 1 or 2 days. Analysis of cell loss in the penumbra 46 hours after 2-hour MCAO showed approximately 40% loss in penumbra near the core (inner penumbra) to approximately 10% in the outer volume (Li et al., 1998b). Such frank tissue differences require several hours to develop, even with permanent occlusion (Garcia et al., 1993; Nedergaard, 1987). However, in the reperfusion time window we have examined (20–120 minutes), there were clear histologic differences between cells in the central core and those in the surrounding regions (see Materials and Methods). In the central, or early core, neurons were collapsed or shrunken, with pericellular edema (Fig. 2b). In the penumbra near the core, neurons maintained a normal morphology but some pericellular edema was present (Fig. 2c). Most neurons in the penumbra close to normal tissue had normal morphology and pericellular edema was absent (Fig 2d). Fig. 2e shows neurons in normal tissue. These early morphologic differences corresponded to the regional divisions mapped on to the 1-day TTC stain of Fig. 2a.
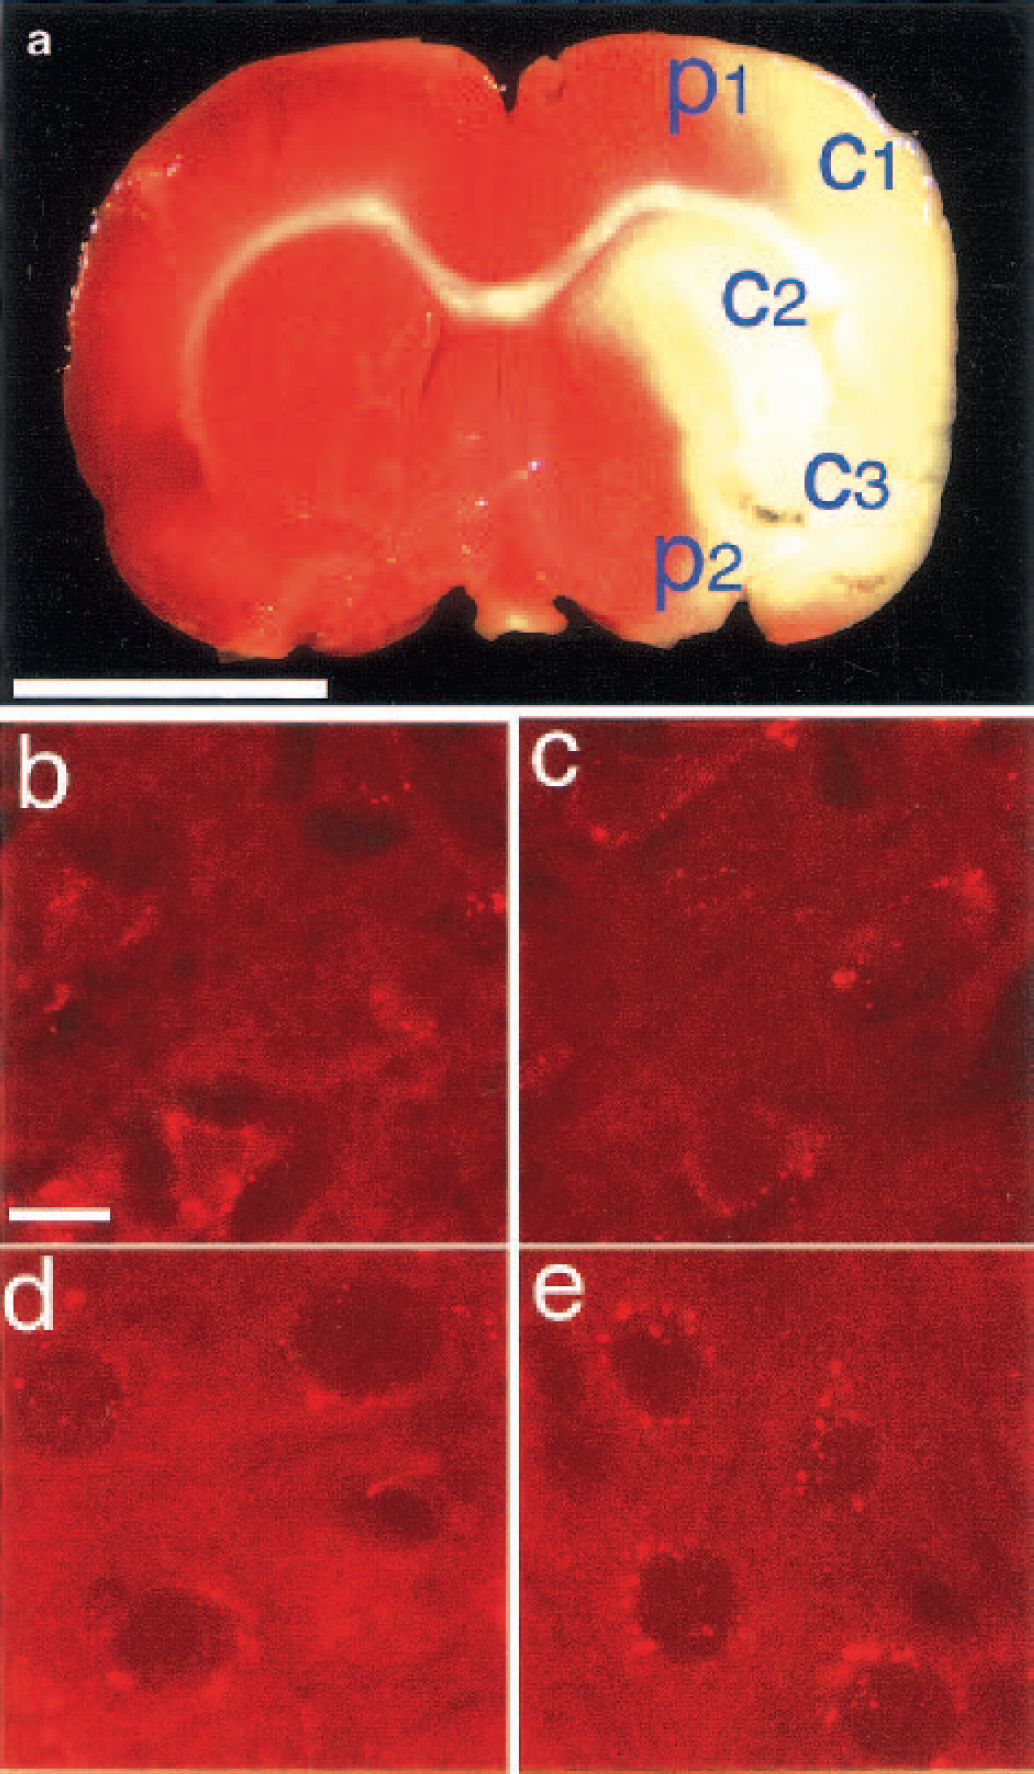
(a) A triphenyltetrazolium chloride stain of rat brain section after 90-minute ischemia and 22.5-hour reperfusion showing the areas considered to be ischemia core and penumbra. Labels p1 and p2 indicate the two positions selected for no-reflow measurements in penumbra; c1, c2, and c3 indicate the three positions selected for no-reflow measurement in ischemic core used in the construction of Fig. 5.
After a 90-minute MCAO and a reperfusion period of either 0, 20, or 120 minutes, brains were flushed in situ with heparinized PBS via intracardial infusion for 20 minutes (200 mL) and then perfusion-fixed, sliced, and treated with NaBH4. Without the MCAO step, the subsequent procedures produced the near-blank micrographs typified by Fig. 1c. In the MCAO animals, however, trapped erythrocytes were found in many of the capillaries of the ischemic core (Fig. 3a) and penumbra (Fig. 3b). On the contralateral side of the brain, which received no insult, there was no erythrocyte fluorescence (Fig. 3d), establishing that there is a marked difference in the threshold of perfusion flow for erythrocyte removal between the two regions. No erythrocytes were trapped in arterioles and venules of any region.
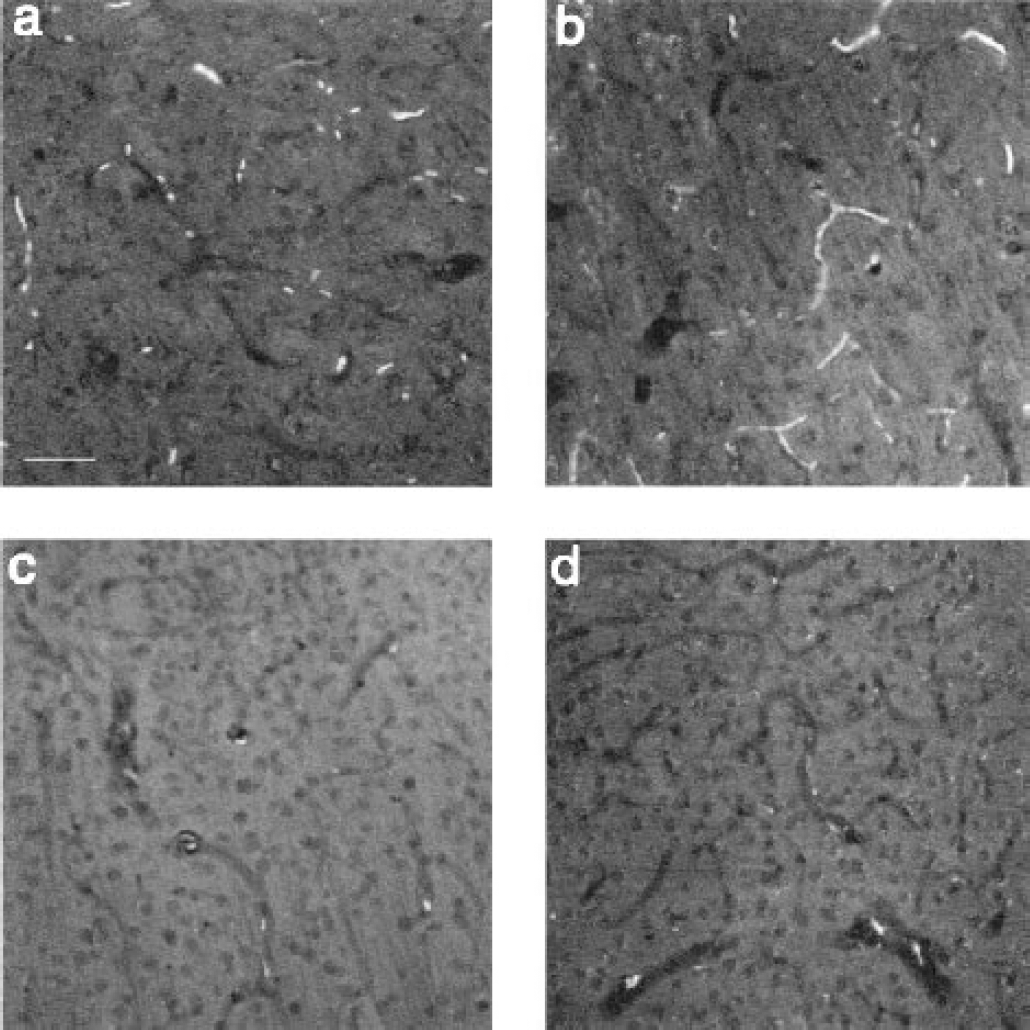
Autofluorescence of erythrocytes in capillaries of brain sections of ischemic rat. Differences of no-reflow phenomena between ischemic core
Sets of images were also taken from brain sections from two MCAO rats using a confocal microscope to generate an integrated view of the vasculature over a greater depth than conventional microscopy allows and to better demonstrate the morphology defined by the trapped erythrocytes. Figure 4 shows composite images made by stacking optical slices over a depth of approximately 70 μm (see Materials and Methods). The image in Fig. 4a taken at region P1 (as indicated in Fig. 2a) of the ischemic penumbra shows widely distributed fluorescent microvasculature, while the image in Fig. 4b, from the equivalent area on the contralateral side, shows only autofluorescence of neuron-shaped cells. The inset in Fig. 4a is a magnified view taken from one interior optical section and shows broadside views of some of the erythrocytes that display their characteristic doughnut-shaped morphology.
One estimate of the relative fraction of no-reflow to total vasculature was made as follows using conventional microscopy. Total vasculature was determined by summing the total fluorescent areas in slices from control animals whose brains had not been flushed and were immersion fixed, as in Figs. 1a and 1b. No-reflow vasculature was determined as total fluorescent area from brains of ischemic animals where a heparinized PBS flush was given before perfusion fixation, as in Fig. 3. In a given animal, data were taken from six sequential slices matched in location of origin (see Materials and Methods). Using this method, the no-reflow fraction after 90-minute MCAO, defined as total fluorescent area in ischemic animals divided by total fluorescent area in nonperfused control animals, was found to be 15.2 ± 5.6% (n = 18) in the penumbra and 8.67 ± 3.6% (n = 18) in the core; this difference was statistically significant (P < 0.003, t-test).
Having established the no-reflow fraction, we estimated the degree of capillary occlusion in subsequent experiments by expressing the total area of erythrocyte fluorescence per unit area of tissue. We have termed this value a “microcirculatory stasis index,” and have used this index to show that the no-reflow condition was not significantly ameliorated by reperfusion times of up to 2 hours. This surprising and critical finding is illustrated in Fig. 5, where the microcirculatory stasis index was determined as a function of reperfusion times, 0, 20, and 120 minutes after the standard 90-minute focal ischemia. Since blood flow rapidly decreases at the onset of the focal occlusion, some of the erythrocytes trapped after 2 hours of reperfusion may actually have been in place for nearly 3.5 hours.
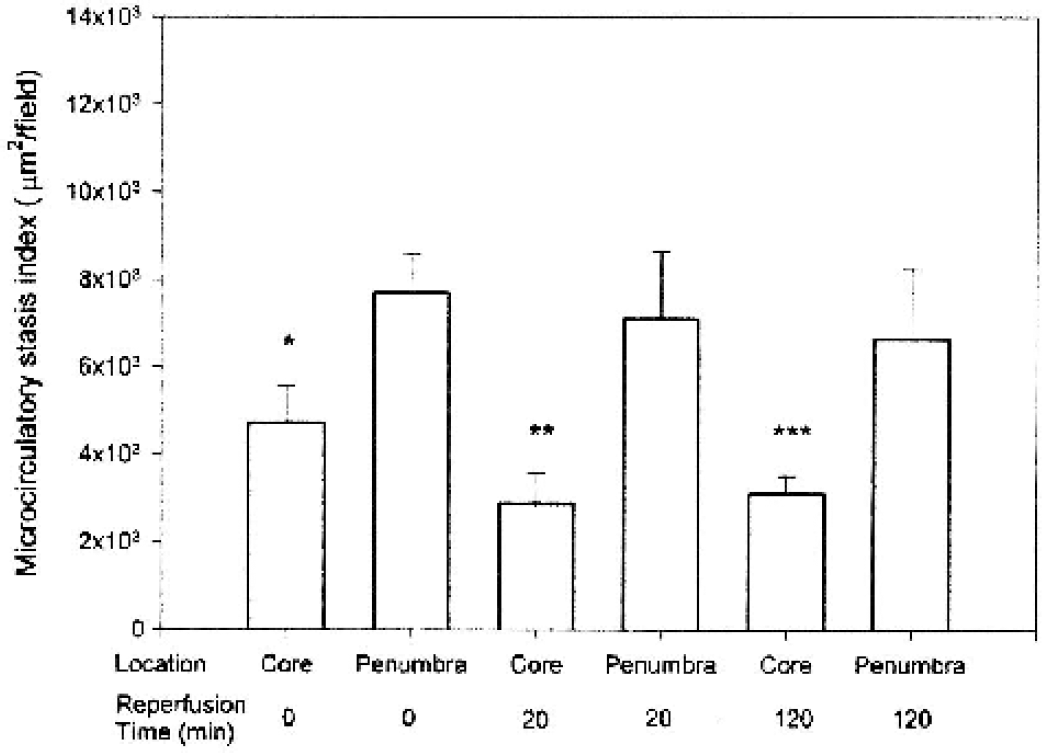
Microcirculatory stasis index following various reperfusion times in ischemic penumbra and core regions. Data are expressed as mean ± SD. Asterisks indicate a significant difference (P < 0.01, Scheffé multiple comparison) between core and penumbra of groups with reperfusion time of *0, **20, and ***120 minutes. No significant differences (P > 0.05) between microcirculatory stasis indices in penumbra or ischemic core were found among the three groups.
Double imaging of open and occluded vessels in penumbra of ischemic rats
The determination of the fraction of occluded vessels given previously has the shortcoming that different populations of rats must be used. Because this number is important in ultimately assessing how important the no-reflow condition might be in producing damage, a second approach was used. Cascade Blue-dextran (MW = 10,000, 0.017%/gelatin) was perfused after perfusion fixation, under the assumption that it would not leak out of the capillary bed rapidly and would not be internalized by erythrocytes. Figure 6a shows overlaid, true-color fluorescence images of the Cascade Blue together with trapped erythrocytes, thus showing open vessels and trapped erythrocytes in the same slice under identical fixation conditions. Based on these double-imaging studies in two animals, the percentage of occluded capillaries is estimated be 10% to 15% of the capillary bed.
Visualization, in the same slice, of trapped erythrocytes and the remainder of the capillary bed. Cascade Blue dextran was used in the perfusion solution to image the capillary bed, together with autofluorescence of erythrocytes. Images were emerged digitally.
While clearly showing the extent of open capillaries, and giving reasonable agreement with our other measure of no-reflow fraction, the method as used here suffers the shortcoming that the labeled dextran appears to infiltrate capillary areas between immobile erythrocytes, as demonstrated in Fig. 6b. This leads to an underestimation of the actual amount of capillary bed lost to normal circulation since the length of vessels between trapped erythrocytes, while accessible to dextran, is functionally useless. On the other hand, the experiments demonstrate directly that the occluded capillaries are still accessible to large molecules.
DISCUSSION
The results from this study demonstrate that NaBH4 treatment can be used to visualize erythrocytes trapped in the cerebral microvasculature. Combined with perfusion fixation, this novel method is useful to identify nonfunctional capillaries after transient interruption of cerebral blood flow. The most important findings of this study are that (1) after 90 minutes of focal cerebral ischemia, the no-reflow phenomenon involved an appreciable percentage of the capillary bed and was more severe in the ischemic penumbra than in the ischemic core; and (2) in vivo reperfusion for up to 120 minutes did little to restore the local preischemic circulatory conditions. Results from both double-labeling and microcirculatory stasis index measurement showed that from 10% to 15% of the capillary volume in ischemic penumbra remained occluded after reperfusion, a very significant reduction in an active capillary bed. The fact that an appreciable fraction of the capillary bed is functionally lost should lead to reduced oxygen and glucose levels in the territory normally served by the occluded capillaries and also to a buildup of CO2 and metabolic breakdown products such as lactate. In addition, it is likely that the trapped erythrocytes, held in a deprived environment for up to 3.5 hours, will lyse due to failure of the ATP-driven Na-K pump (Mentzer et al., 1975). This would release hemoglobin, which has direct cytotoxic effects (Alayash et al., 2001), into the local environment. These factors would be expected to produce stress on neurons and glia in the vicinity of the block, and the trapped erythrocytes or microcirculatory stasis may contribute to the developing damage in penumbra.
Our finding that the apparent density of erythrocyte trapping, assayed after 90 minutes of MCAO, is significantly greater in the penumbra than in the core is consistent with the possibility of erythrocyte lysis. That is, the degree of circulatory loss is greatest in the core, and erythrocytes in that region may be expected to deteriorate more rapidly because Na-K ATPase, which hydrolyzes ATP as energy, maintains the integrity of erythrocytes. The source of ATP in erythrocytes depends solely on glycolysis. Under ischemic conditions, the ATP in the core will be depleted more rapidly due to dramatic reduction of blood flow. This rapid depletion causes erythrocytes lysis, which in turn allows a dispersion of hemoglobin, leaving nothing left to fluoresce after NaBH4 treatment. In the penumbra, the cells would maintain their integrity for longer periods. Differences in other factors between core and penumbra could also differentially affect erythrocyte trapping in the two regions.
Based on the concept of postischemic erythrocyte trapping, interventions aimed merely at thrombus removal from the occluded artery to the ischemic region may not be sufficient to prevent delayed and developing injury in the penumbra, since the continued occlusion in the capillary bed may persist long after reperfusion. Therefore, therapeutic strategies to restore blood flow in the microvasculature as well as the arteries may provide substantially greater benefits. One way to achieve this goal is to relieve capillary compression by virtue of reducing edema in order to open up the occluded capillaries. Another possibility is to increase oxygen supply to the no-reflow vessels. As shown in Fig. 6b, 10,000-MW dextran can pass through erythrocyte-blocked capillaries. It is likely that small oxygen-carrying molecules, such as perfluorocarbons (artificial blood), would be able to penetrate the constricted vessels, providing oxygen to the penumbra region where, if left untreated, the neurons would remain vulnerable after reperfusion. Alternatively, one could also use albumin therapy, which has been shown recently to reverse stagnation, thrombosis, and corpuscular adherence within cortical venules in the reperfusion phase after focal ischemia (Belayev et al., 2002).
Several possible causes of the no-reflow phenomenon in brain have been proposed, including endothelial swelling (Fischer et al., 1977), capillary permeability changes (del Zoppo et al., 1986), perivascular astrocyte end-feet swelling (Aspey et al., 1989) and detachment (Cerisoli et al., 1981; Fischer et al., 1977), platelet activation (del Zoppo et al., 1986), leukocyte adhesion (Mori et al., 1992; Okada et al., 1994), and coagulation abnormalities (Thomas et al., 1993). There are also data showing increased adhesion ability of polymorphonuclear cells to capillary endothelia after focal cerebral ischemia and reperfusion (Mori et al., 1992; Okada et al., 1994). The experimental technique introduced here, in conjunction with other methods (e.g., blocking platelet activation or leukocyte adhesion), should be useful in future studies exploring this issue.
The use of NaBH4 treatment to enhance erythrocyte autofluorescence in conjunction with heparinized PBS perfusion is a powerful technique for visualizing capillaries that contain trapped erythrocytes. As a direct method to show microcirculation stasis, the method has the great advantage over previous approaches of providing a direct micromapping of the distribution of occluded vessels. Previous studies using carbon suspensions or fluorescent molecules as contrast enhancers, which can infiltrate spaces not available to erythrocytes, would likely underestimate the dysfunctional, postischemic capillary bed.