
Abstract
A delayed or secondary energy failure occurs during recovery from perinatal cerebral hypoxia–ischemia. The question remains as to whether the energy failure causes or accentuates the ultimate brain damage or is a consequence of cell death. To resolve the issue, 7-day postnatal rats underwent unilateral common carotid artery occlusion followed thereafter by systemic hypoxia with 8% oxygen for 2.5 hours. During recovery, the brains were quick frozen and individually processed for histology and the measurements of 1) high-energy phosphate reserves and 2) neuronal (MAP-2, SNAP-25) and glial (GFAP) proteins. Phosphocreatine (PCr) and ATP, initially depleted during hypoxia–ischemia, were partially restored during the first 18 hours of recovery, with secondary depletions at 24 and 48 hours. During the initial recovery phase (6 to 18 hours), there was a significant correlation between PCr and the histology score (0 to 3), but not for ATP. During the late recovery phase, there was a highly significant correlation between all measured metabolites and the damage score. Significant correlation also exhibited between the neuronal protein markers, MAP-2 and SNAP-25, and PCr as well as the sum of PCr and Cr at both phases of recovery. No correlation existed between the high-energy reserves and the glial protein marker, GFAP. The close correspondence of PCr to histologic brain damage and the loss of MAP-2 and SNAP-25 during both the early and late recovery intervals suggest evolving cellular destruction as the primary event, which precedes and leads to the secondary energy failure.
It has been proposed that a delayed or secondary energy failure occurs during the recovery period after perinatal cerebral hypoxia–ischemia, which causes or accentuates the ultimate brain damage. Reynolds and his research colleagues have championed the theory of a delayed cerebral energy failure, based initially upon research in newborn human infants: 31P magnetic resonance spectroscopy measurements of newborn human brain have shown an early restitution of the phosphorus spectra upon resuscitation from asphyxia, followed thereafter by a secondary decline in energy status, defined as a tissue depletion of phosphocreatine, ATP, or both compounds (Azzopardi et al., 1989; Hamilton et al., 1986; Hope et al., 1984). More recently, the same research group has demonstrated a similar delayed cerebral energy failure after hypoxia–ischemia in the newborn piglet, again using magnetic resonance spectroscopy (Lorek et al., 1994; Penrice et al., 1997). In these human and animal experiments, the investigators showed that phosphocreatine/inorganic phosphorus (Pi) ratios were depressed initially by hypoxia–ischemia only to normalize in the early recovery interval. Thereafter, a secondary decrease in the ratio occurred at 24 and 48 hours of recovery. From the human and animals studies, these investigators have concluded that the secondary failure in cerebral energy status after hypoxia–ischemia is a significant contributor to the ultimate brain damage and neurologic compromise (Taylor et al., 1999; Williams et al., 1992). The phenomenon of a secondary depletion of high-energy phosphate reserves also has been observed in adult experimental animals and heralds the onset of delayed neuronal necrosis (Munekata and Hossmann, 1987; Pettigrew et al., 1988; Selman et al., 1990).
Secondary depletions in both phosphocreatine and ATP during recovery from hypoxia–ischemia also have been observed in the immature rat (Blumberg et al., 1997; Palmer et al., 1990; Vannucci et al., 1998b; Yager et al., 1992). Based on sequential neuropathologic analyses of immature rats during the early recovery interval after hypoxia–ischemia (Rice et al., 1981; Towfighi et al., 1995), we speculated that the secondary depletion of high-energy phosphate reserves follows rather than precedes brain tissue necrosis. We further suggested that the secondary decreases in both phosphocreatine and ATP do not denote a secondary energy failure of the brain but rather reflect a loss of total creatine and adenine nucleotides from the tissue and their conversion to creatinine and adenosine and other metabolites, respectively. The reduction in phosphocreatine appears to occur as a mass action effect of the creatine phosphokinase equilibrium reaction, whereas the reduction in ATP appears to occur as a mass action effect of the adenylate kinase equilibrium reaction.
To resolve the controversy of the potential contribution of a delayed or secondary energy failure to perinatal hypoxic–ischemic brain damage, we designed an experiment that would allow for the determination of the concentrations of high-energy phosphate reserves, protein markers of neuronal and glial integrity, and neuropathologic status in individual brain specimens of immature rats having undergone cerebral hypoxia–ischemia. The analysis of multiple variables derived from the same brain allowed for conclusions regarding the contribution of any secondary energy depletion to the ultimate extent of histopathologic damage.
MATERIALS AND METHODS
The experiments described here were reviewed by the Animal Care and Use Committee of The Pennsylvania State University College of Medicine and approved on May 28, 1998. Dated, pregnant Wistar rats were purchased from a commercial breeder (Charles River Laboratories, Wilmington, MA) and housed in individual cages. Offspring, delivered vaginally, were reduced to litters of 10 and reared with their dams until time of initial experimentation on postnatal day 7.
Induction of cerebral hypoxia–ischemia
To produce brain damage caused by cerebral hypoxia–ischemia, 7-day postnatal rats underwent permanent unilateral (right) common carotid artery ligation, followed by a recovery interval of 3 to 4 hours, as previously described (Rice et al., 1981). After a 20-minute prewarming period, the animals were subjected to systemic hypoxia with 8% oxygen–92% nitrogen for 2 hours. This duration of hypoxia–ischemia typically is associated with infarction of the cerebral hemisphere ipsilateral to the carotid artery occlusion (Rice et al., 1981; Towfighi et al., 1995; Vannucci et al., 1997). Either at the terminus of hypoxia–ischemia or at specific intervals of recovery for up to 48 hours, randomized animals were decapitated directly into isopentane, −40°C. Control animals included littermates that were not subjected to cerebral hypoxia–ischemia but that were quick-frozen at the same intervals as the experimental animals.
Preparation of brain specimens
The skull and meninges of each rat pup were carefully removed from the underlying brain in a cold box maintained at −20°C. Thereafter, the brain was transected in the coronal plane at the level of the middorsal hippocampus (Fig. 1). The anterior portion of both cerebral hemispheres were further processed for neuropathologic analysis (see below). The cerebral hemispheres of the posterior brain specimen were separated, and two tissue specimens (approximately 50 mg each) were taken from an area within the distribution of the middle cerebral artery on each side. One tissue sample from each hemisphere was powdered under liquid nitrogen, and weighed on a microanalytical balance, for the preparation of perchloric acid extracts, as previously described (Vannucci and Duffy, 1974). Concentrations of phosphocreatine, creatine, ATP, ADP, and AMP were analyzed by specific enzymatic, fluorometric techniques (Lowry and Passonneau, 1972; Palmer et al., 1990; Yager et al., 1992). The energy charge potential (ECP) was calculated accordingly to the equation: ECP = ATP + 0.5 ADP/ATP + ADP + AMP (Atkinson, 1968). The other pair of tissue specimens derived from each cerebral hemisphere was further processed for the measurement of specific neuronal and glial markers by Western blot analysis.
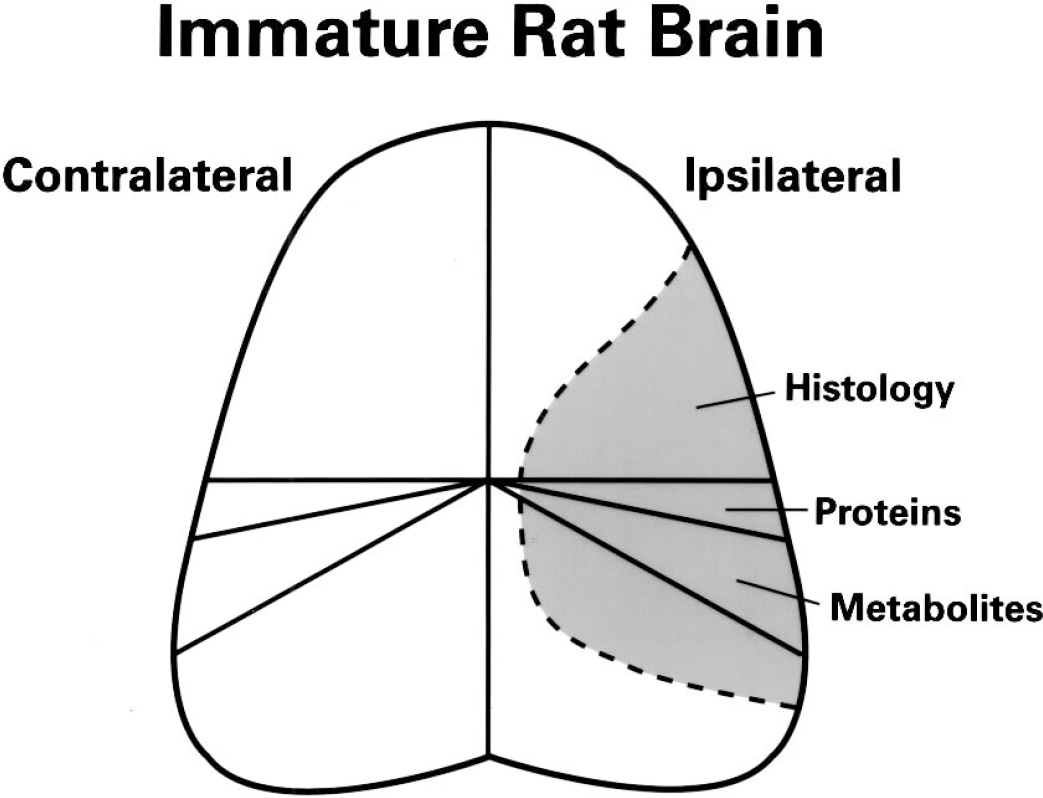
Manner of dissection of immature rat brain. The frozen brain was transected in the coronal plane at the level of the hippocampus. The anterior specimen was processed for histopathologic analysis. The posterior specimen was processed for the measurement of high-energy phosphate reserves and neuronal and glial protein markers. The shaded gray area represents the region of maximal damage of the cerebral hemisphere ipsilateral to the common carotid arterial occlusion.
Measurement of neuronal and glial protein markers
Paired tissue samples were homogenized in TES (Tris/EDTA/sucrose, pH 7.4) with protease inhibitors and sonicated. Protein was determined using the BCA reagent (Sigma, St. Louis, MO). Total homogenates (20 μg protein) were solubilized and separated on 10% SDS gels by electrophoresis, as previously described (Vannucci, 1994). Gels were electrophoretically transferred to nitrocellulose filters. Glial fibrillary acidic protein (GFAP), microtubule-associated protein (MAP-2), and the synaptic vesicle protein, SNAP-25, were analyzed in paired ipsilateral and contralateral hemispheres, and in age-matched controls by Western blot, as previously described (Penrice et al., 1997). GFAP and MAP-2 were detected with mouse monoclonal antibodies from Sigma Immunochemicals (St. Louis, MO); SNAP-25 was detected with a mouse monoclonal antibody, clone SP-14, provided as a gift from Dr. Peter Davies, Albert Einstein Medical College, New York, NY). Intensity of signal was determined by image analysis of the autoradiograms using NIH Image 1.64, and values expressed as ipsilateral/contralateral ratio.
Neuropathologic analysis
Histology was performed only in rats with 6 to 48 hours of recovery. The frozen brain tissue (Fig. 1) was coronally sectioned into 2-mm slices in −20°C, and the slice containing posterior cerebral cortex, white matter, dorsal hippocampus, thalamus, and median eminence was selected. Frozen sections, 10-μm thick, were obtained and stained with hematoxylin and eosin for microscopic examination. For the sake of uniformity, only the areas containing neurons with eosinophilic perikarya, pyknotic nuclei, or karyorrhexis were considered damaged. The following damage score is used: 0, normal; 1 or mild, patchy areas of damage; 2 or moderate, confluent areas of damage involving one-half or less of the area of ipsilateral hemisphere; 3 or severe, confluent areas of damage involving greater than half of the cerebral hemisphere (including the animals in which lesions extended to the opposite hemisphere).
Statistical analyses
Statistical analyses of the data included two-way analysis of variance, with Tukey-Kramer post hoc adjustments, used for sequential data. Coefficient analyses also were conducted.
RESULTS
High-energy phosphate reserves during and after cerebral hypoxia–ischemia are shown in Figs. 2 and 3. During hypoxia–ischemia, phosphocreatine in the cerebral hemisphere ipsilateral to the carotid artery occlusion decreased to 5% of control, with partial restoration (55% to 80% of control) of the metabolite between 6 and 18 hours of recovery. Thereafter, a secondary depletion of the metabolite occurred at 24 and 48 hours of recovery. The concentration of creatine increased during hypoxia–ischemia (data not shown), such that the total creatine pool (phosphocreatine + creatine) decreased only slightly (–15%). Thereafter, the total creatine pool remained relatively stable for up to 18 hours, after which there was a progressive decline coincident with the secondary decrease in phosphocreatine. Thus, the secondary loss of the total creatine pool was the combined effect of losses of both phosphocreatine and creatine. Indeed, phosphocreatine/creatine ratios were minimally decreased from the control value (0.55) at 24 and 48 hours.
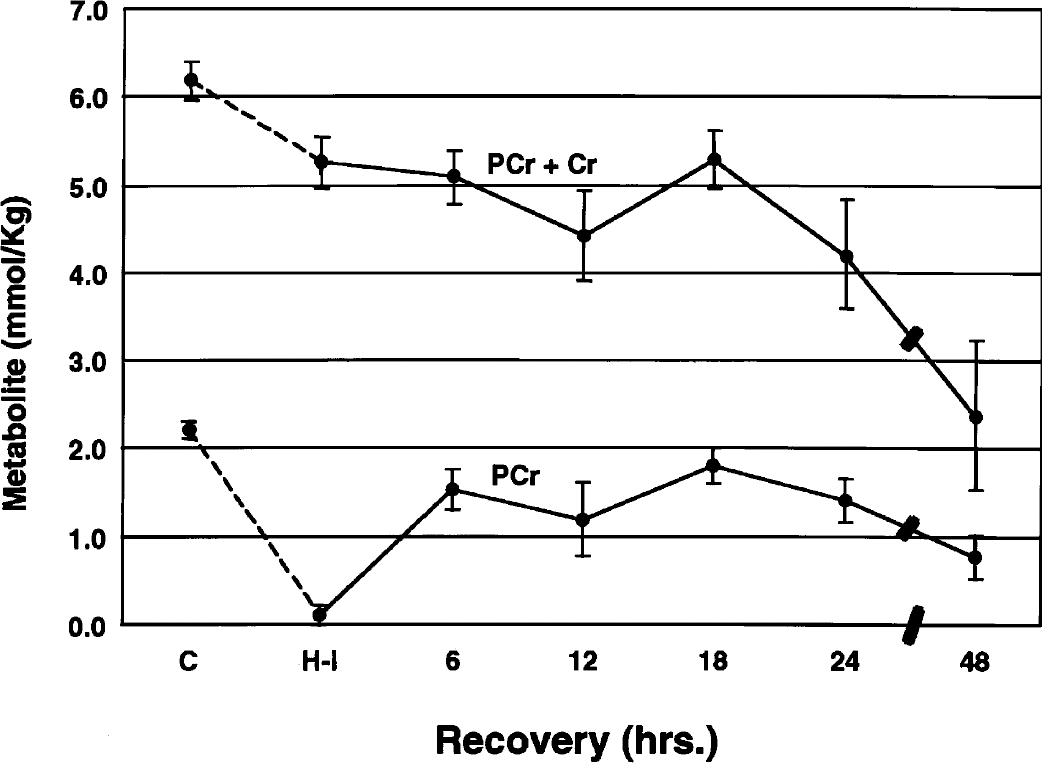
Concentrations of phosphocreatine (PCr) and total creatine (PCr + Cr) during and after hypoxia–ischemia in the immature rat. Symbols represent means ± 1 SD for 5 to 11 animals at the terminus of hypoxia–ischemia and for up to 48 hours of recovery. C, control; H-I, hypoxia–ischemia.
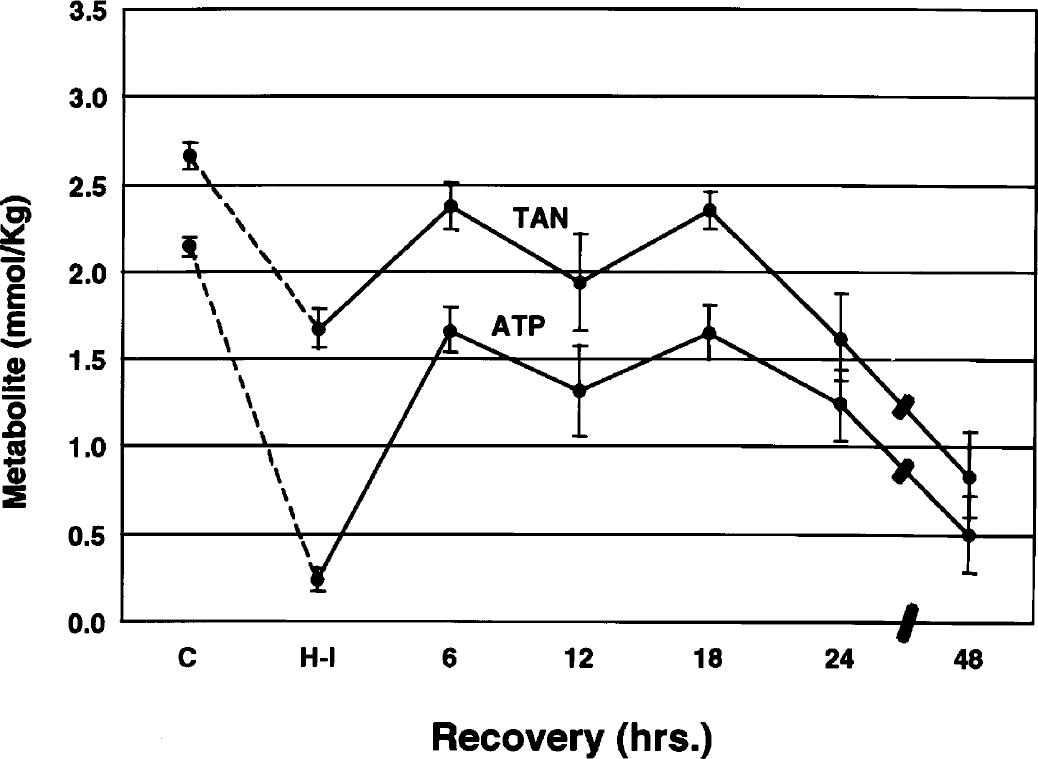
Concentrations of ATP and total adenine nucleotides (TAN) during and after hypoxia–ischemia in the immature rat symbols represent means ± 1 SD of 5 to 11 animals at the terminus of hypoxia–ischemia and for up to 48 hours of recovery. C, control; H-I, hypoxia–ischemia.
Like phosphocreatine, ATP decreased substantially during hypoxia–ischemia, with a partial restitution between 6 and 18 hours of recovery (Fig. 3). Thereafter, there was a progressive secondary depletion of the metabolite for up to 48 hours. Concentrations of the total adenine nucleotide (TAN) pool paralleled closely the changes in ATP. These parallel changes reflected minimal alterations in ADP and AMP during the entire recovery interval.
The ECP was 0.90 ± 0.01 in control immature rats and decreased to 0.31 ± 0.08 during hypoxia–ischemia (P < 0.001). The ECP remained below the control value at 6 and 12 hours of recovery (P < 0.01), thereafter reverting to the normal range (0.81 to 0.88). Only at 48 hours was the value secondarily decreased (0.71 ± 0.12; P < 0.01), when tissue injury was advanced.
Figures 4 and 5 depict concentrations of phosphocreatine and ATP in relation to the damage score of the brains of individual animals. The data were analyzed collectively during two intervals of recovery: specifically, 6 to 18 hours and 24 to 48 hours. These intervals were chosen because the high-energy phosphate reserves were relatively stable during the early recovery phase but exhibited progressive decreases during the late recovery phase (see above). Correlation coefficients analyses for these metabolites as well as for TAN and the sum of phosphocreatine and creatine are shown in Table 1. During the initial recovery phase (6 to 18 hours), there was a significant correlation between phosphocreatine and the damage score, but not for ATP. During the later recovery phase, there was a highly significant correlation between all measured metabolites and the damage score (P < 0.001).
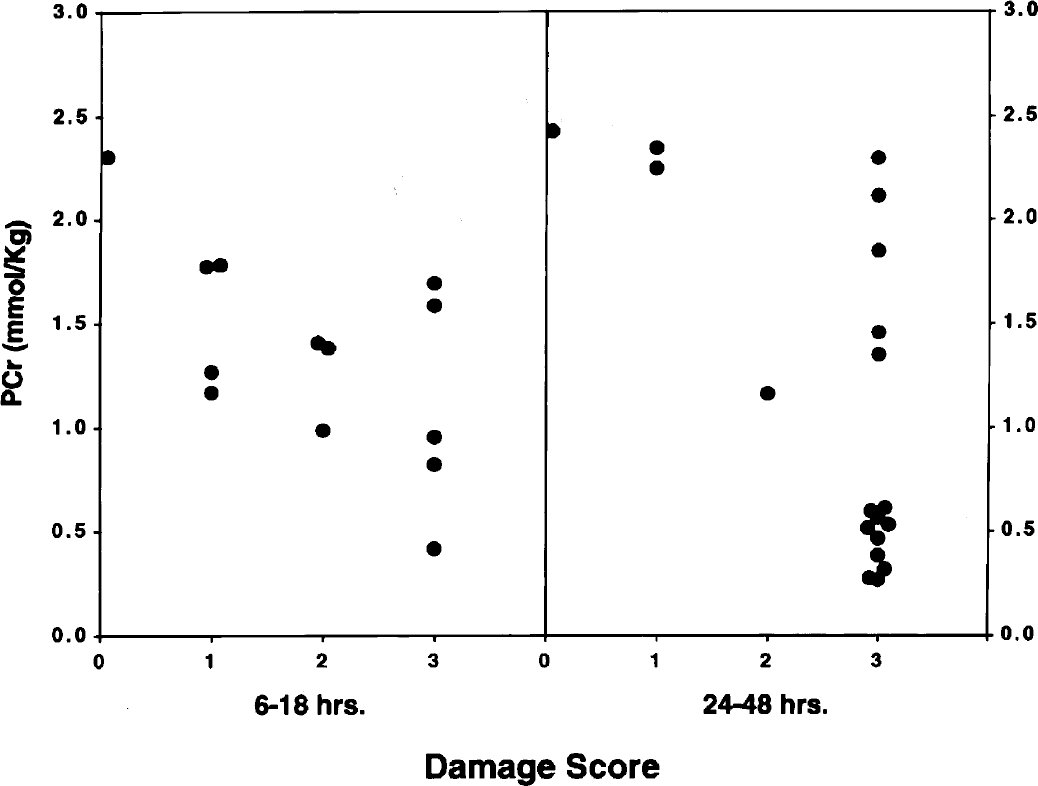
Relationship between phosphocreatine (PCr) and brain damage score at 6 to 18 and 24 to 48 hours of recovery from hypoxia–ischemia in the immature rat. Symbols represent individual brains. The determination of the damage score is described in Materials and Methods.
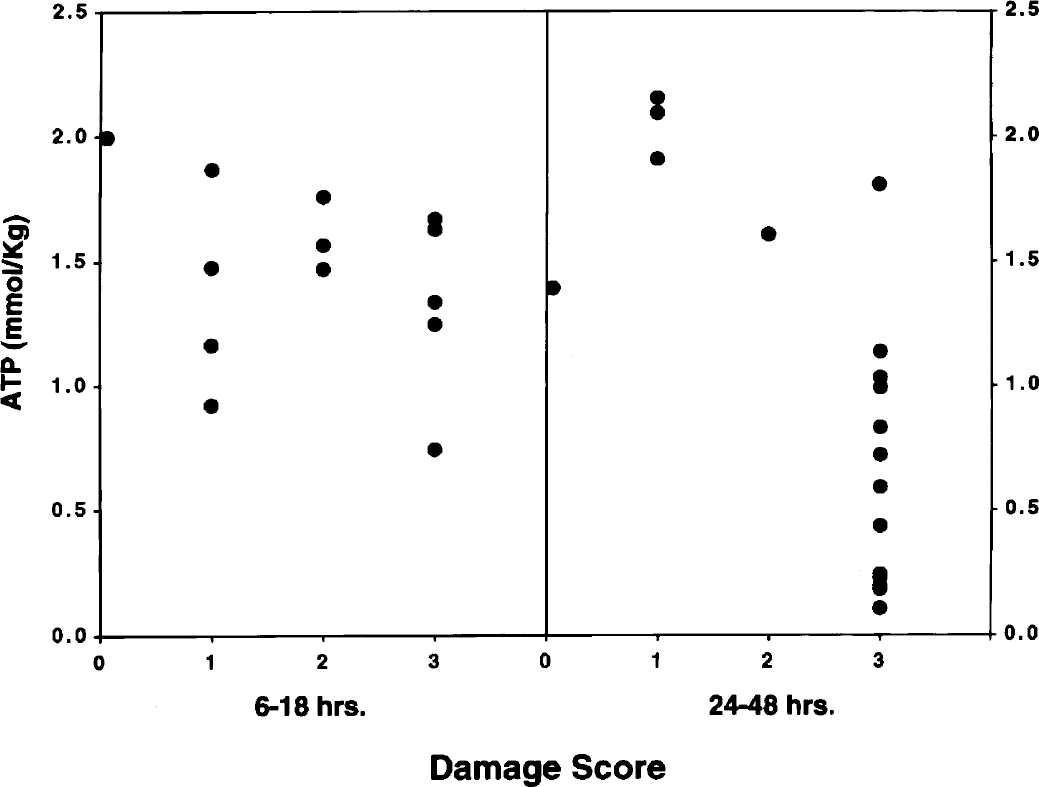
Relationship between ATP and brain damage score at 6 to 18 and 24 to 48 hours of recovery from hypoxia–ischemia in the immature rat. Symbols represent individual brains. The determination of the damage score is described in Materials and Methods.
Correlation coefficients of metabolites vs damage scores during recovery from hypoxia–ischemia
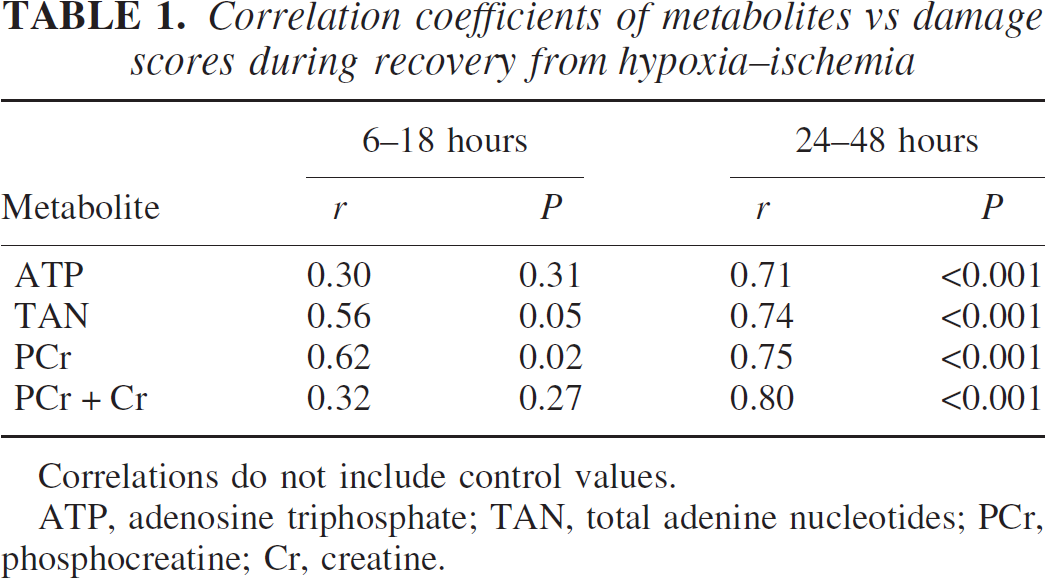
Correlations do not include control values.
ATP, adenosine triphosphate; TAN, total adenine nucleotides; PCr, phosphocreatine; Cr, creatine.
To further interpret alterations in high-energy phosphate reserves in the context of neuronal and astroglial responses to hypoxia–ischemia, adjacent tissue samples were subjected to Western blot analysis for neuronal markers, MAP-2 and SNAP-25, and the glial protein, GFAP. MAP-2 is commonly used as a marker of neuronal damage in adult and immature models of ischemia, where loss of MAP-2 immunodetection is an early observation after the insult (Kitagawa et al., 1989; Ota et al., 1997). We have previously utilized SNAP-25 as a marker of neuronal maturation and synaptic density (Vannucci et al., 1998a), and have reported significant loss of SNAP-25 protein in the damaged cerebral hemisphere at 24 hours of recovery from hypoxia–ischemia (Vannucci et al., 1996). Figure 6 (top) is a representative Western blot for MAP-2 and SNAP-25 in paired ipsilateral and contralateral hemispheres at 0, 6, and 18 hours of recovery, relative to an age-matched control brain. The loss of neuronal proteins is apparent at 6 hours of recovery, and is very pronounced by 18 hours of recovery. The response of the glial protein, GFAP, at 12, 18, and 24 hours of recovery relative to age-matched control animals is depicted in the lower blot. After hypoxia–ischemia, GFAP in the hypoxic–ischemic hemisphere was detected as multiple bands, indicative of protein degradation into smaller immunoreactive subunits, apparent as early as 12 hours of recovery.
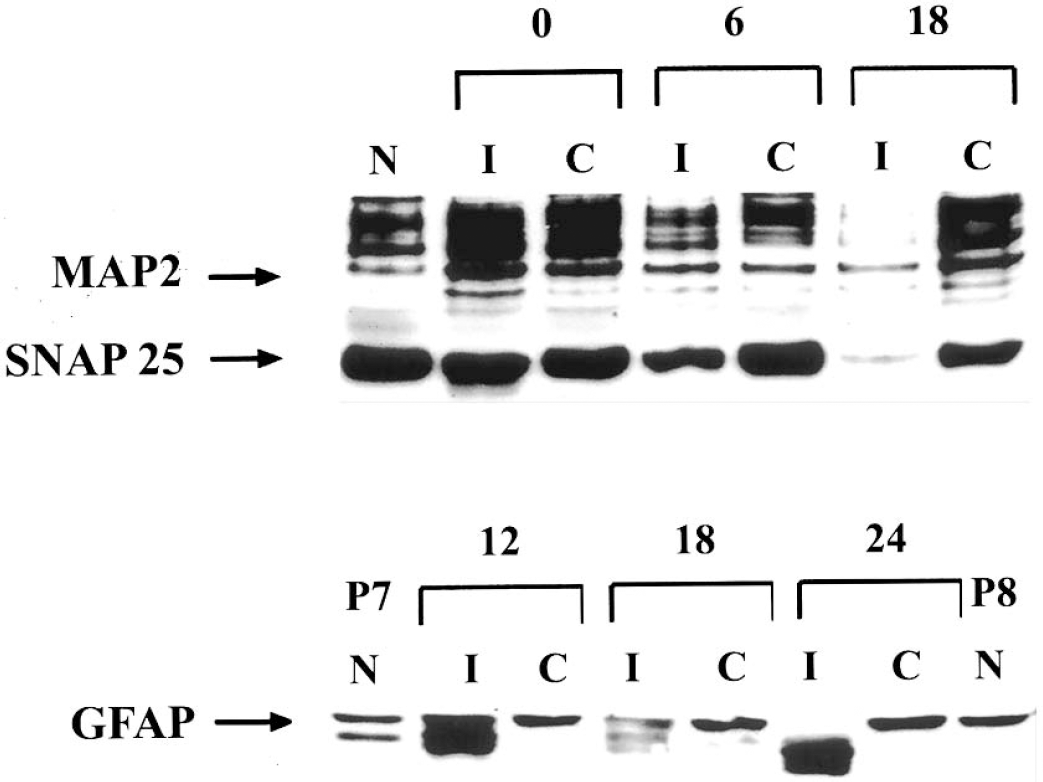
Western blot analysis of MAP-2, SNAP-25, and GFAP during recovery from hypoxia–ischemia in the immature rat. Homogenates were prepared from paired ipsilateral (I) and contralateral (C) hemispheres of rats at specific intervals of recovery from 2 hours of hypoxia–ischemia, and from untouched, age-matched controls (N), as described in Materials and Methods. Twenty-microgram samples were separated by SDS-PAGE and analyzed for neuronal markers, MAP-2, and SNAP-25 at 0, 6, and 18 hours of recovery (top), or for GFAP at 12, 18, and 24 hours of recovery (bottom).
The relationships between the high-energy phosphate reserves and MAP-2 are shown in Fig. 7 and Table 2. Significant correlations existed between MAP-2 and phosphocreatine as well as the sum of phosphocreatine and creatine at both 16 to 18 and 24 to 48 hours of recovery, with a trend towards statistical significance for ATP and total adenine nucleotides only at 24 to 48 hours of recovery. Similar relationships were obtained for SNAP-25 (data not shown).
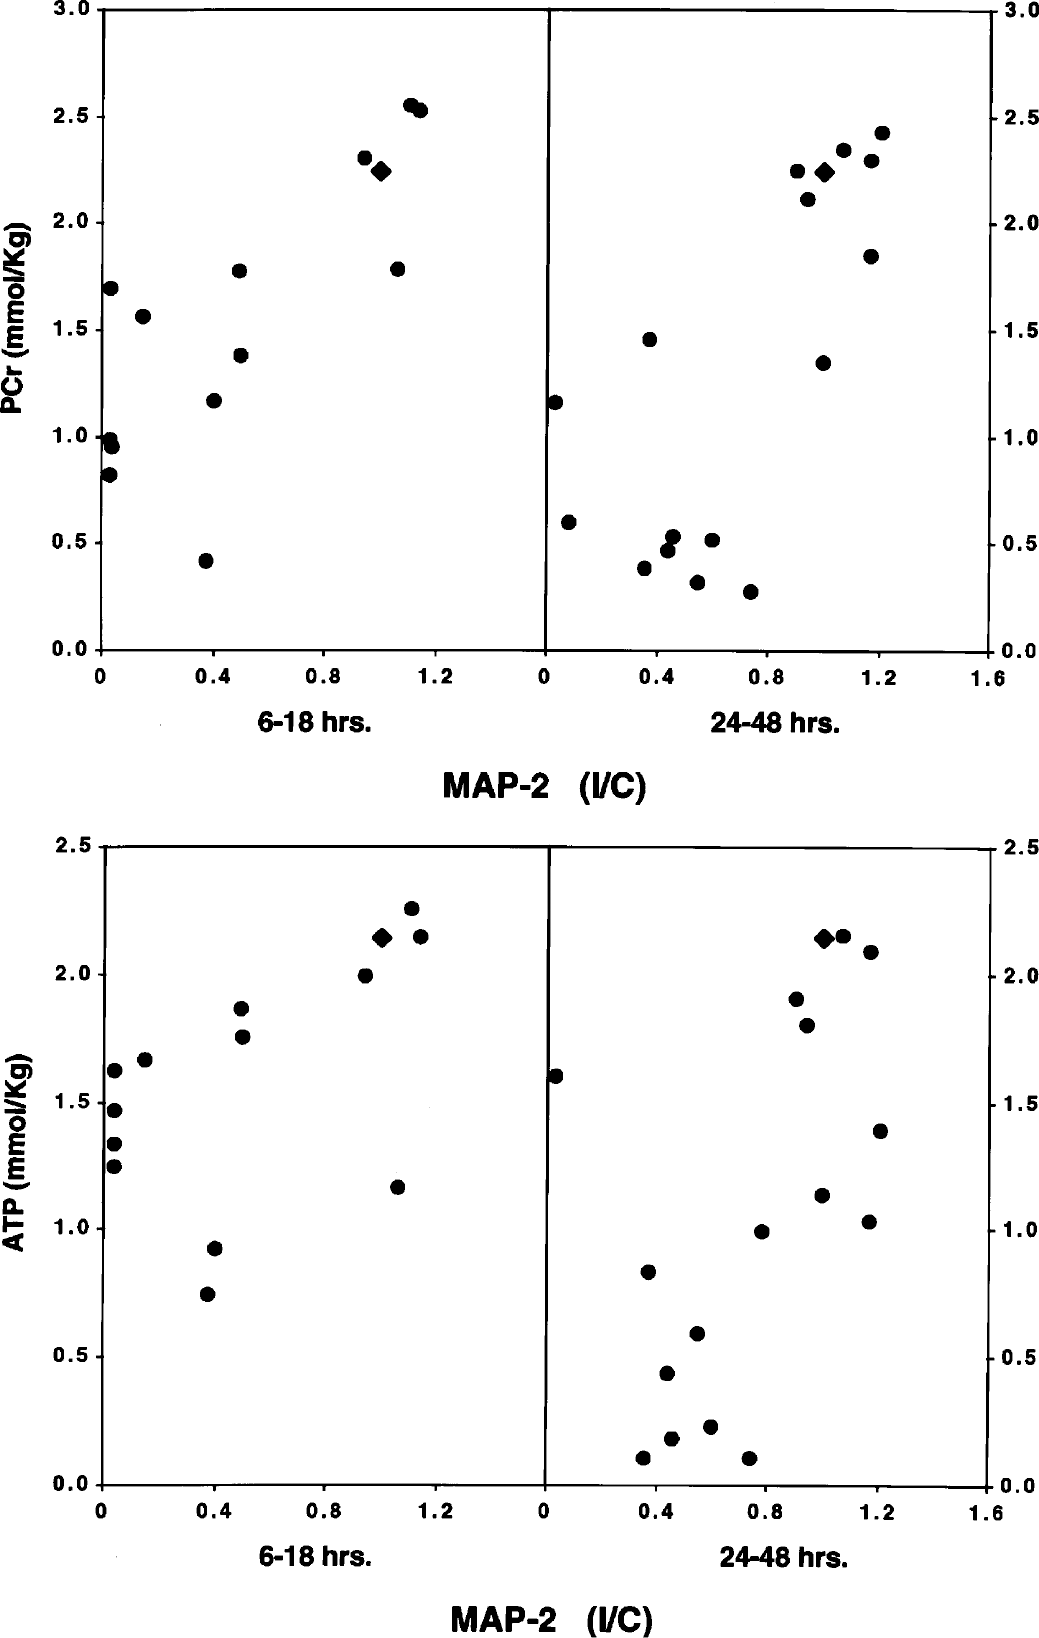
Relationship between phosphocreatine (PCr) or ATP and MAP-2 at 6 to 18 and 24 to 48 hours of recovery from hypoxia–ischemia in the immature rat. Values represent individual brains. Each MAP-2 value represents the concentration of the protein in the cerebral hemisphere ipsilateral to the common carotid artery occlusion divided by its concentration in the contralateral cerebral hemisphere. Accordingly, the lower the ratio, the greater the MAP-2 loss in the ipsilateral hemisphere. The triangle denotes the control relationship.
Correlation coefficients of metabolites vs MAP-2 during recovery from hypoxia–ischemia
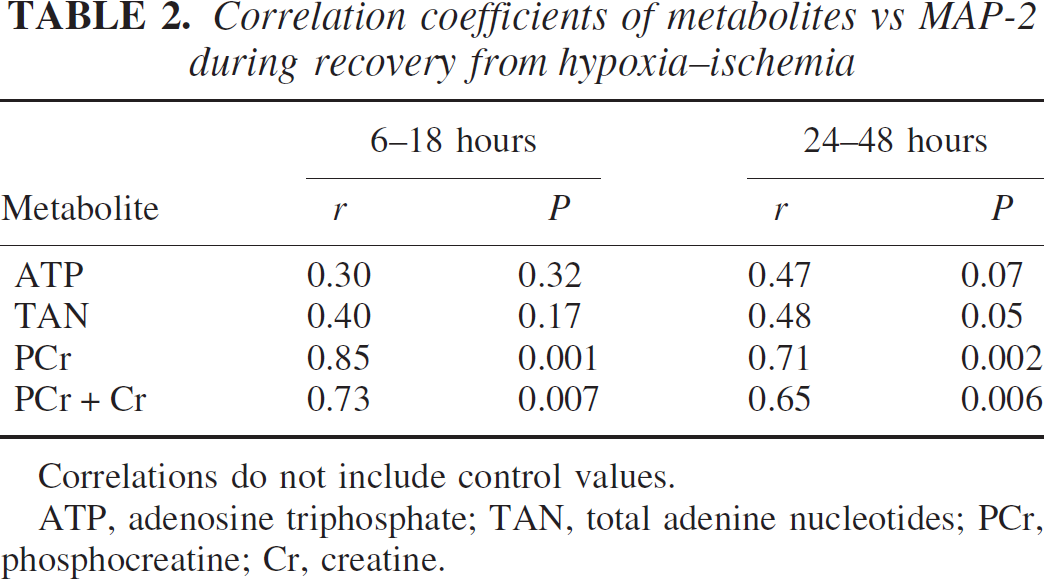
Correlations do not include control values.
ATP, adenosine triphosphate; TAN, total adenine nucleotides; PCr, phosphocreatine; Cr, creatine.
The relationships between the high-energy phosphate reserves and total GFAP are shown in Fig. 8 and Table 3. A poor correlation existed between total GFAP and any measured metabolite at both the 6- to 18-hour and 24- to 48-hour intervals of recovery from hypoxia–ischemia. However, this analysis only addressed total GFAP content and did not account for breakdown of the protein into smaller bands.
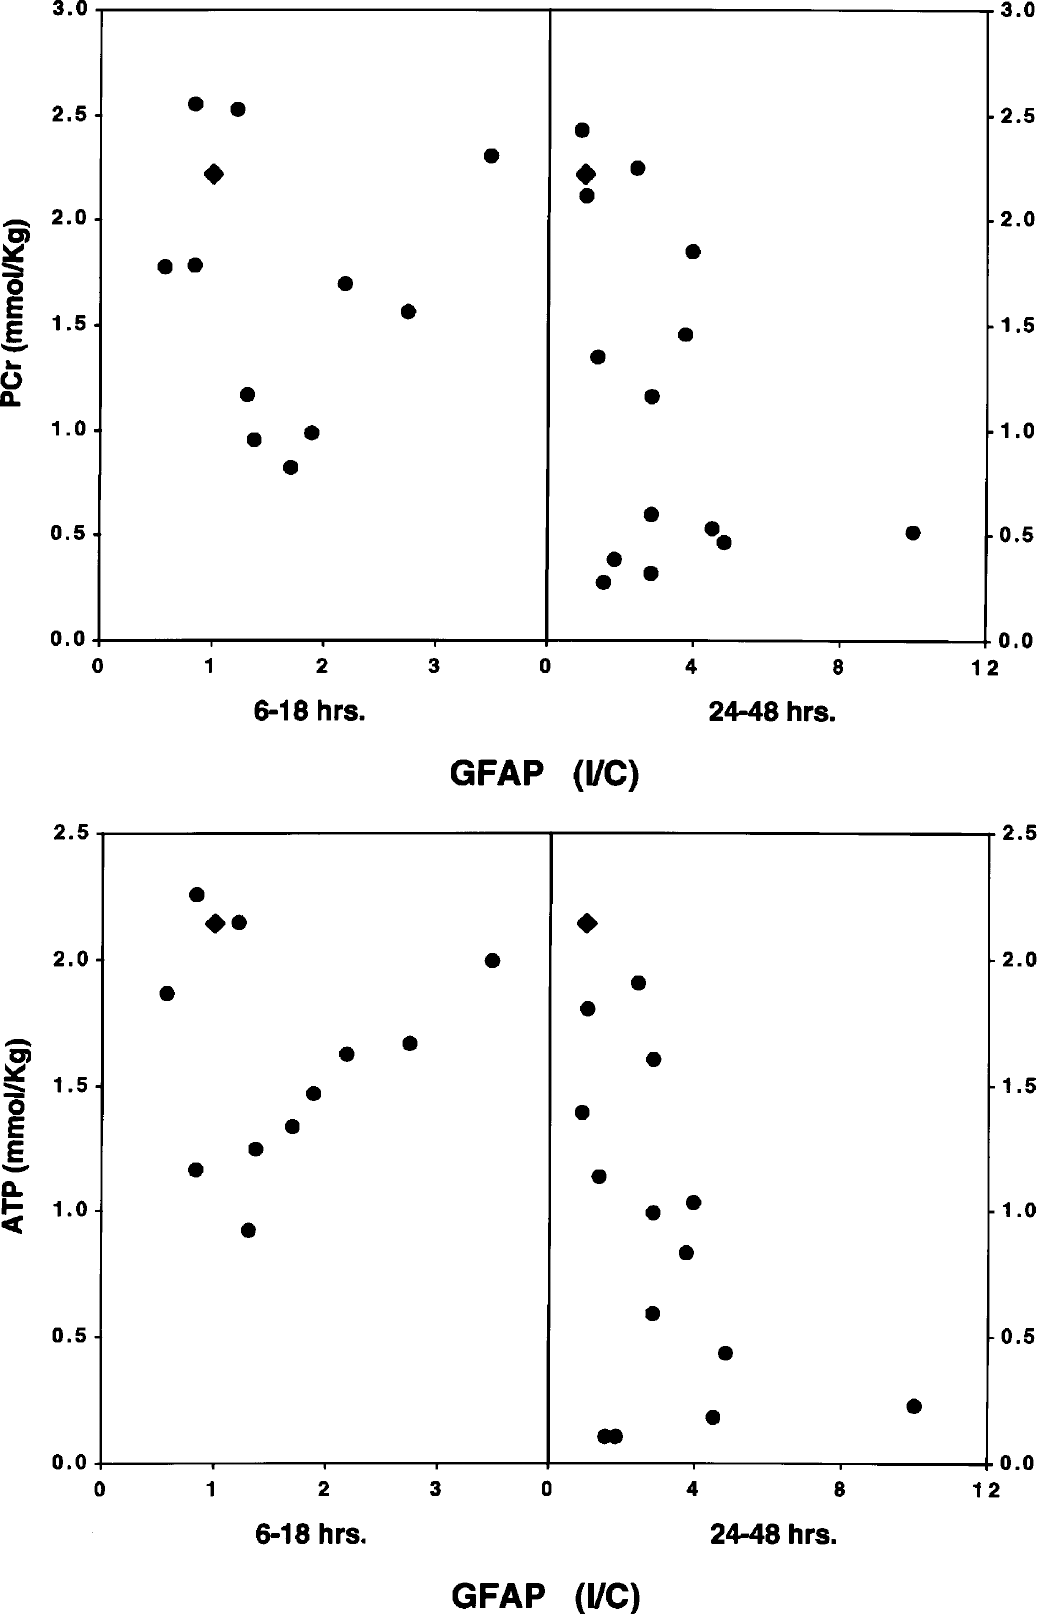
Relationship between phosphocreatine (PCr) or ATP and GFAP at 6 to 18 and 24 to 48 hours of recovery from hypoxia–ischemia in the immature rat. Values represent individual brains. Each GFAP value represents the concentration of the protein in the cerebral hemisphere ipsilateral to the common carotid artery occlusion divided by its concentration in the contralateral cerebral hemisphere. Accordingly, the lower the ratio, the greater the GFAP loss in the ipsilateral hemisphere. The triangle denotes the control relationship.
Correlation coefficients of metabolites vs GFAP during recovery from hypoxia–ischemia
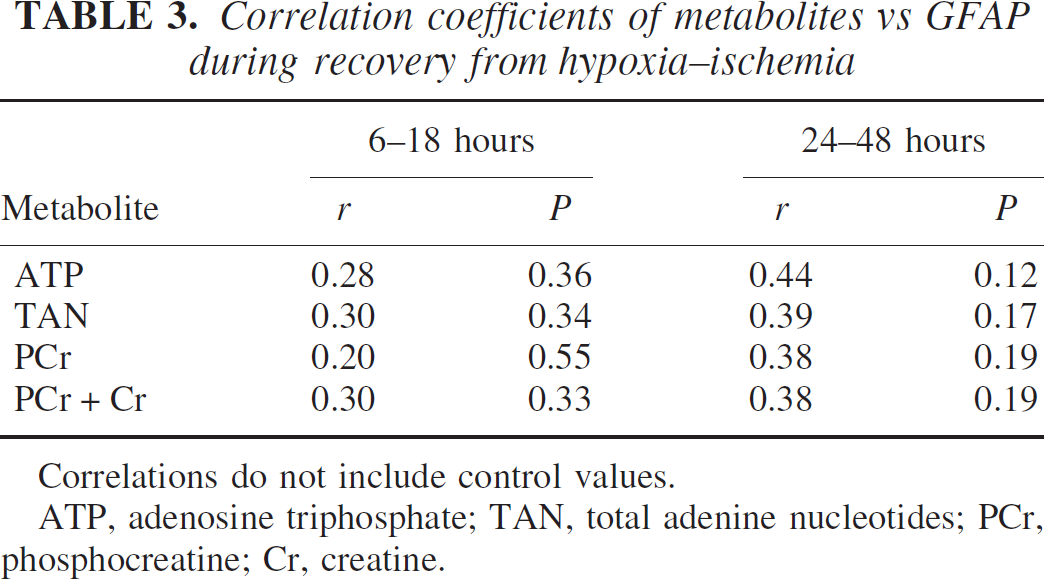
Correlations do not include control values.
ATP, adenosine triphosphate; TAN, total adenine nucleotides; PCr, phosphocreatine; Cr, creatine.
The relationships between MAP-2 and damage score of individual brains also was ascertained. As anticipated, a close correspondence existed between these two variables, especially during the initial recovery phase (6 to 18 hours) (r = 0.84; P < 0.01) but also during the late recovery phase (24 to 48 hours) (r = 0.51; P < 0.05). Similar relationships were obtained for SNAP-25 but not for total GFAP because there was a poor (nonsignificant) correlation between the glial protein and damage score at both 6 to 18 hours and 24 to 48 hours of recovery from hypoxia–ischemia (see Discussion).
DISCUSSION
As described in the Introduction, there is a debate as to whether or not the secondary energy failure that follows perinatal cerebral hypoxia–ischemia is a contributor to the ultimate brain damage. The present investigation was designed to answer this important question, the resolution of which has obvious therapeutic implications. The rationale for the experiments was the premise that if the process of cellular destruction is occurring at a time when high-energy phosphate reserves are at least temporarily restored, then the secondary energy failure is a consequence of rather than a contributor to tissue injury. Collectively, the data show variable correlations between high-energy phosphate reserves and both the severity of tissue injury, seen histologically, and markers of neuronal or glial integrity. However, separation of the recovery interval after hypoxia–ischemia into early and late phases provides insight into the mechanisms whereby brain damage occurs.
During the early recovery phase (6 to 18 hours), when the high-energy reserves were at least partially restored, there was a significant direct correlation between the concentration of phosphocreatine and both the severity of the tissue injury and the loss of the neuronal protein markers, MAP-2 and SNAP-25. No correlation existed between ATP and these variables. We interpret the close correspondence of phosphocreatine to brain damage and the loss of MAP-2 and SNAP-25 during this early interval as evidence for evolving neuronal destruction as the primary event, during which phosphocreatine is partially depleted to maintain ATP concentrations stable in the face of mitochondrial dysfunction. In this regard, phosphocreatine is closely linked to ATP via the creatine phosphokinase equilibrium reaction (Vannucci, 1990). Thus, it is not surprising that phosphocreatine was more closely associated with the evolving brain damage during the early recovery phase than was ATP.
The ECP, a relationship conceived by Atkinson (1968), is derived from the relationship of ATP, ADP, and AMP to the adenylate kinase equilibrium reaction and to the total adenine nucleotide pool. Atkinson (1968) suggested that the ECP must be maintained within a very narrow range (0.92 to 0.93) in all cells in order that exergonic and endergonic reactions proceed in a delicate balance. Any deviation from the equilibrium value would be indicative of a major disruption of the energy status of the cell. The findings reported here indicate that such an equilibrium can be altered and rapidly reestablished despite a persisting disturbance in ATP and evolving tissue injury. The reason for the discrepancy presumably relates to the mass action effect of altered ATP on the concentrations of ADP and AMP, which apparently can be maintained in relative equilibrium even under pathologic conditions and in the same fashion as phosphocreatine and creatine.
The lack of correlation between total GFAP protein content and any measured metabolite over the initial 48 hours of recovery from hypoxia–ischemia is not surprising, given the complexity of the astroglial response to injury. Mild to moderate cerebral ischemic insults result in neuronal necrosis within the ischemic core in association with surviving astrocytes that become transformed into reactive astrocytes with heightened GFAP expression (Petito et al., 1990). More severe insults, such as routinely observed after 2 hours of hypoxia–ischemia in the immature rat, result in damage to all cellular elements within the ischemic region, culminating in frank infarction with the formation of a gliotic scar at the border. The transition from the detection of GFAP as a single band on the Western blot shown in Fig. 6 to multiple bands in the ipsilateral hemisphere is suggestive of early cell damage. Acidotic damage to astrocytes involves disruption of the cytoskeletal architecture (Norenberg, 1994), which could result in the fragmentation of GFAP protein seen early in recovery from hypoxia–ischemia. By 24 to 48 hours of recovery, the most severely damaged animals exhibited the lowest MAP-2 and SNAP-25 content but greatly elevated GFAP content, consistent with a delayed gliosis.
The metabolic alterations described here are consistent with the evolving morphologic abnormalities that characterize the immature rat model of perinatal hypoxic–ischemic brain damage (Rice et al., 1981; Towfighi et al., 1995). Towfighi et al. (1995) studied the temporal evolution of the neuropathologic changes in immature rats subjected to a similar interval of hypoxia–ischemia as rat pups in the present investigation. In the Towfighi et al. study (1995), 90% of the rats developed infarcts in the cerebral hemisphere ipsilateral to the common carotid artery occlusion. Early neuronal alterations (clear perikarya; chromatin condensation) were seen immediately after reoxygenation of the animals. By 4 to 8 hours of recovery, pyknotic or karyorrhectic nuclei were prominent, and the cytoplasm was eosinophilic. At 24 hours of recovery, an infarct was fully developed, with coagulation necrosis involving both gray and white matter structures. Continued tissue dissolution occurred thereafter. Thus, the brain damage that characterizes 2 or more hours of hypoxia–ischemia in the immature rat is already present immediately upon resuscitation and evolves into complete infarction within 24 hours of recovery (see also Rice et al., 1981). Accordingly, it is not surprising that by 24 to 48 hours of recovery, there is a major secondary depletion of high-energy phosphate reserves and associated metabolites (Table 1). Furthermore, the early histopathologic alterations clearly precede the onset of the secondary energy failure, at least in the immature rat model.
As briefly discussed in the Introduction, the secondary decreases in both phosphocreatine and ATP in the immature rat model occur concurrent with a loss of total creatine and the adenine nucleotides (Figs. 2 and 3). Presumably, creatine is converted to creatinine and the adenine nucleotides converted to adenosine and other metabolites. The loss of multiple metabolites from the tissue supports our conclusion that the secondary energy depletion is a consequence rather than a cause of cellular destruction. A similar secondary depletion in the total adenylate pool, including ATP, has been observed in adult mouse brain subjected to transient focal ischemia (Paschen et al., 2000). These investigators also concluded that the energy disturbances resulted from enzymatic degradation or from washout brought about by leaky (damaged) cell membranes.
Studies in both adult and immature animals indicate that during the reperfusion interval after hypoxia–ischemia, mitochondrial dysfunction plays a prominent role in the ultimate cellular death (Fiskum et al., 1999; Siesjö et al., 1999). Despite temporary but often incomplete restorations of phosphocreatine and ATP (Figs. 2 and 3), functional and anatomic mitochondrial integrity is compromised, owing primarily to a calcium (Ca++) overload, initiated during the hypoxic–ischemic interval, and to the generation of oxygen reactive species (Bagenholm et al., 1998; Bona et al., 1999; Vannucci et al., 2001). These perturbations lead to an uncoupling of oxidative phosphorylation as well as to an activation of degradative enzymes, including phospholipases, proteases, and endonucleases, which activities cause widespread destruction of cellular and subcellular membranes and macromolecules (Vannucci, 1990). The uncoupled oxidative phosphorylation combined with a Ca++ and oxygen reactive species disruption of ATP synthase leads to compromised ATP production, which concurrent with continued energy demand, ultimately results in a secondary energy failure (Gilland et al., 1998; Vannucci et al., 1994). Even in the absence of uncoupled oxidative phosphorylation, mitochondrial permeability transition pores appear, allowing for leakage of cytochrome C into the cytosol; which, in turn, initiates a cascade of biochemical events culminating in apoptosis (Fiskum et al., 1999; Murphy et al., 1999; Santry and Rao, 2000; Siesjö et al., 1999). Thus, the metabolic alterations that result in cellular destruction, whether necrosis or apoptosis, precede both the morphologic dissolution of the tissue as well as the secondary energy failure.
It must be emphasized that not all ischemic neurons and glia die in the same fashion or at the same time. Given the duration of hypoxia–ischemia used in the present experiments, it is likely that most cells underwent necrosis, but some became apoptotic, and a few survived. The time course of the pathologic process differs among these cells, both metabolically and morphologically. Accordingly, the measured concentrations of high-energy reserves and associated metabolites in dissected brain tissue comprise averages of cellular elements in various stages of demise. Thus, it is not surprising that the mean concentrations of ATP and phosphocreatine were not entirely restored to control values during the early recovery phase (Figs. 2 and 3), given the rapidity of cell death (Towfighi et al., 1995).
Studies in perinatal animals of other species are limited and not entirely comparable to the present investigation. Lorek et al. (1994) subjected newborn pigs to occlusion of both common carotid arteries combined with systemic hypoxia, before, during, and after which high-energy phosphate reserves were measured with magnetic resonance spectroscopy. The phosphocreatine/inorganic phosphorus ratio approached zero during hypoxia–ischemia, with near complete restitution (94% of baseline) at 2 hours of recovery. Thereafter, the ratio decreased to 44% and 35% of baseline at 24 and 48 hours of recovery, respectively. Histopathologic examination at 48 hours of recovery showed both necrotic and apoptotic neuronal death especially in the cerebral cortex. No correlations were made between either the onset or the extent of the secondary energy failure (phosphocreatine/PI) and the severity of the ultimate brain damage.
In conclusion, the results of the present investigation indicate a close correspondence, especially of phosphocreatine, to histologic brain damage and to the loss of the neuronal protein markers, MAP-2 and SNAP-25, during both the early (6 to 18 hours) and late (24 to 48 hours) phases after cerebral hypoxia–ischemia, suggests evolving cellular destruction as the primary event, which precedes the secondary energy failure. We interpret these observations to indicate that any delayed or secondary energy failure that follows cerebral hypoxia–ischemia is the consequence rather than the cause or a contributor to the ultimate brain damage. Further animal and human research is warranted to resolve definitively this important issue.