
Abstract
Blood flow-metabolism uncoupling is a well-documented phenomenon after traumatic brain injury, but little is known about the direct consequences for white matter. The aim of this study was to quantitatively assess the topographic interrelationship between local cerebral blood flow (LCBF) and glucose metabolism (LCMRglc) after controlled cortical impact injury and to determine the degree of correspondence with the evolving axonal injury. LCMRglc and LCBF measurements were obtained at 3 hours in the same rat from 18F-fluorodeoxyglucose and 14C-iodoantipyrine coregistered autoradiographic images, and compared to the density of damaged axonal profiles in adjacent sections and in an additional group at 24 hours using beta-amyloid precursor protein (ß-APP) immunohistochemistry. LCBF was significantly reduced over the ipsilateral hemisphere by 48 ± 15% compared with sham-controls, whereas LCMRglc was unaffected, apart from foci of elevated LCMRglc in the contusion margin. Flow-metabolism was uncoupled, indicated by a significant 2-fold elevation in the LCMRglc/LCBF ratio within most ipsilateral structures. There was a significant increase in ß-APP-stained axons from 3 to 24 hours, which was negatively correlated with LCBF and positively correlated with the LCMRglc/LCBF ratio at 3 hours in the cingulum and corpus callosum. Our study indicates a possible dependence of axonal outcome on flow-metabolism in the acute injury stage.
Traumatic brain injury (TBI) is often associated with complex hemodynamic and metabolic alterations that can contribute to secondary injury processes. Clinically, one of the key metabolic abnormalities is hyperglycolysis, as indicated by an acutely elevated regional cerebral metabolic rate for glucose dissociated from the normal cerebral metabolic rate for oxygen (Bergsneider et al., 1997). This disease is largely mimicked in animal models, where acute increases in local cerebral metabolic rate for glucose (LCMRglc) have been demonstrated autoradiographically, for example (Sunami et al., 1989; Yoshino et al., 1991; Kawamata et al., 1992; Sutton et al., 1994; Ginsberg et al., 1997; Richards et al., 2001) and using microPET (Moore et al., 2000). In agreement with clinical work, experimental measurements of oxidative metabolism have shown initial increases followed by decreases (Hovda et al., 1991; Levasseur et al., 2000; Vink et al., 1994). Although the morphologic or biochemical basis for hyperglycolysis is unclear and is a matter of some controversy clinically (Bergsneider et al., 1997), at least in experimental models it is unlikely to be associated with an inflammatory process because of the very different time courses of these events. Regardless of the reason, it is generally agreed that hyperglycolysis signifies potentially harmful brain activity.
Disturbances in cerebral blood flow (CBF are also a common sequela of head injury and have been documented both experimentally (Yamakami and McIntosh, 1991; Bryan et al., 1995; Kochanek et al., 1995; Forbes et al., 1997; Hendrich et al., 1999; Lythgoe et al., 2003) and clinically (Bouma et al., 1991; Marion et al., 1991; Martin et al., 1997; Coles et al., 2002). CBF abnormalities have been shown to be an important mechanism underlying secondary brain damage experimentally (Jenkins et al., 1989; Giri et al., 2000) and clinically have been shown to be strongly associated with poor outcome (Robertson et al., 1992). Although the early decline in CBF typically tends to lie above the threshold level classically associated with ischemic brain injury (Hossmann, 1994), it is possible that this pronounced decrease in postinjury CBF, when associated with increased metabolic demand, as indicated by hyperglycolysis, may contribute to the ongoing injury process and account for the poor outcome seen in patients.
Axonal injury is a common finding in TBI and is associated with both morbidity and mortality (Adams et al., 1989; Christman et al., 1994; Maxwell et al., 1997). The original assumption that TBI results in immediate axotomy because of mechanical shearing of the axon describes only a small percentage of the most severely injured fibers (Maxwell et al., 1993, 1997). Rather, in the majority of cases, the primary mechanical insult provokes secondary biochemical processes that induce focal, evolving lesions in injured axons and ultimately disconnection of swollen axons from distal segments (Pettus and Povlishock, 1996; Maxwell et al., 1997; Povlishock et al., 1997; Okonkwo et al., 1998). Because of the progressive nature of the axonal response to injury, it is important to determine the precise mechanism(s) through which secondary axotomy occurs in order that appropriate therapeutic strategies may be developed. Axonal damage can occur as a direct consequence of local ischemic (Pantoni et al., 1996; Yam et al., 1998) or hypoxic conditions (Waxman et al., 1992) and is not always associated with cell body pathology and progression to cell death after trauma (Singleton et al., 2002). Although TBI may not necessarily result in ischemic conditions that are classically associated with energy failure, flow-metabolism uncoupling may render the axons vulnerable to secondary insults.
Metabolic uncoupling after TBI has been demonstrated, both oxidative (Obrist et al., 1984) and glycolytic (Bergsneider et al., 1997). Although acute uncoupling of cerebral blood flow and metabolism has been documented in some animal studies (Ginsberg et al., 1997; Zhao et al., 1999; Ginsberg et al., 2001; Richards et al., 2001; Jiang et al., 2000), they have not previously been measured in the same animal. This is necessary in a heterogeneous condition such as TBI, where flow-metabolism coupling and axonal injury may vary considerably over small distances. Previous studies are largely confined to investigating the biochemical events implicated in uncoupling and the impact on gray matter (Katayama et al., 1990; Kawamata et al., 1992, 1995) with little examination of the consequence for white matter.
In this study, we test the hypothesis that the injury-induced flow-metabolism uncoupling that is known to occur in gray matter after injury (Ginsberg et al., 1997; Richards et al., 2001) is associated with the development of delayed injury in white matter regions. We have used a multiparametric imaging approach to acquire maps of local cerebral blood flow (LCBF), LCMRglc, and axonal damage in the same brain after trauma. A double autoradiographic technique was employed using [18F]fluorodeoxyglucose (FDG) and [14C]iodoantipyrine autoradiography to produce images of LCMRglc and LCBF, which were coregistered to determine the LCMRglc/LCBF ratio. Axonal injury was also assessed in tissue sections through the use of an antibody to beta amyloid precursor protein (ß-APP), a known marker of axons that become swollen and disconnected as a result of impaired axoplasmic flow (Gentleman et al., 1993; Stone et al., 1999). Direct comparison of the early regional flow-metabolism uncoupling with the underlying progression of axonal damage that occurs between acute and chronic time-points enabled us to assess the neuropathologic consequences of uncoupling.
MATERIALS AND METHODS
Experimental protocol
At 3 hours after controlled cortical impact (CCI) or sham-operation (n = 6 per group), rats were processed for LCMRglc, LCBF autoradiography and for 8-APP immunohistochemistry in adjacent sections. A further six animals were injured by CCI and examined for ß-APP immunohistochemistry at 24 hours after trauma in the same brain regions to determine the long-term fate of injured axons.
Surgical procedures
All animals were treated in accordance with the United Kingdom Animal Scientific Procedures Act, 1986 and within the guidelines of the local animal ethics committee. Male, Sprague-Dawley rats (256 ± 16 g body weight) were initially anesthetized with 3% isoflurane vaporized in O2 flowing at 0.8 L/min and then maintained with 2% isoflurane during surgery. The left femoral artery and right femoral vein were cannulated with polyethylene tubing (0.8-mm outer diameter) for periodic blood sampling and plasma glucose measurement. The head was fixed in a stereotaxic frame (David Kopf Instruments, Yu-junga, CA, U.S.A.) and after retracting the scalp, a dental drill–trephine was used to make a 5-mm craniotomy over the left parietal cortex, 0.5 mm posterior to the coronal suture and 3 mm lateral to the sagittal suture as detailed previously (Chen et al., 2003). Considerable care was taken to avoid injury to the underlying dura, which was continuously bathed in sterile physiologic saline during the procedure. Body temperature was monitored throughout the surgery by a rectal probe and maintained at 37.0 ± 0.5°C using a heated pad (Harvard Apparatus Ltd., Edenbridge, Kent, UK).
Anesthesia was reduced to 1% to 1.5% isoflurane in N2O/O2 (0.8/0.4 L/min) before injury, which was produced 10 minutes later using a pneumatic piston with a rounded, metal tip, 2.5 mm in diameter and angled at 22.5° to the vertical so that the tip was perpendicular with the brain surface at the center of the craniotomy. A velocity of 4 m/s and a deformation depth below the dura of 2 mm was used. The bone flap was immediately replaced and sealed with dental acrylic cement (Bracon Ltd., Etchingham, Sussex, UK) and the scalp was sutured closed. In the 24-hour survival group, rats were placed in a heated cage to maintain body temperature while recovering from anesthesia, and soluble paracetamol (1 mg/mL; Cox Pharmaceuticals, Barnstaple, Devon, UK) was administered in the drinking water postoperatively. Rats in the 3-hour survival group were maintained under anesthesia until the termination of the experiment. Sham-operated rats received a craniotomy as before but no CCI; the impact tip was placed lightly on the dura before sealing the wound. Blood gases, pH, and glucose were measured 5 minutes before and 2 hours after injury.
Double autoradiographic technique for local metabolic rate for glucose and local cerebral blood flow
The procedures used to determine LCMRglc and LCBF were similar to those described previously (Sokoloff et al., 1977; Sakurada et al., 1978). Thirty mega-becquerels of [18F]FDG (0.5 mL) was injected into the femoral vein 2 hours and 15 minutes after the injury. Timed arterial samples (50 μL) were collected over 45 minutes through the catheterized femoral artery into microcapillary tubes, which were immediately centrifuged. After collection of the last arterial sample at the 45th minute, 925 kBq of [C]iodoantipyrine (0.7 mL) (Tocris Cookson, Bristol, UK) was infused intravenously over 60 seconds at a ramped infusion rate using an infusion pump under computer control (Harvard Apparatus, Maidstone, UK). Arterial blood samples were collected onto a filter paper every 3 seconds for 60 seconds from the start of the infusion. The experiment was terminated by decapitation and the brain was rapidly excised, frozen in dry ice–cooled isopentane, and subsequently sectioned at 20 μm in a cryostat and processed for quantitative autoradiography for FDG and [14C]iodoantipyrine.
All brain sections and plasma samples for [18F]FDG were immediately exposed to a super sensitive phosphor-imager screen (Cyclone, PerkinElmer Life Sciences Ltd., Cambridge, UK) for 3 hours together with two sets of calibration standards prepared by successive twofold dilutions of [18F]FDG to concentrations appropriate for accurate analysis of the brain and plasma samples. Blood sample standards were created by placing 10 μL of each dilution into microcapillary tubes while brain section standards were created by placing 2 μL of each dilution onto squares of filter paper (Whatman International Ltd., Maidstone, UK). The resulting sets of images are a product of predominantly 18F decay because 14C activity produces negligible results (<0.1%) at this exposure time. The same sections and 14C plasma samples were reexposed to a phosphor-imager screen 2 days later, when all 18F had decayed (t1/2 = 109.7 minutes), for a period of 3 days together with calibrated 14C standards (Amersham PLC, Little Chalfont, UK) in order to obtain an exposure due entirely to 14C decay.
Image analysis
The phosphor imaging screens were analyzed using a Cyclone phosphor imager and the OptiQuant software (Version 3.0, PerkinElmer Life Sciences Ltd., Cambridge, UK) to produce a digital image of the distribution and intensity of radioactivity in the brain sections and plasma samples. Plasma 18F or 14C radioactivity was determined by placing a region-of-interest (ROI) over the entire microcentrifuge tube or filter paper and with reference to the appropriate calibration standards. Each set of LCMRglc and LCBF images was coregistered using an in-house automatic image coregistration program written in IDL (Research Systems International, Crowthorne, UK) around a mutual information algorithm (Studholme et al., 1997) and adapted to two-dimensional data sets. Transformation parameters were calculated by pixel-to-pixel disparity analysis, and each LCMRglc image was aligned with its corresponding LCBF image by applying a transformation using the translation and rotation parameters. This enabled ROI data to be obtained from the same anatomical location within two parametric maps from the same animal. In order to minimize any bias that may occur when locating ROIs on autoradiograms, ROIs were anatomically defined on adjacent, coregistered, cresyl violet–stained sections before obtaining mean ROI LCBF and LCMRglc data with reference to the calibration standards using the OptiQuant software. ROIs were defined at the level of −2.80 mm from bregma within the following brain regions: contusion core, contusion margin, CA1, CA3, dentate gyrus, dorsal thalamus, cingulum, corpus callosum, external capsule, and internal capsule (Fig. 1).
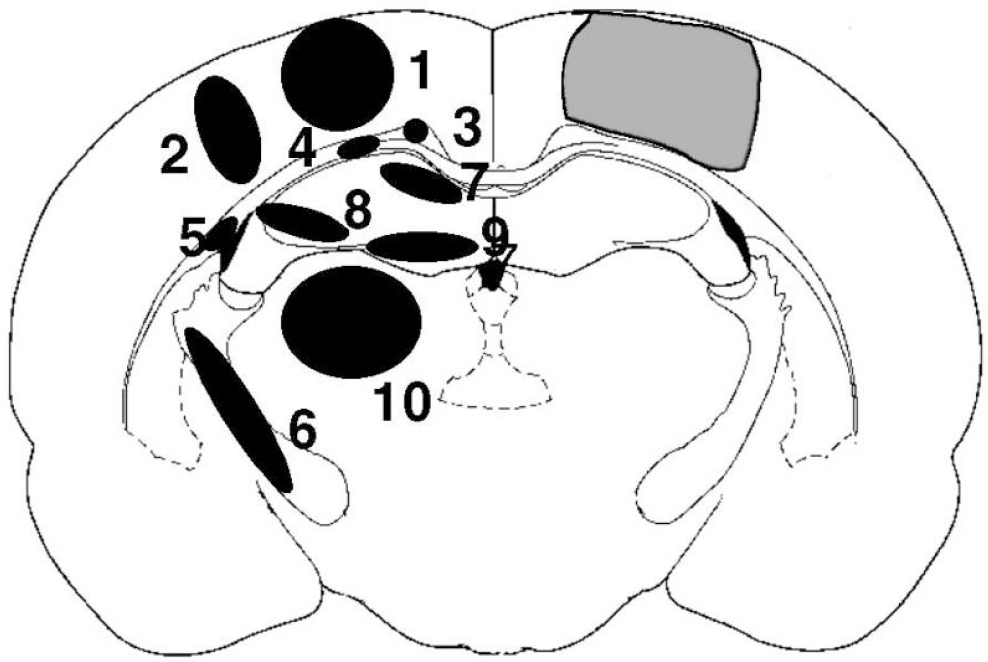
A brain atlas coronal brain section (Paxinos and Watson, 1997) of a core contused region (hatched area) at −2.80 mm bregma. Measurements for LCMRglc and LCBF and the density of ß-APP immunoreactive profiles were determined in the following regions of interest: (1) contusion core, (2) contusion margin, (3) cingulum, (4) corpus callosum, (5) external capsule, (6) internal capsule, (7) CA1, (8) CA3, (9) dentate gyrus, and (10) dorsolateral thalamus.
Local cerebral metabolic rate for glucose values were determined by the operational equation used in 2-deoxyglucose (2DG) autoradiography studies with a modification of the rate and lump constants to account for the difference in kinetic characteristics between FDG and 2DG. Values for K1, K2, K3 used for FDG were, respectively, 0.33, 0.76, 0.14 min−1 for gray matter and 0.15, 0.40, 0.04 min−1 for white matter (Ingvar et al., 1991). A lumped constant of 0.6 was used (Lear and Ackermann, 1989). LCBF was calculated as described previously (Sakurada et al., 1978).
Immunohistochemistry
Frozen sections adjacent to those assessed for autoradiography from the 3-hour sham and injury groups and from the same brain level in the 24-hour time group were processed for immunohistochemistry using the rabbit anti-APP C-terminus polyclonal antibody (CT 695, Zymed Laboratories, San Francisco, CA, U.S.A.; 1:500). Sections were quenched in a solution of 10% methanol and 10% hydrogen peroxide in distilled water for 5 minutes before three washes in Trizma (Sigma-Aldrich, Poole, Dorset, UK)-buffered saline (TBS). Sections were then blocked for 60 minutes in TBS containing 0.2% Triton X-100 (TXTBS), (Sigma-Aldrich, UK) with 3% normal goat serum (Dako, Cambridge, UK) and then incubated overnight at room temperature in the primary antibody in TXTBS containing 1% normal goat serum. After three washes in TBS, sections were left in the biotinylated secondary antibody (Dako biotinylated anti-rabbit IgG) at a concentration of 1:200 in TBS with 1% normal goat serum for 3 hours followed by three washes in TBS. The primary antibody was visualized with the DAB reaction using the streptavidin-biotinylated horseradish peroxidase complex kit (Dako) in 1% normal goat serum in TBS for 2 hours followed by three washes in TBS and two washes in Trizma nonsaline. Sections were developed with DAB in Trizma nonsaline containing 0.03% hydrogen peroxide, and excess stain was removed by washing in Trizma nonsaline three times. Nonspecific staining was investigated by omitting the primary antibody and was negative.
Axonal lesion analysis
Axon lesion was quantified on ß-APP-stained sections that were immediately adjacent to the LCBF/LCMRglc sections at the level of −2.80 mm from bregma in the 3-hour time group and at the same level in the 24-hour group using a light microscope interfaced with an image analysis system (Computer-assisted stereological toolbox-grid system, Olympus, Glostrup, Denmark). For the 3-hour group, the position of the ROIs used to obtain LCMRglc and LCBF data (Fig. 1) were defined in the same brain regions on the ß-APP-stained sections and five, square field-of-views were randomly positioned by the image analysis system within each ROI at a magnification of x40, corresponding to an area of 276 μm2 per field of view. The total number of ß-APP axonal profiles, identified as dark brown, elongated, or circular processes of retraction balls/bulbs or reactive processes were counted in each field of view and expressed as the mean number per 276 μm field of view. For the 24-hour group, the ROIs for each brain region were placed in a similar position as the 3-hour group and assessed in the same way for axonal lesion. The relationship between the disruption in flow-metabolism at 3 hours and the progression of axonal damage from 3 to 24 hours was assessed by plotting the individual flow-metabolism ROI data at 3 hours versus the corresponding change in ß-APP density from 3 to 24 hours (determined as the overall mean ROI ß-APP density from all rats in the 24-hour time group minus the corresponding individual ROI ß-APP density from each animal at 3 hours).
Statistical analysis
Data were expressed as group means ± standard deviation (SD). Differences between sham and trauma group physiologic variables: LCMRglc, LCBF, and LCMRglc/LCBF ratio and the increase in ß-APP profiles between 3 and 24 hours were assessed using unpaired t-tests. The False Discovery Rate approach was used to correct for multiple comparisons (Benjamini and Hochberg, 1995). This method is based on fixing the upper limit for the desired proportion of false positives (α) to be expected among all performed tests. Two simple steps are involved in the implementation of the False Discovery Rate (FDR) methodology. First, the probability values (P) coming from each one of the n individual tests are sorted in ascending order (i) such that p(1) ≤ p(2) ≤ … ≤ p(n). Then, after choosing α (we have used α = 0.05 throughout), the number of tests to be accepted as positive is given by a simple rule:
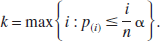
All tests with a P value equal to or smaller than the threshold p(k) are considered significant. Herein, when significance was reached with the FDR, we have quoted the original probability levels that were obtained by the t-test (P < 0.05, 0.01, 0.001).
RESULTS
There were no significant differences in blood gases and plasma glucose values between data obtained before and after trauma (Table 1). Similarly, there were no significant differences between sham and injury data.
Physiological data
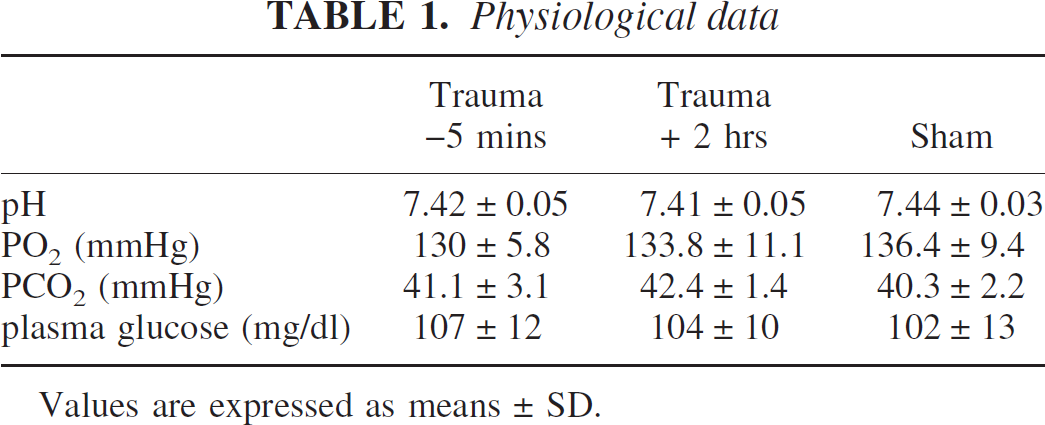
Values are expressed as means ± SD.
Local cerebral blood flow
In the sham group, LCBF was lowered in the ipsilateral sensorimotor cortex immediately adjacent to the craniotomy compared with the homotopic, contralateral brain region (Fig. 2A, E, respectively, and Fig. 3A), although this was not statistically significant. In the injured group, there were no significant changes in LCBF in contralateral brain regions when compared with the corresponding regions of the sham group. However, ipsilateral to the injury, autoradiograms demonstrated a diffuse reduction in LCBF in many areas of the injured brain. For example, LCBF was markedly decreased by 71% ± 6% and 67% ± 10% (P < 0.01) in the contusion core and cingulum, respectively (P < 0.01) (Fig. 3A). There were smaller but significant LCBF reductions of 35% to 54% in the cortical contusion margin and in the subcortical structures including the hippocampus, dorsal thalamus, and corpus callosum (P < 0.05), but there were no differences between the sham and injured groups in the external and internal capsule.
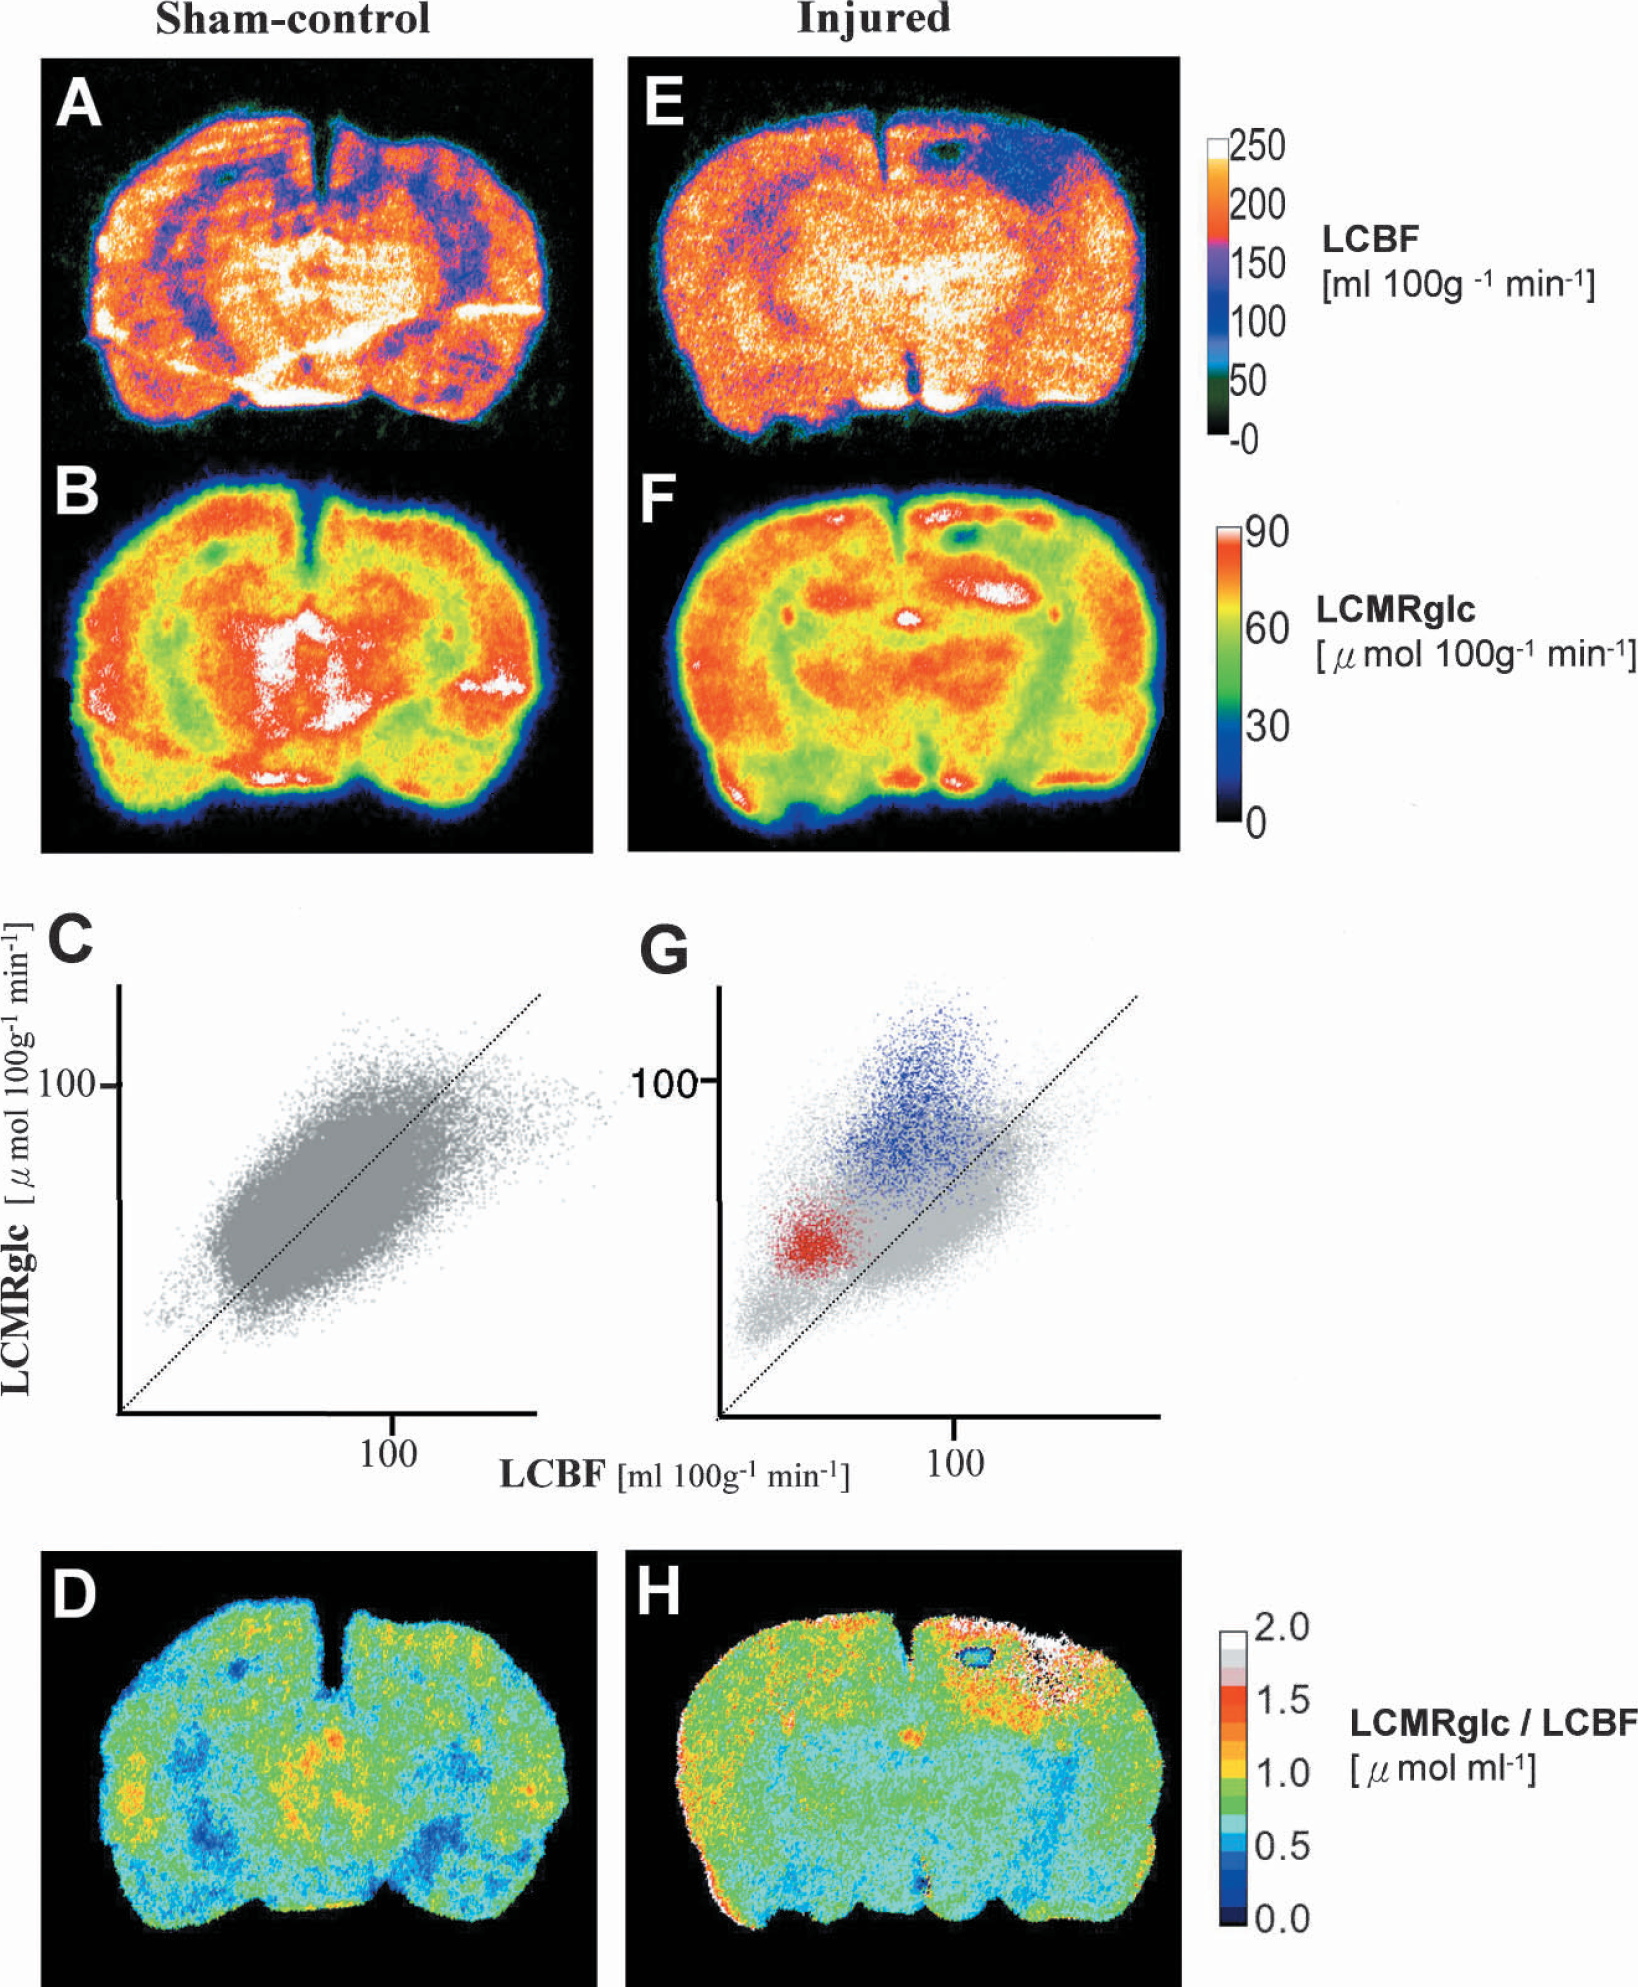
Representative parametric maps from sham-control (left column) and injured rats at 3 hours after trauma (right column) of LCBF (
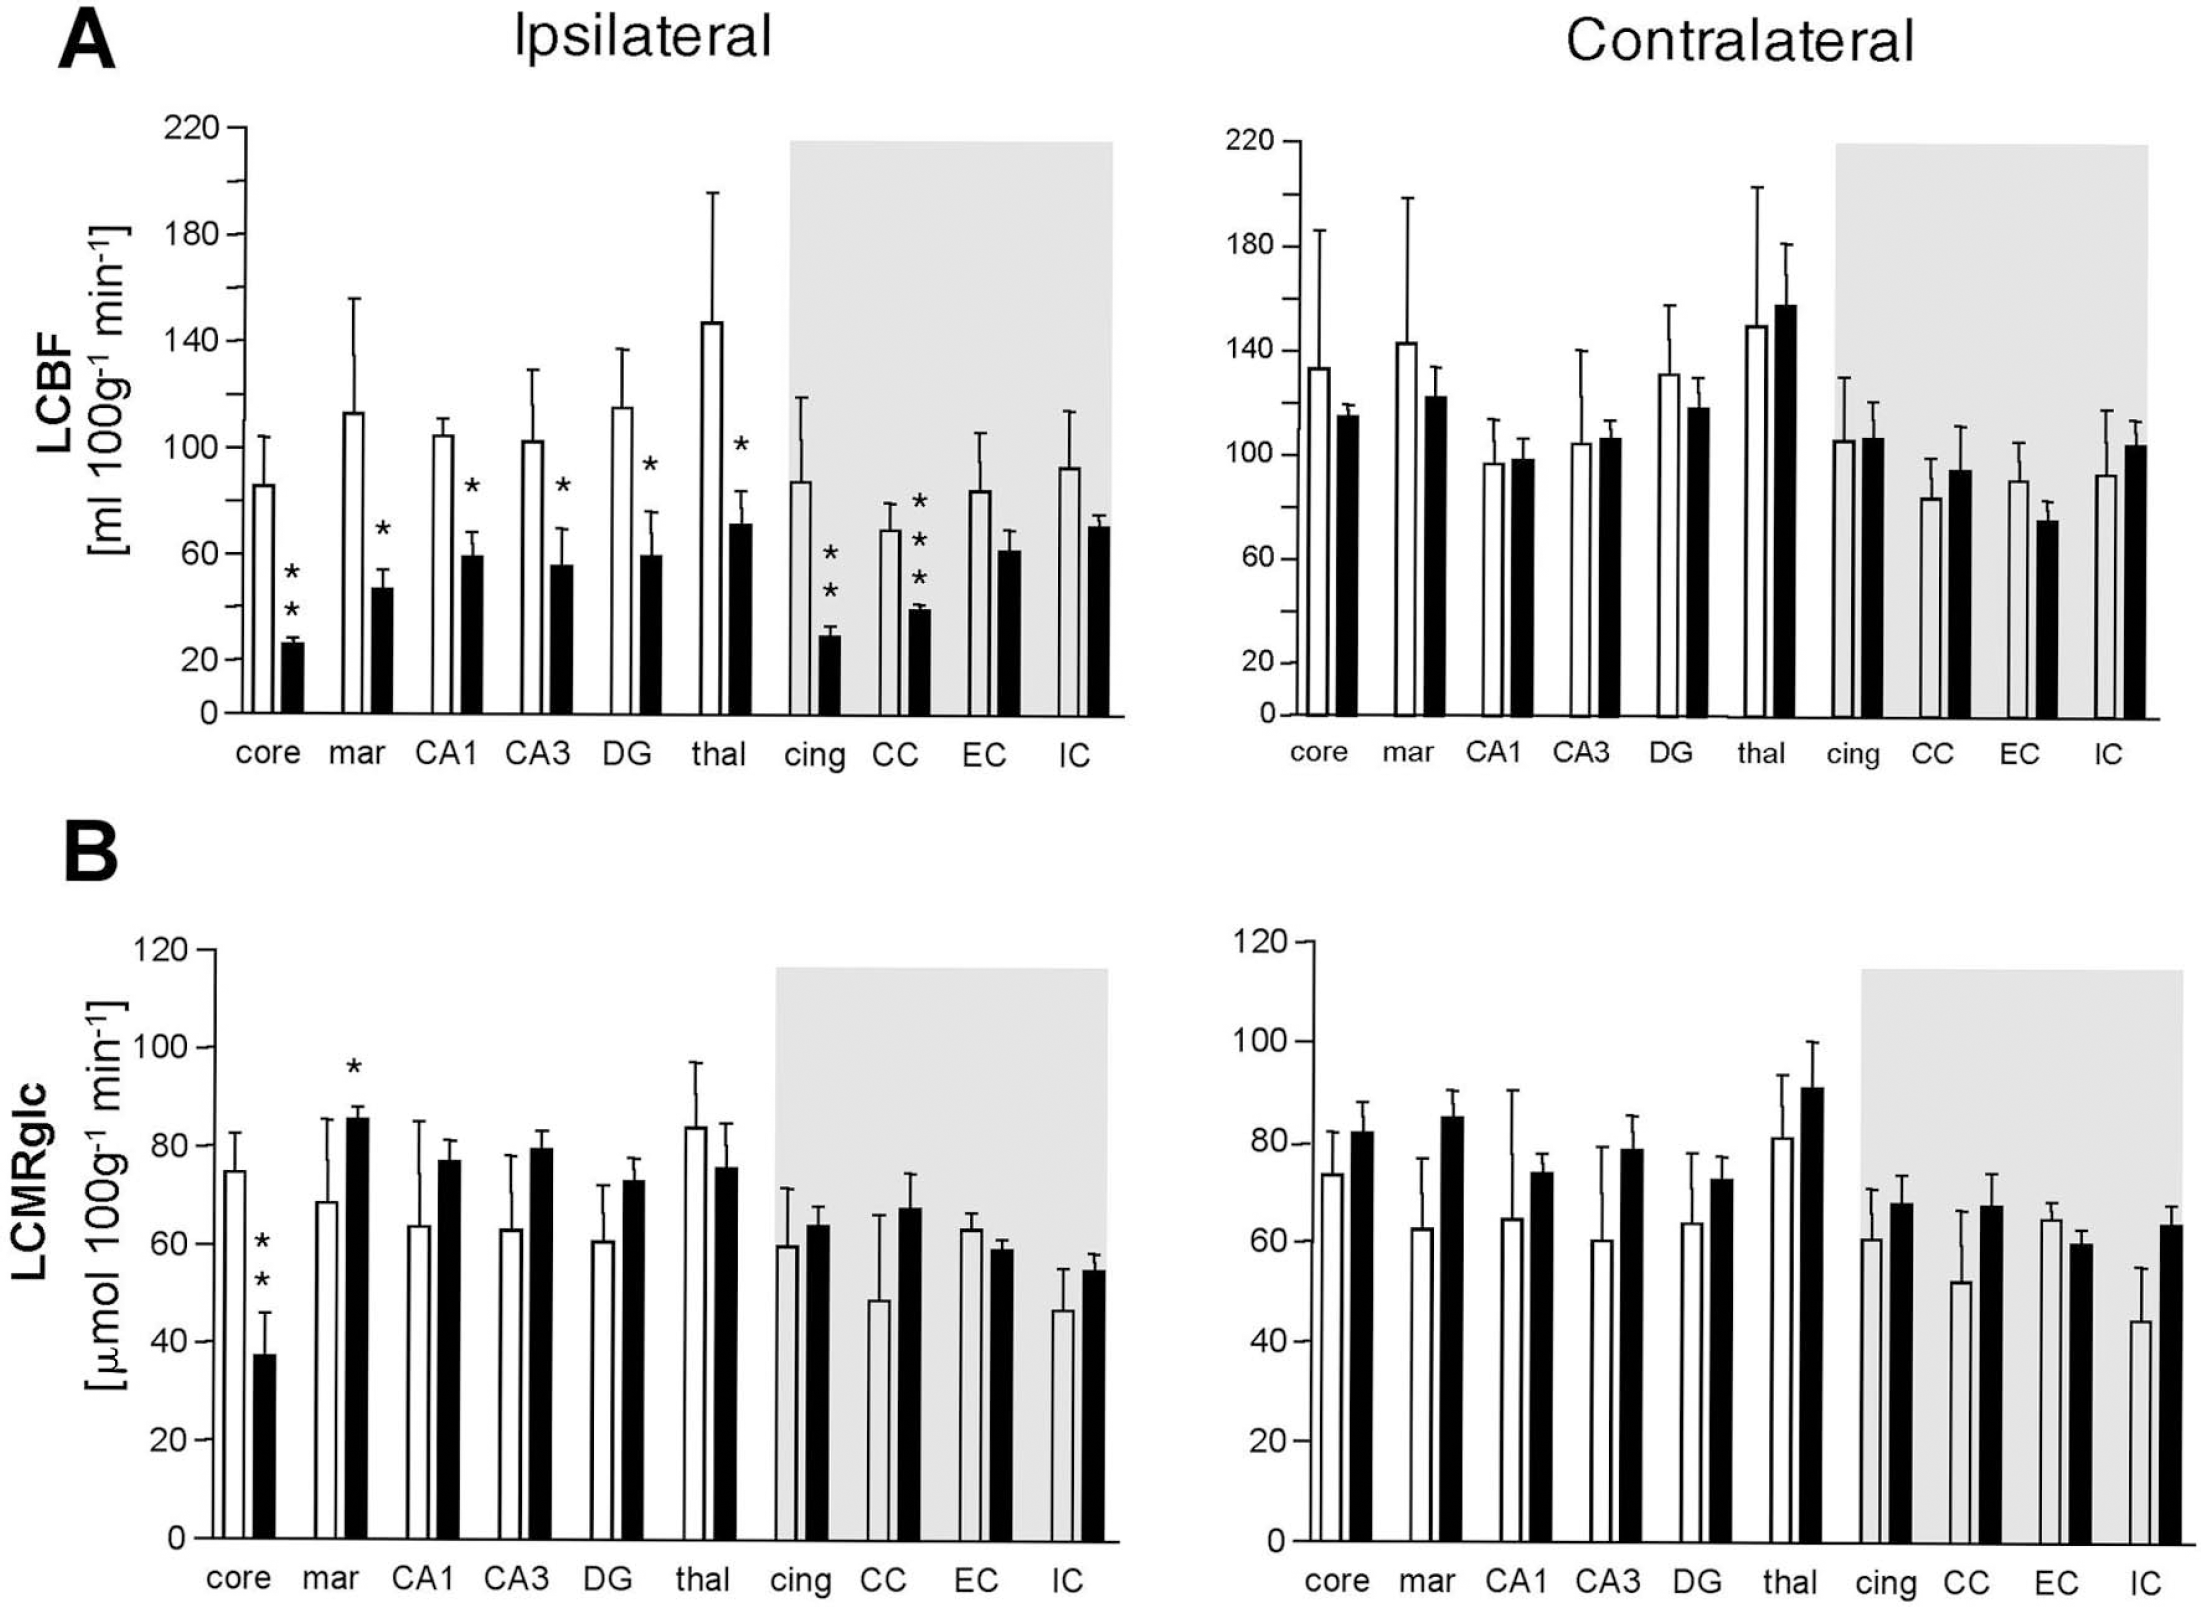
Bar graphs demonstrating (
Local cerebral glucose utilization
Local cerebral metabolic rate for glucose levels in the sham-injured group were symmetrical throughout the brain (Fig. 2B, F), and there was no significant difference between the two hemispheres for any ROI (Fig. 3B.) In the 3-hour injury group, there was a marked depression in LCMRglc in the contusion core compared to the sham group (50% ± 8%, P < 0.01, Fig. 3A), whereas values were significantly elevated above sham values in the contusion margin (31% ± 8%, P < 0.05).
Local metabolic rate for glucose/local cerebral blood flow ratio
In sham rats, as expected from previous work (Sokoloff, 1981; Ginsberg et al., 1987), there was tight coupling between LCMRglc rates and LCBF (Fig. 2C), and this corresponded to a 0.5 to 1.0 μmol mL−1 ratio of glucose metabolism to blood flow (LCMRglc/LCBF) over the entire brain (Figs. 2D and 4). In injured rats, this coupling was absent in some brain regions (Fig. 2G) corresponding to a 1.5- to 3-fold increase in the LCMRglc/LCBF ratio throughout most of the brain regions examined in the ipsilateral hemisphere, including the contusion margin, all hippocampal subfields, thalamus, cingulum, corpus callosum, and the external capsule (P < 0.05) (Figs. 2H and 4). In contrast, LCMRglc/LCBF ratios in the contusion core and internal capsule were not different from the same brain region in sham rats.
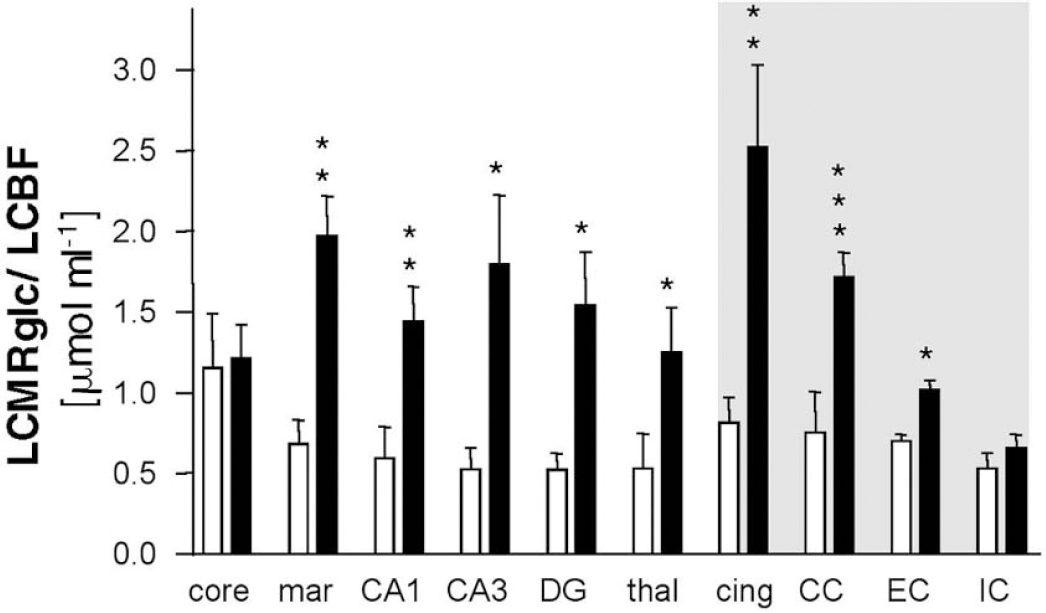
Bar graph demonstrating ipsilateral LCMRglc/LCBF ratio values in sham-control (open bars) and injured groups (closed bars) in gray and white matter (shaded area) brain regions. Values were significantly elevated within all regions in the injured group except the contusion core and internal capsule. Values, probability levels, and key as for Figure 3.
β-Amyloid precursor protein immunohistochemistry
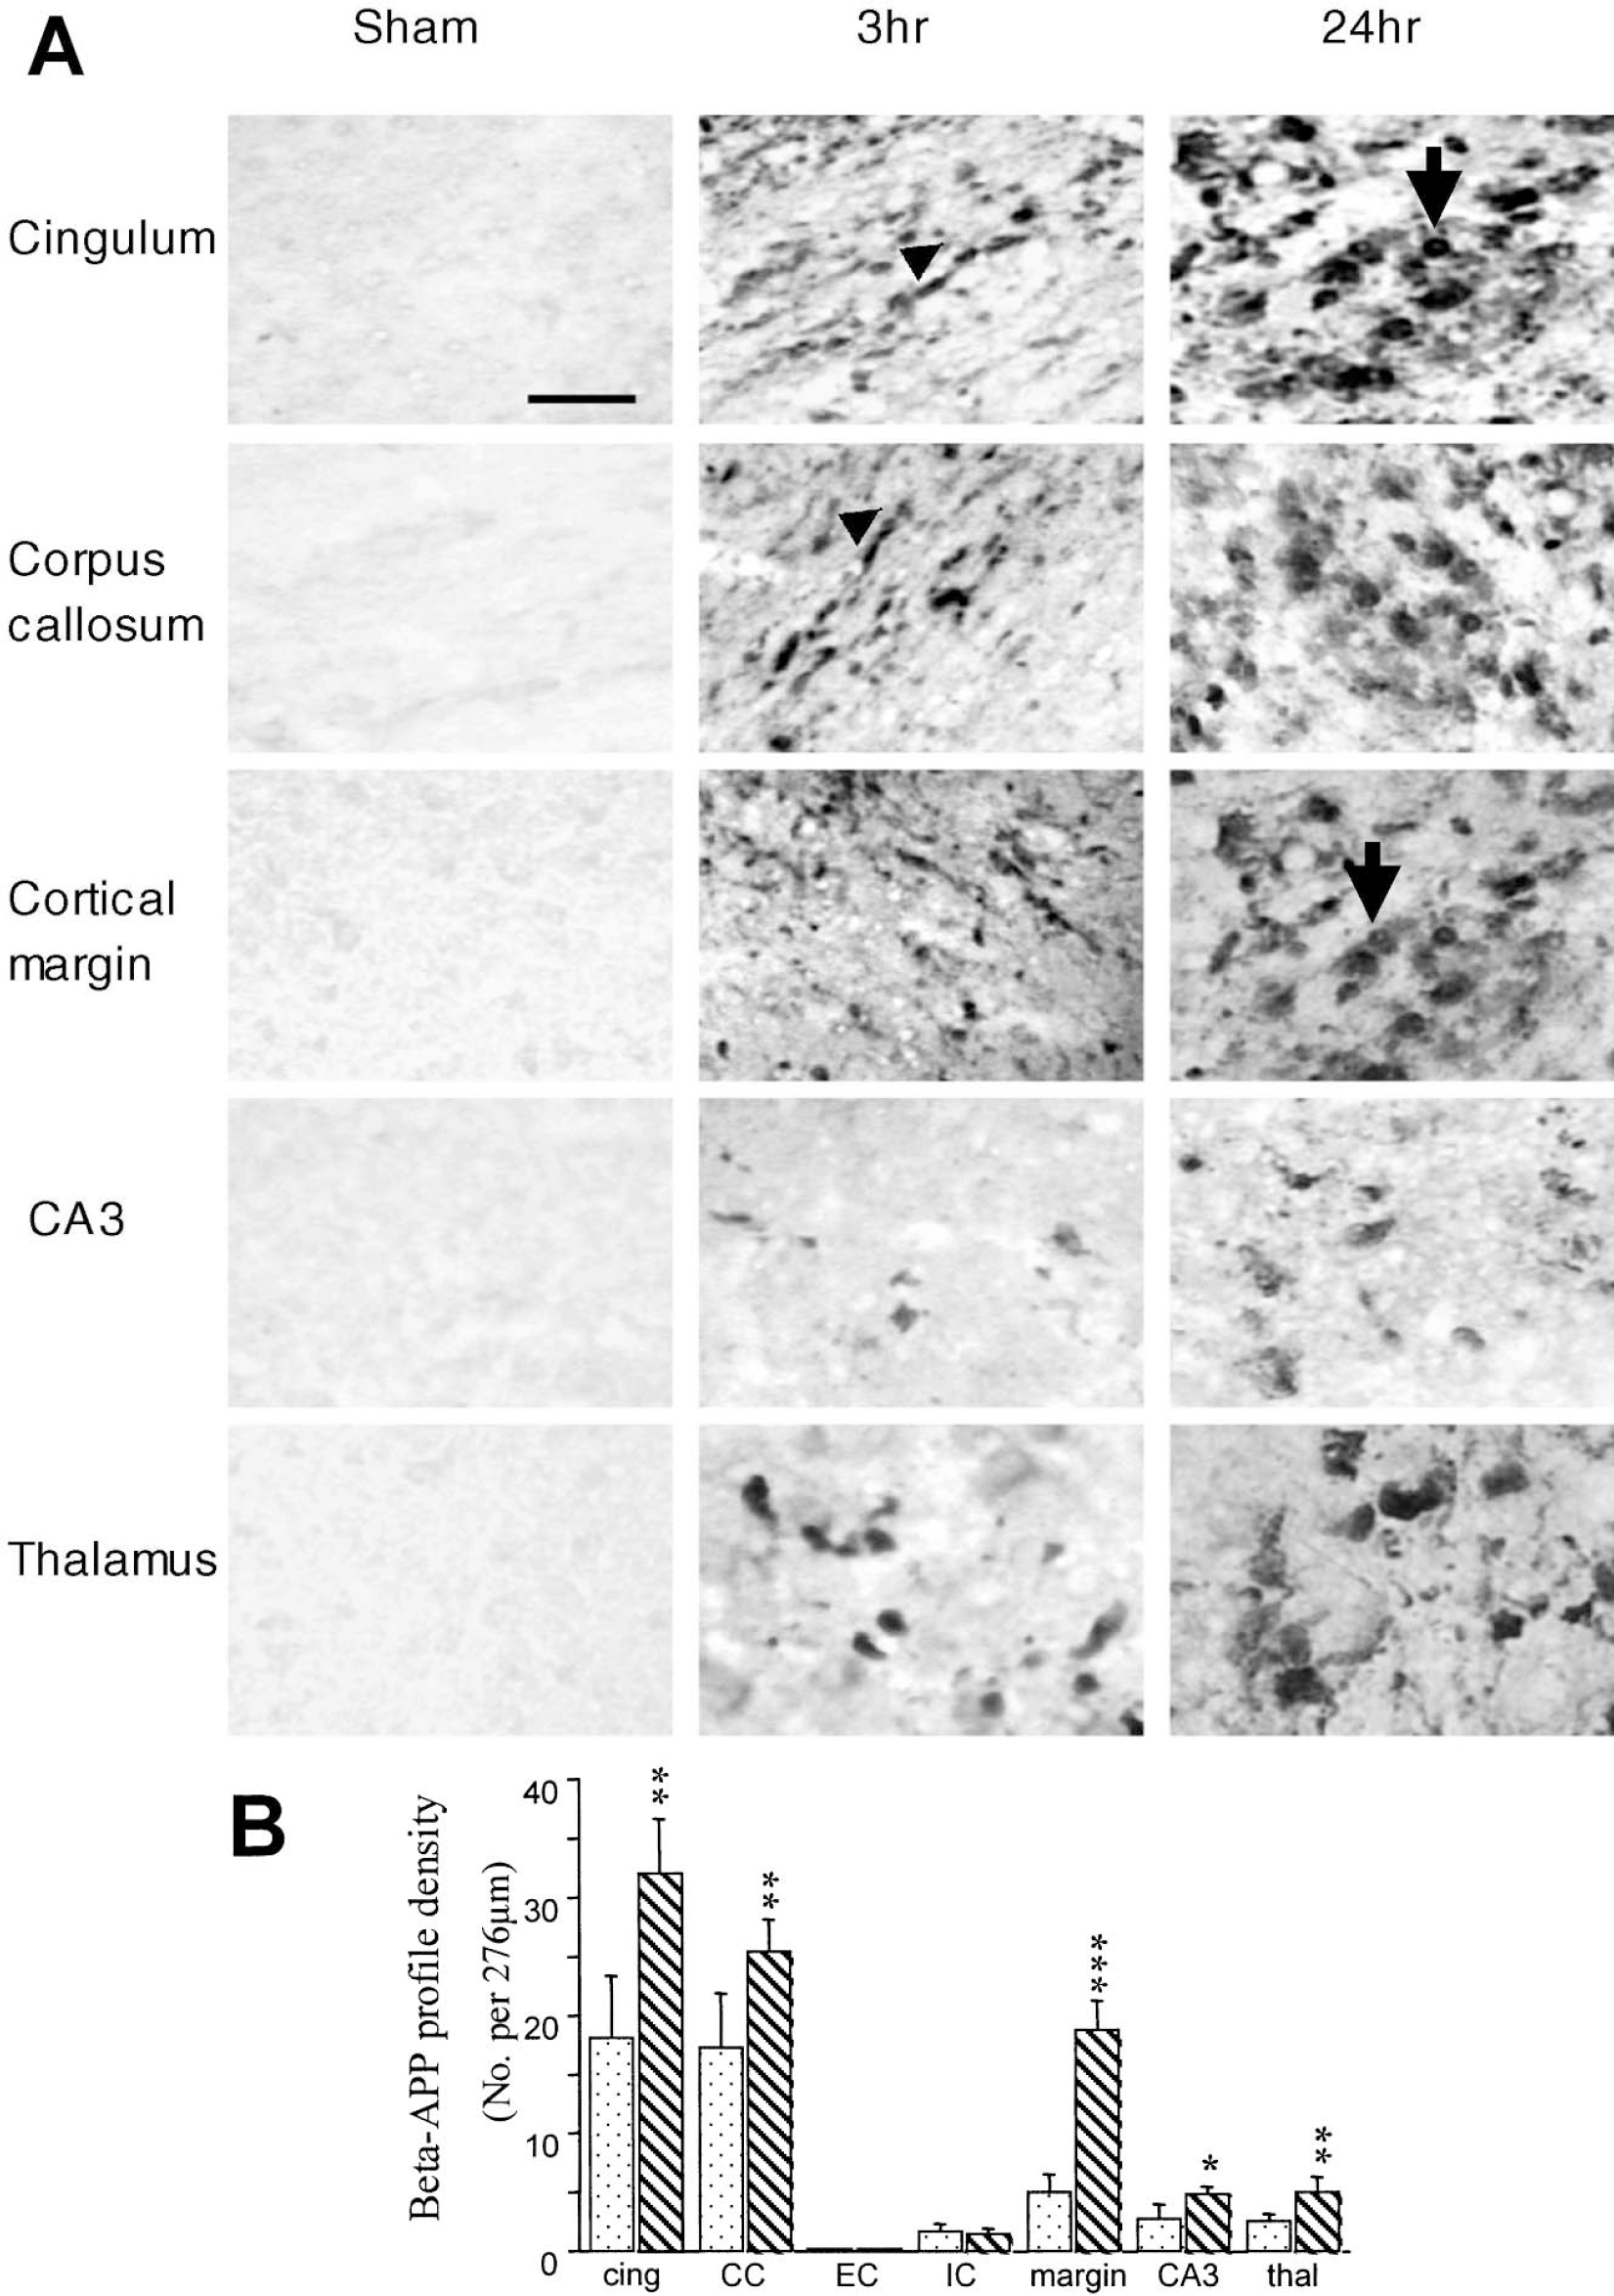
In sham-injured control rats, β-APP immunoreactivity was absent within white matter tracts and neuronal perikarya were only faintly stained (Fig. 5A) in contrast to injured brains, which were intensely stained at both 3 and 24 hours (Fig. 5A). At 3 hours, damaged axons appeared as continuous, varicose swellings or disconnected axonal bulbs while by 24 hours the immunoreactivity was more intense and the majority of the terminal axon bulbs were disconnected from the proximal axonal segments. This pathology was primarily found in areas close to the impact site such as the contusion margin, the subcortical white matter immediately below the injury site, the ipsilateral corpus callosum, the internal capsule, the hippocampal CA3 region and the dorsal regions of the striatum and thalamus (Fig. 5A). No terminal axonal bulbs were observed in the contralateral hemisphere, although occasional axonal swellings were seen in the contralateral cortex and subcortical white matter (data not shown). A quantitative assessment of β-APP profiles within different structures in injured rats revealed a significant increase at 24 hours compared with 3 hours in the cingulum (P < 0.01), corpus callosum (P < 0.01), contusion margin (P < 0.001), hippocampal CA3 region (P < 0.05) and the thalamus (P < 0.01) (Fig. 5B).
(
Flow and metabolism versus axonal injury
There was a clear association between the location of the white matter regions to the impact site and the severity of the LCBF and flow-metabolism ratio changes and axonal disruption; all mean ROI parameters were significantly correlated within the corpus callosum and cingulum and immediately under the impact site (P < 0.05) while further away in the internal and external capsules blood flow and metabolism was less severely and non-significantly affected and damage to axons was minimal or non-existent (Figs. 6A,C). Variation in all parameters due to location of ROI's from the primary injury site and to inter-animal variation in injury severity resulted in some degree of overlap between the individual data points from each brain region and this was used to globally assess the relationship between the cerebrovascular parameters and axonal injury in the following way: by plotting all flow-metabolism data-points from all brain regions examined from each rat at 3 hours after injury versus the corresponding increase in axonal injury from 3 hours to the group mean injury response at 24 hours, it is apparent that there is a threshold below which only further reductions in blood flow at 3 hours after injury will result in further axonal disruption (Fig. 6A). While no such relationship exists between LCMRglc and axonal damage (Fig. 6B) the ratio of flow-metabolism does show a similar threshold effect (Fig. 6C).
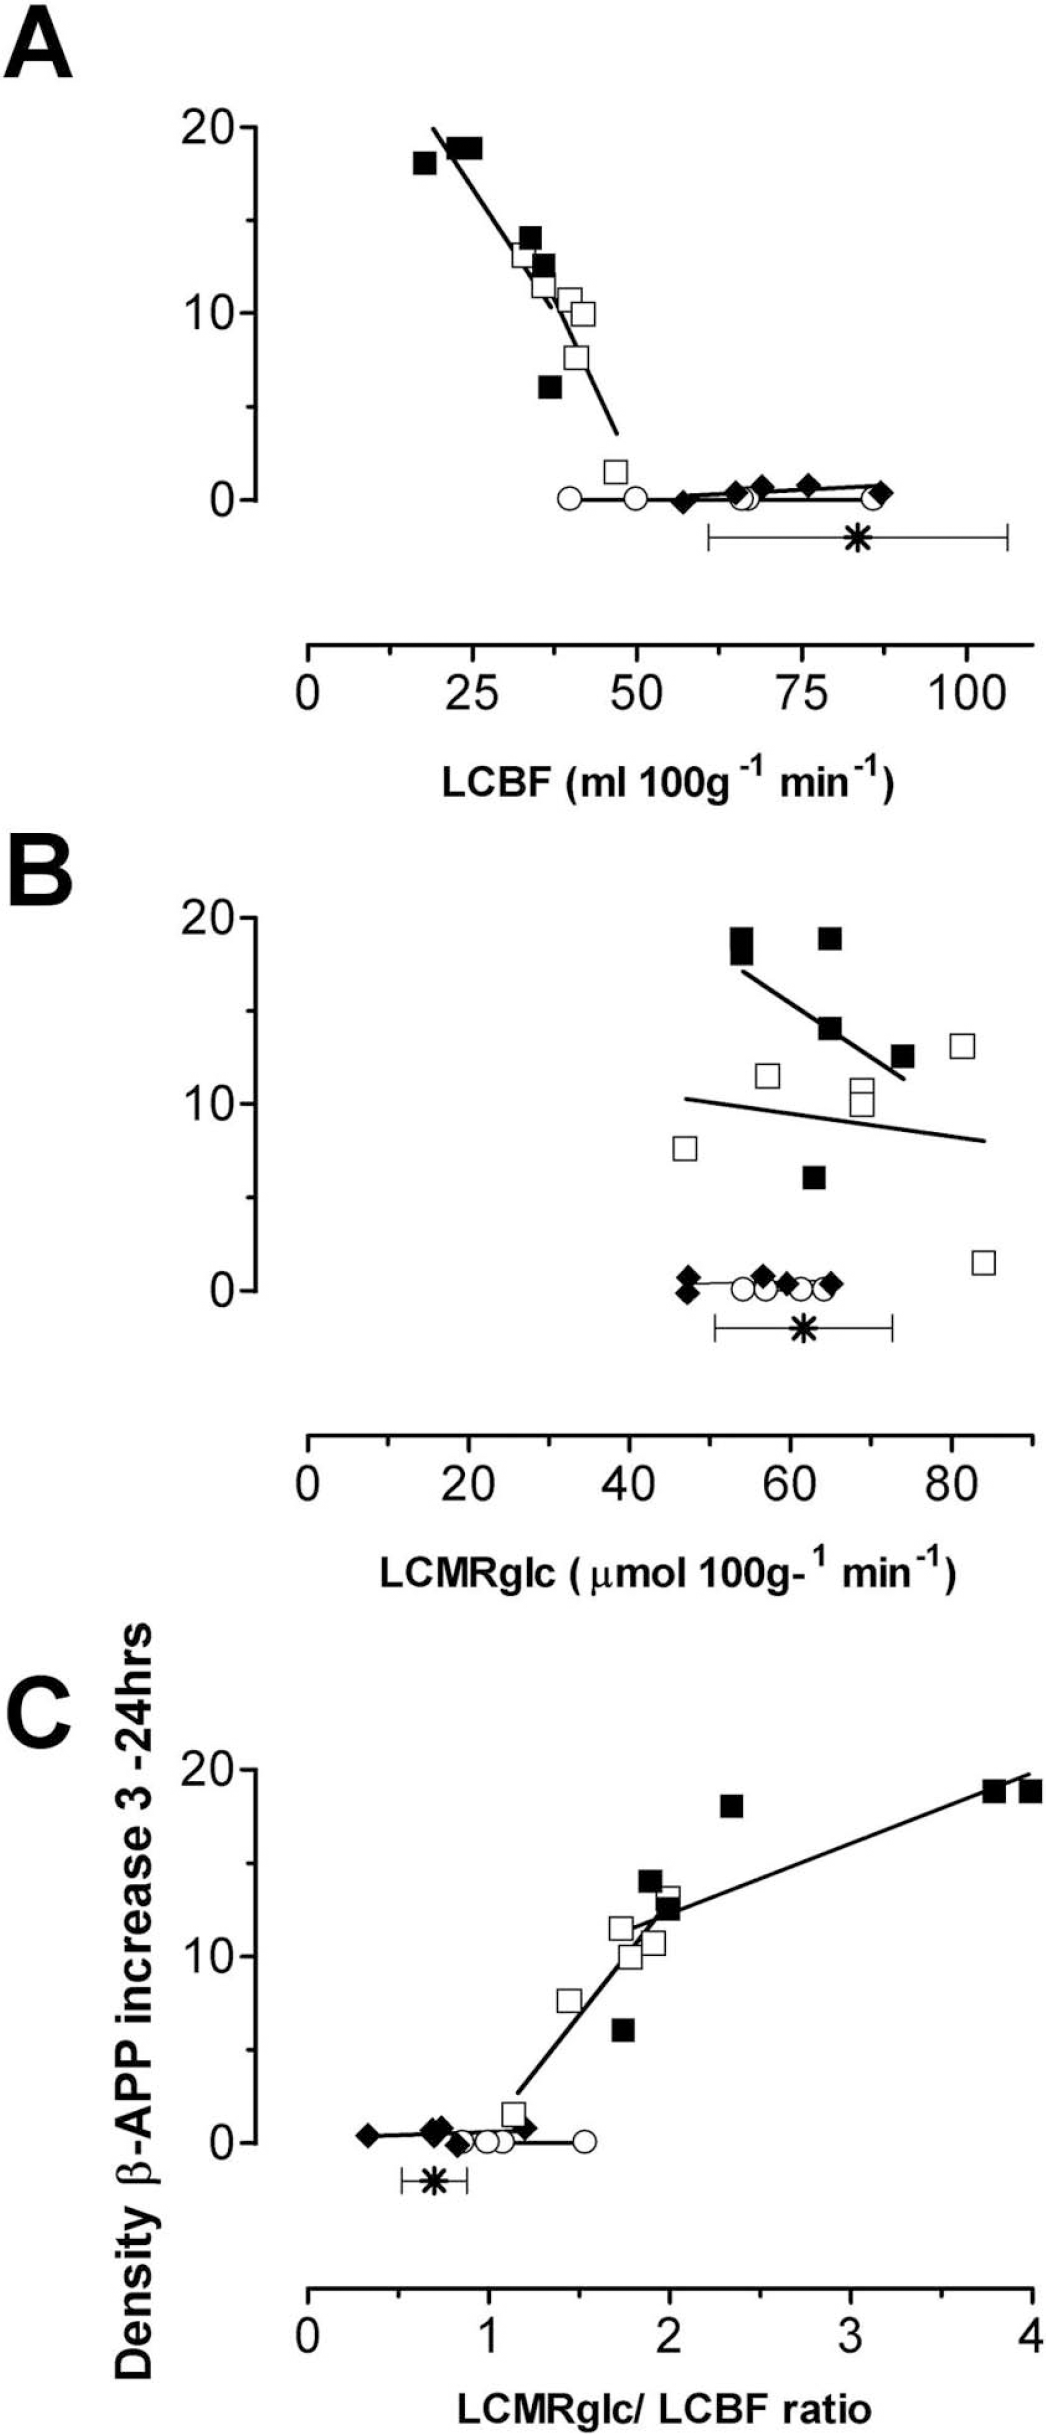
Linear regression analysis showing the association between axonal injury, assessed by the increase in number of ß-APP profiles from individual rats at 3 hours to the group mean at 24 hours and the 3-hour postinjury quantification of (A) LCBF, (B) LCMRglc, and (C) LCMRglc/LCBF ratio in the cingulum (■), corpus callosum (□), internal capsule (♦), and external capsule (○). Each point represents ROI data from a single animal; the symbol (*) and horizontal standard error bars indicate the sham-control white matter ranges for each parameter shown on the abscissa. Distance from the impact site clearly influenced the data because blood flow, metabolism, and axonal injury were most affected in the white matter ROIs closest to the impact site: the cingulum and corpus callosum. (
DISCUSSION
We have shown that cortical contusion injury results in a state of marked uncoupling of LCMRglc and LCBF during the first three hours after injury. This uncoupling was attributable to severe reductions in LCBF despite normal or even mild elevations in LCMRglc and was generally limited to the contusion margin, ipsilateral hippocampus, thalamus, cingulum, and corpus callosum. The major novel findings in this study are that the degree of early blood flow reduction and flow-metabolism uncoupling in white matter regions was positively associated with the development of axonal injury, although we did not establish a direct casual relationship between these parameters. A secondary finding was that the progression to secondary injury might well be dependent on reaching a threshold for either blood-flow reduction or flow-metabolism uncoupling in the initial few hours after injury.
Flow, metabolism, and uncoupling
The pattern of flow-metabolism uncoupling obtained in this study was similar to that in other work on experimental head injury (Richards et al., 2001) and cerebral infarction (Belayev et al., 1997). However, these studies focused mainly on changes in gray matter regions, whereas information on white matter regions was not reported. We have extended these observations by defining ROIs to include a significant portion of white matter regions, and the results demonstrate that uncoupling exists in these regions in a manner similar to that of gray matter.
Glucose metabolism was significantly elevated in the contusion margin in this study, whereas it was diffusely elevated bilaterally in many cortical and subcortical sites after fluid percussion (FP) injury (Yoshino et al., 1991), most likely because of the more focal nature of contusion injury. We observed a 71% decline of LCBF less than the control level in the contusion core at 3 hours after CCI, which was similar to results reported in other studies on the CCI model, using autoradiography (Bryan et al., 1995; Richards et al., 2001) or magnetic resonance arterial spin-labeling imaging (Kochanek et al., 1995; Forbes et al., 1997; Hendrich et al., 1999; Lythgoe et al., 2003). Although more modest reductions in CBF occur to 50% to 60% below the control levels in the FP model (Yamakami and McIntosh, 1991; Ginsberg et al., 1997), the 1.5- 3-fold elevation in LCMRglc/LCBF ratios reported in the current study is consistent with values reported after FP injury at 1 hour (Ginsberg et al., 1997). These findings substantiate previous work in the FP model (Yoshino et al., 1991; Yamakami and McIntosh, 1991) that show that there is a critical period when local perfusion is inadequate to meet increased local metabolic energy demand.
Relationship to axonal injury
We have not demonstrated a direct casual link between flow and metabolism, ie, that the evolution of secondary axonal injury is due to continuing vulnerability of axons exposed to energy crisis rather than maturation of the injury by processes arising from the primary injury that are independent of energy availability. However, the major findings that the degree of delayed axotomy correlated with the severity of the initial CBF reduction and flow-metabolism uncoupling and that a threshold relationship exists for this, do tend to support the idea that mismatches in energy supply are a major factor involved in the pathogenesis of progressive axonal injury. A previous study on the ischemic rat brain demonstrated that initially after injury, gray matter cytoskeletal injury was lower and more variable in the hypermetabolic penumbral areas compared to the hypometabolic core (Yao et al., 1995). However, levels were similar at later time points when all regions became hypometabolic, indicating that a period of energy failure is required for irreversible cytoskeletal breakdown. The data from the current study support this and suggest that it is not the absolute rate of glucose metabolism at the acute stage that correlates with impending axonal injury but the rate relative to LCBF because, although white matter LCMRglc values were not significantly different from normal, the ratio to LCBF was greatly altered in regions that progressed to the most severe injury. From this it appears that at least in the case of brain trauma, the presence of a hypermetabolic signal alone at acute time-points is not necessarily a predictor of impending axonal injury. Rather, it is the existence of a metabolic rate that is inappropriate for the underlying level of blood flow and cellular energy demand that is a more useful indicator.
A causal link between flow-metabolism uncoupling and the development of axonal injury has not been reported before, although the idea that gray matter neuropathologic alterations correspond to areas of uncoupling after FP injury has been suggested, although not directly measured (Ginsberg et al., 1997). Secondary cell loss has been shown to result from the preferential stimulation of glycolysis resulting from periods of neuronal stimulation applied after trauma (Ip et al., 2003). It might be considered that in the nonstimulated injured brain, secondary injury occurs in a similar manner: by periodic and uncontrolled energy demand that outstrips the local blood supply resulting in energy failure, for example, because of increased neuronal activity commonly observed after injury (Kirino et al., 1985; Carmichael and Chesselet, 2002; Sunami et al., 1989; Strong et al., 2002). Given that white matter is reliant on oxidative metabolism, at least in vitro (Stys, 1998; Waxman et al., 1992), white matter regions where glycolysis is already abnormally high relative to the underlying level of local blood flow would be especially vulnerable to this type of stress, which would hasten the onset of an energy crisis resulting in membrane pump failure followed by the ensuing cascade of reactions, most notably caused by calcium entry (Buki et al., 1999; Wolf et al., 2001) and ultimately leading to disruption of the axonal cytoskeleton. Given the importance of axonal injury to outcome after TBI (Strich, 1956; Graham, 1996), therapies designed to stabilize and improve flow and metabolism in the acute time period after injury may confer some degree of neuroprotection translating to significant improvements in long-term functional outcome.
Blood flow and metabolic thresholds
An interesting finding produced by this study is that further axonal injury developed at 24 hours only within tissue regions where the acute time-point LCBF was below a threshold of ~50 mL min−1 100 g−1 and a flow-metabolism ratio more than ~1.5 μmol mL−1 (Fig. 6). The existence of a threshold for the accumulation of β3-APP may not be surprising because at least in gray matter, the degree of ischemia-induced β-APP expression at 24 hours in the gerbil was correlated with the length of the preceding ischemic period (Tomimoto et al., 1994), whereas reperfusion until 24 hours in the rat resulted in a remarkable reduction in axonal β-APP staining compared to permanent ischemia (Valeriani et al., 2000). Similarly, it may not be purely coincidental that the acute time-point blood-flow threshold associated with the progression of axonal damage corresponds roughly to the threshold of 55 mL min−1 100 g−1 for the suppression of protein synthesis in the gray matter of ischemic brain (Mies et al., 1991), because protein translation is inhibited within 4 to 24 hours of fluid percussion injury in neuronal perikarya of β-APP-positive axons (Singleton et al., 2002).
Methodological considerations
There is some controversy over whether the lumped constant changes after brain injury, and this issue is of great importance because regional or global differences from normality will result in the erroneous computation of LCMRglc values using the operational equation (Sokoloff et al., 1977) and assumptions associated with its use. A lumped constant value of 0.6 was used to calculate LCMRglc in this study, and this is 1.25-fold greater than that used for a 2DG experiment to account for the more rapid transport of FDG compared to 2DG (Lear and Ackermann, 1989). The values of K1, K2, and K3 used were based on data obtained from a kinetic analysis to determine the rate constants for FDG in normal rats (Ingvar et al., 1991), the results of which compare favorably with published CMRglc values obtained with the 2DG technique (Sokoloff et al., 1977). There is an early and temporary increase in blood–brain barrier permeability after experimental contusion injury (Whalen et al., 1998), and this may affect the lumped constant by either disrupting glucose transport function or altering the relative binding affinity for deoxyglucose and glucose. However, at least in the CCI model the lumped constant is unlikely to be affected at this early time-point because the volume of distribution of methyl glucose was shown to be uniform in most injured rats (Richards et al., 2001). The lumped constant has been shown to increase significantly after focal ischemia because of depletion of tissue glucose (Nakai et al., 1987). However, as described in our results and other studies, the CBF reduction associated with experimental trauma is generally above the ischemic threshold except in the contusion core (Yamakami and McIntosh, 1991; Bryan et al., 1995; Kochanek et al., 1995; Forbes et al., 1997; Ginsberg et al., 1997; Richards et al., 2001). Finally it should be noted that we have not attempted to control for any effect of differential exposure to anesthetic between the groups β hours exposure versus a brief exposure in the 3-hour and 24-hour injury groups, respectively).
To summarize, we have demonstrated significant uncoupling in flow-metabolism at 3 hours after injury. A significant relationship exists between the severity of the acute derangement in flow and uncoupling from metabolism and the degree of axonal damage at a more chronic time point. There may be a threshold of blood flow reduction and metabolic uncoupling that must be reached in order for secondary axonal injury to occur. Future studies are required to assess the therapeutic potential for early intervention to reduce the uncoupling and improve axonal or functional outcome.