
Abstract
The pathway for the olfactory response may be affected at an early stage of Alzheimer's disease. Measurement of the olfactory response in the elderly is therefore of particular interest. In this feasibility study, near-infrared spectroscopy was used to measure the olfactory response in 21 patients aged 56 to 79 years. Eight subjects had no memory complaints whereas 13 had subjective memory complaints, mild cognitive impairment, or very mild Alzheimer's disease. The optodes were placed over the temporal lobe, with the emitting optode over the pole and the receiving optode over the superior gyrus. The response to vanilla (1% in sterile H2O) in a test tube held immediately beneath the nostrils was compared to the response to sterile H2O only. Four control subjects had a clearly definable response with increased oxyhemoglobin and decreased deoxyhemoglobin bilaterally. The response was measured as the sum of the deviation of oxygenated and deoxygenated hemoglobin from baseline mean. With a cut-off determined after examination of responses to vanilla and sham stimulus, group difference was significant for response to vanilla (χ2 test, P = 0.03). Response amplitudes to vanilla in the patient group were within the range of those to sham stimuli.
Olfactory signals are transmitted from the olfactory bulb to a subregion of the entorhinal cortex (Insausti et al., 2002), part of the primary olfactory cortex. Higher-order olfactory processing occurs in several areas, including the superior gyrus of the temporal lobe and lateral and anterior orbitofrontal gyri of the frontal lobe (Kareken et al., 2001; Sobel et al., 1998). The entorhinal cortex gives rise to the bulk of afferent input to the hippocampal formation, and is affected at an early stage of Alzheimer's disease (AD) (Du et al., 2002; Gomez-Isla et al., 1996). This damage probably contributes to the early loss of memory in AD (Millien et al., 2002), and may also contribute to the olfactory loss that is observed early in the disease (Devanand et al., 2000; Hawkes, 2003; Mesholam et al., 1998). Positron emission tomography studies have shown that patients with AD have reduced perfusion in the entorhinal cortex and anteroventral temporal lobe after olfactory stimulation (Kareken et al., 2001). To the best of our knowledge, other temporal regions have not been examined in this condition. Near-infrared spectroscopy (NIRS) is a noninvasive technique that measures cortical perfusion real time, reflecting activation (Obrig et al., 2000). Although it has not been applied to measurements in patients with AD, perfusion in the superior gyrus of the temporal lobe should be accessible to measurements using this technique (Bartocci et al., 2000).
MATERIALS AND METHODS
Patients
After obtaining approval from the local ethics committee, participants were selected from a group of patients with disease ranging from mild cognitive impairment to very mild AD. Patients (n = 13, 6 males, mean age 66 [range, 56–72] years) had an average Mini-Mental State score (Folstein et al., 1975) of 24 (range, 17–29), whereas controls (n = 8, 5 males, mean age 66 [range, 56–79] years) had an average Mini-Mental State score of 29 (range, 26–30). A full investigation for memory complaints, including clinical investigation (neurologic and neuro-psychological), imaging (magnetic resonance and HMPAO single photon emission computed tomography), EEG, chest radiograph, cerebrospinal fluid examination (including Aβ42 and τ measurements), and standard blood tests in all cases supported the diagnosis and excluded other diseases (two patients had evidence of subcortical ischemia on magnetic resonance imaging). Spouses were invited to participate as controls, provided that they had no memory complaints or known brain disease. As a part of the study, Mini-Mental State examination, Cognistat test (Kiernan et al., 1987), Wechsler Memory Scale Story B (Wechsler, 1987), and the continuous visual memory test (Trahan and Larrabee, 1988) as well as clinical olfactory tests were performed in both patients and controls. Control patients with scores below cutoff on any domain in the Cognistat test were excluded.
The NIRS method
Near-infrared spectroscopy measures changes in the tissue concentration of oxygenated ([O2Hb]) and deoxygenated ([HHb]) hemoglobin, expressed in micromolar units (Fig. 2a). Variations in [O2Hb] and [HHb] were monitored using a double-channel NIRS device (NIRO 300, Hamamatsu Photonics, Hamamatsu, Japan). The basic principles of NIRS as applied to the study of cortical activation have been described previously in detail (Heekeren et al., 1999; Matcher et al., 1994; Obrig et al., 2000). Near-infrared light is provided by an emission optode and detected by a recipient optode. Each pair of optodes was placed in a special semirigid rubber holder with an interoptode distance of 4 cm over the temporal pole and superior temporal gyrus (Figs. 1a and 1b), positioned symmetrically on each side of the skull. The emitting optode was placed 2 cm above the line between the lateral edge of the orbita and the external auditory meatus (orbitomeatal line), corresponding to a point 0.56 times the full distance of the line measured from the edge to the meatus. A line through the optodes crossed the orbitomeatal line with a frontally open angle of 100°. This location illuminates the temporal pole and the superior gyrus of the temporal lobe. Sampling was performed every second.
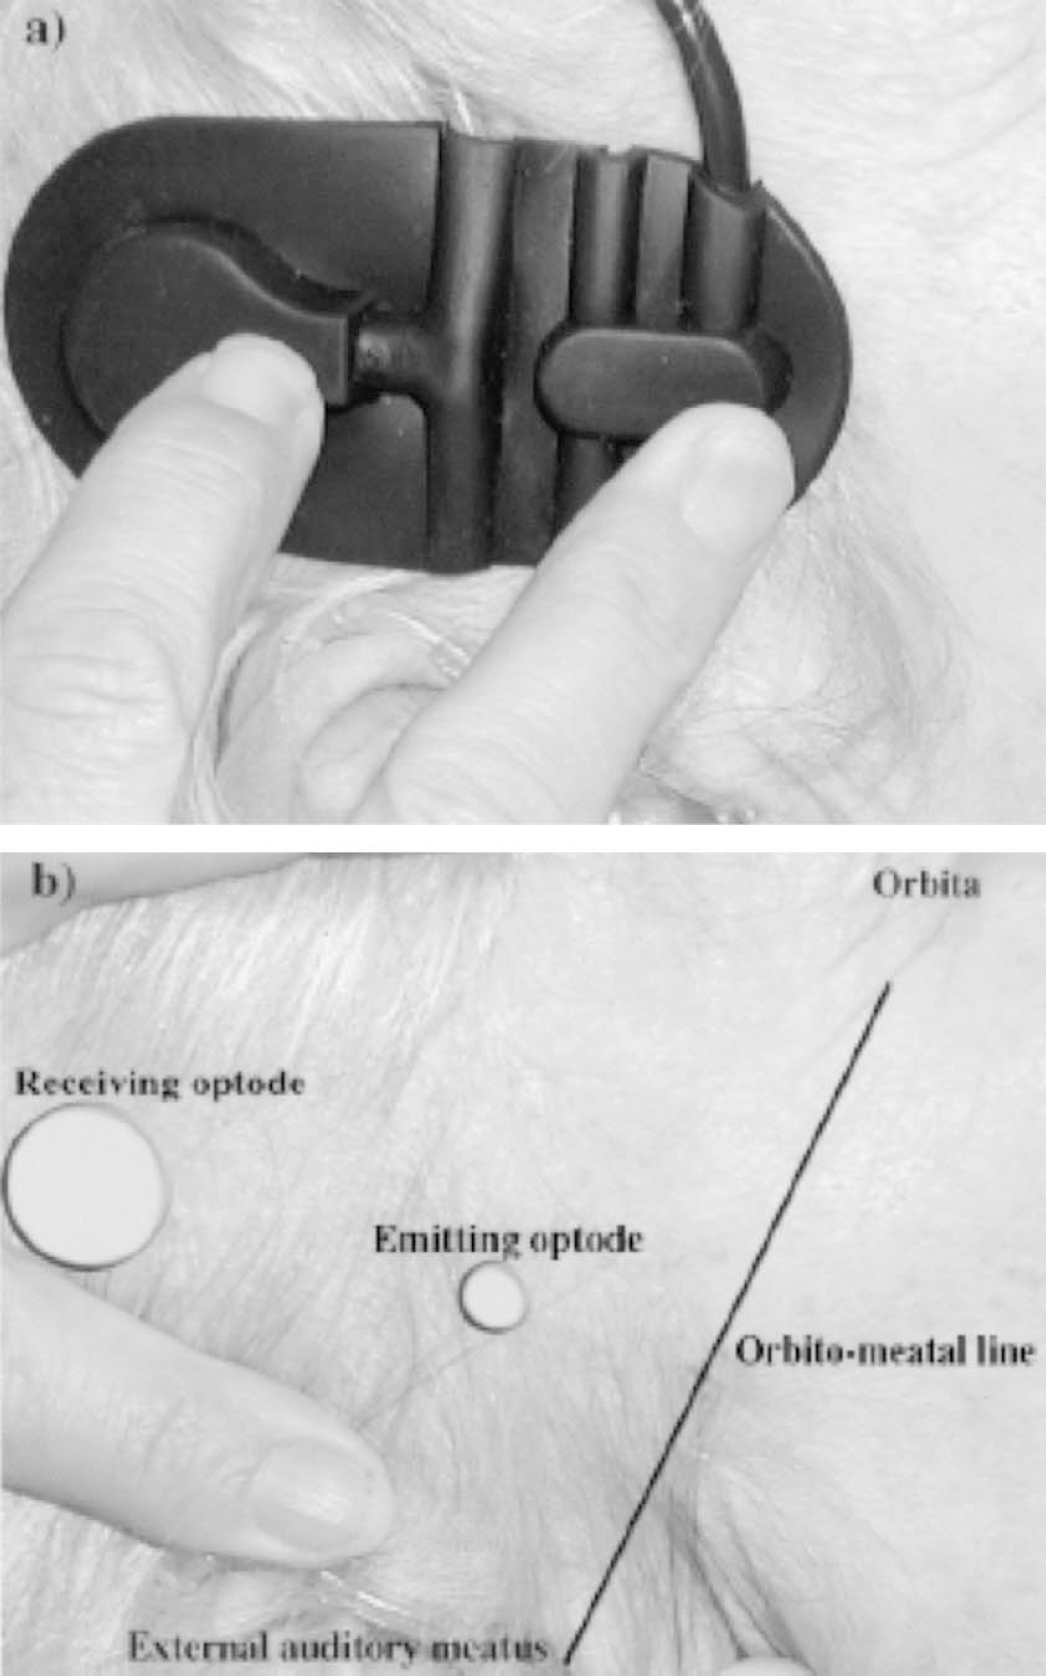
Shown are the position of the rubber holder containing optodes positioned over the temporal cortex as determined by skull topographic markers (
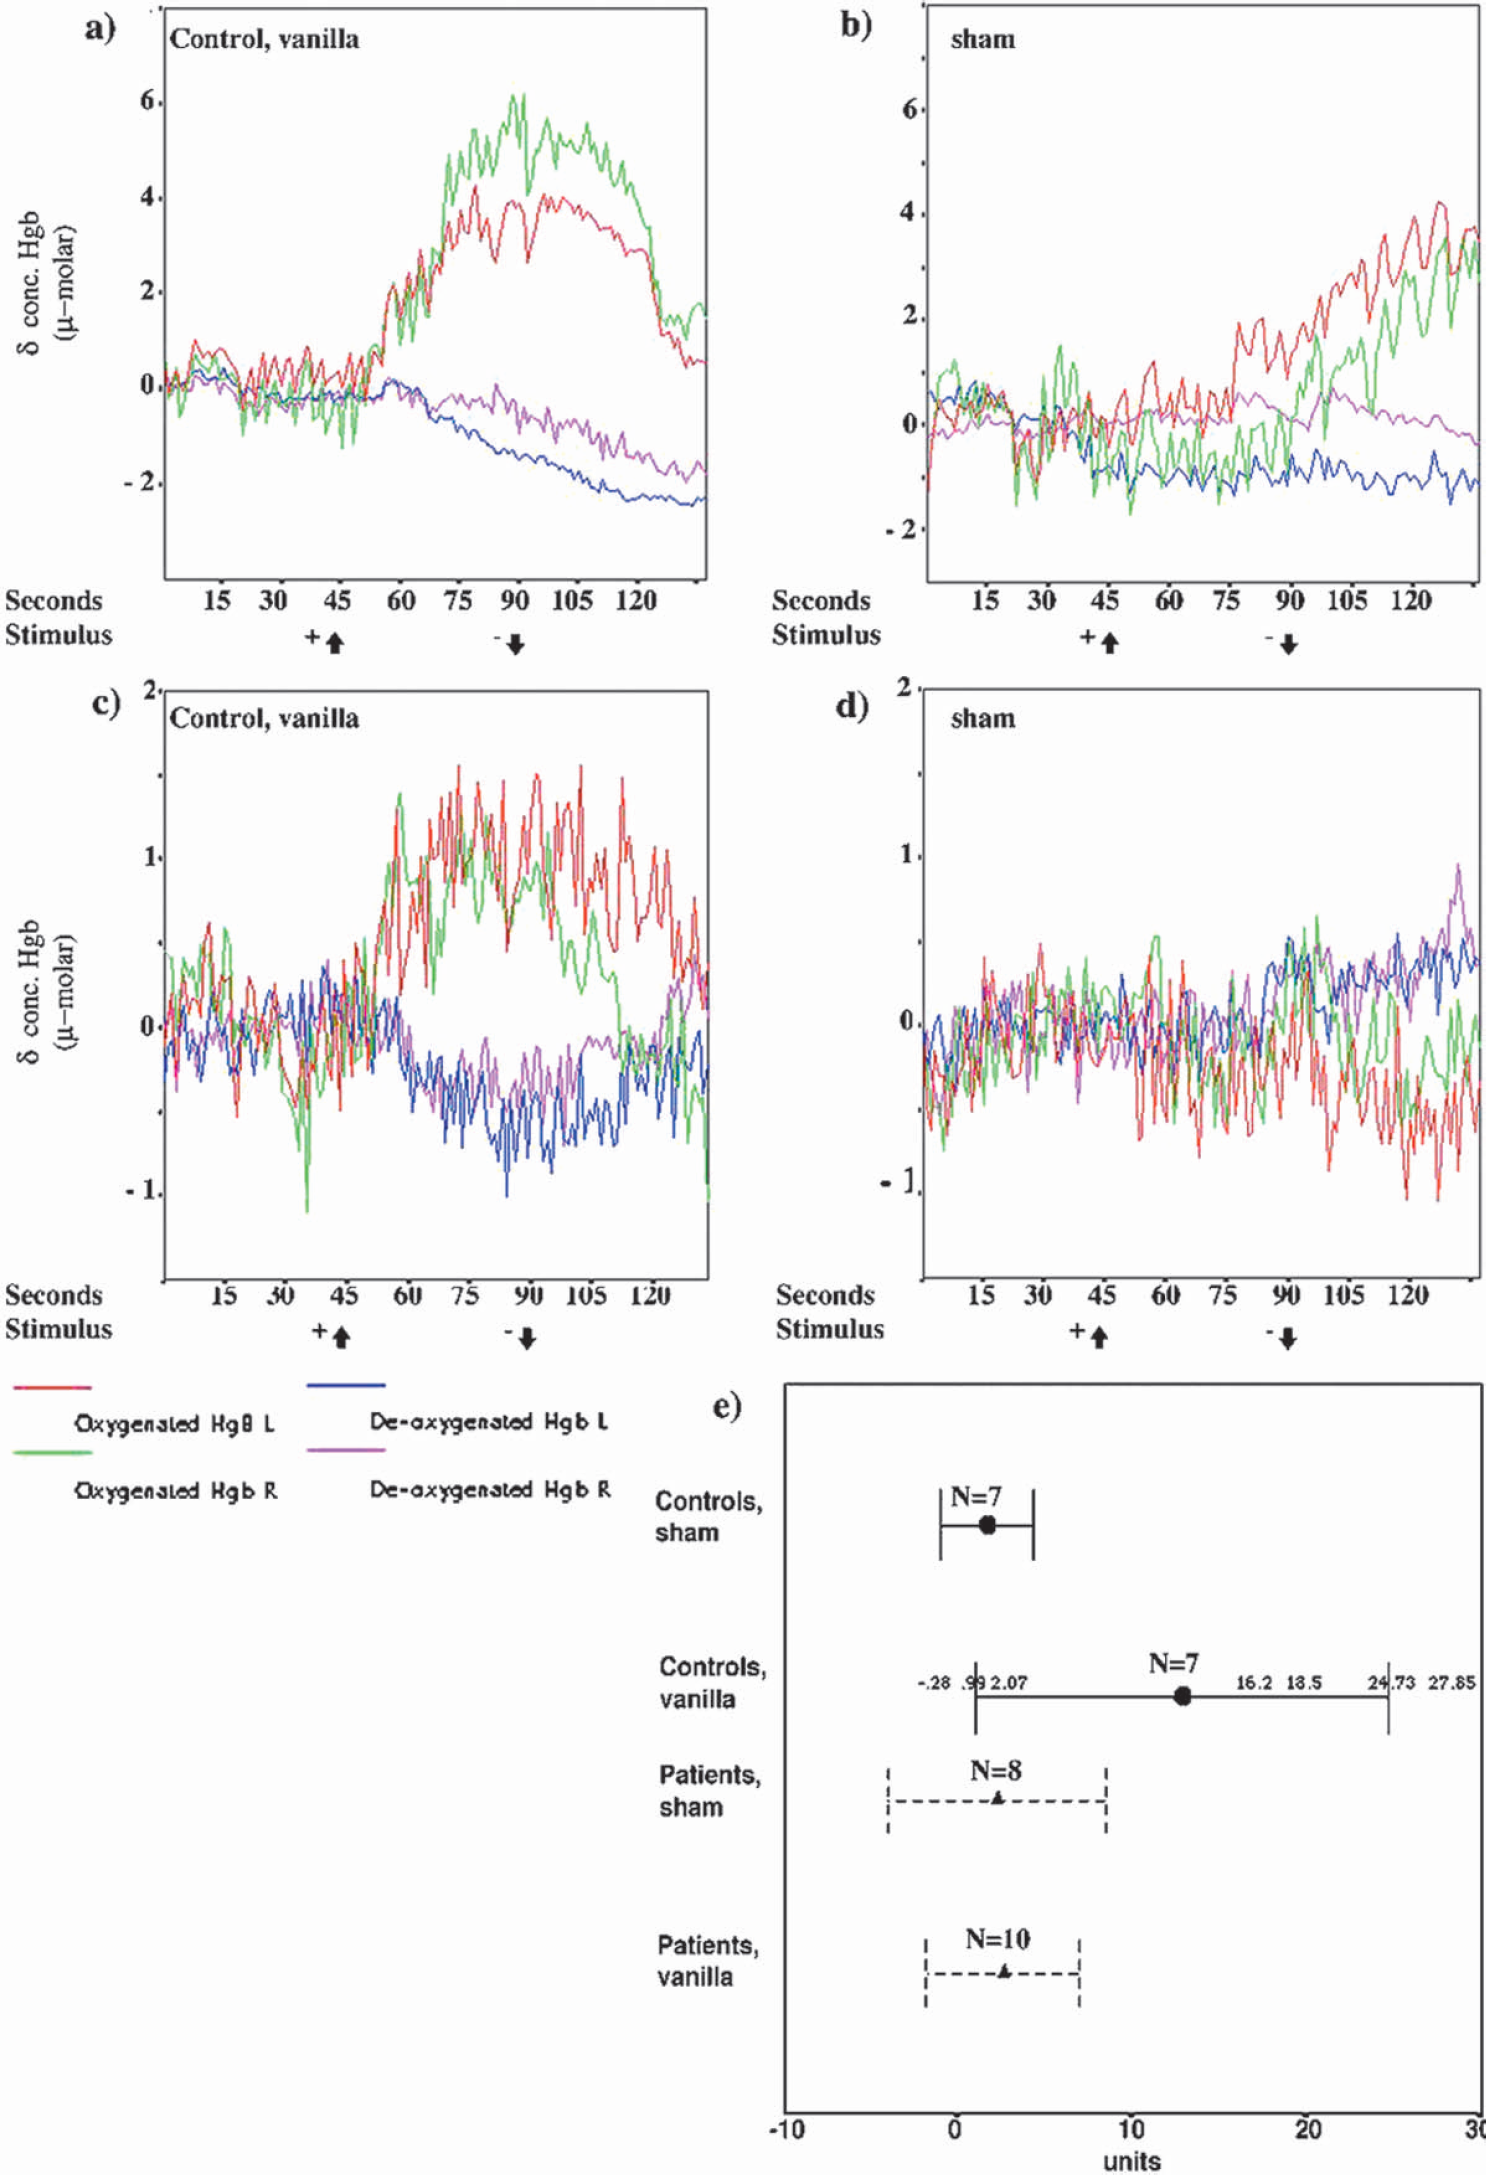
Shown are positive responses to vanilla stimulus from two controls (
Experiment
After a starting period of about 3 minutes, during which the signal was adjusted and stabilized, a 40-second period of NIRS baseline was defined. A tube containing vanilla substance 1% in H2O or pure H2O (sham) was held beneath the nostrils for 45 seconds at a distance of approximately 1 cm. Each second, NIRS data were transferred and recorded on a connected computer through an RS232 A/D board and variations in the concentrations of O2Hb and HHb were analyzed.
Data analysis and statistics
For each patient, data from 30-second prestimulus baseline period were compared with data obtained during seconds 70 to 85 of the stimulus periods for each type of stimulus (vanilla and sham) (Fig. 2a). Subjects with obvious artifacts (deflections with high-amplitude and frequency) during these periods were excluded (three patients and one control; in addition, sham-stimulus data from two patients were excluded). The NIRS data contained trends that were eliminated by the use of a moving mean. Data from a window of 75 seconds were used to calculate the moving mean for each point in the series (for further description, see Hoare and Beatty, 2000). Data from each second was then divided by its corresponding moving mean to eliminate the trend. Trend-adjusted data were used to calculate the difference from baseline for each event, using the following measure:
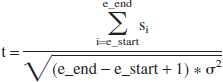
where e_end is the end of the measured event period, e_start is the start of the measured event period, and si is the variables difference from baseline mean. The denominator adjusts the measure for standard deviation. A typical positive response is characterized by an increase in O2Hb and a decrease in HHb; thus, the variable used in the test is defined as μmol/L O2Hb − μmol/L HHb/SD (= “unit”). A cutoff value (10 units) for a χ2 test was established after examination of vanilla and sham response amplitudes. Due to possible differences in the distribution of response amplitudes within the groups (i.e., the control group consists of both responders and nonresponders), statistical analysis was restricted to nonparametric tests.
RESULTS
Four controls had a clearly definable response consisting of decreased HHb and increased O2Hb (Figs. 2a and 2c), and small or no discernable response to sham stimuli (Figs. 2b and 2d). Using a post hoc cutoff point of a δ value of 10 for the oxygenated-deoxygenated hemoglobin difference to vanilla stimuli, the difference between the patient and control groups is significant (P = 0.03, χ2 test). Three controls and all of the patients had a response within the range of that to sham stimulus (Fig. 2e). Tests were repeated after a 4-week interval for two controls and one patient. One subject had repeated positive results and two subjects had repeated negative responses (data not shown).
DISCUSSION
This small feasibility study shows that NIRS may be used to measure a response to olfactory stimuli in the temporal lobe of the elderly. Because the pathway for the olfactory response is through the entorhinal cortex, the response may be diminished at an early stage of AD. Although NIRS is a promising method, it has to be refined; e.g., with respect to measurement of nasal air flow as a control for inadvertent sniffing (Warren et al., 1994). We plan to use the olfactory response in NIRS in a larger, prospective study for further evaluation as to the clinical usefulness of the method.
Footnotes
Acknowledgements
The authors thank Marco Bartocci and Ludwig Schleinkofer for their advice at the start, and Ingrid Fjellestad, Lizbeth Fladby, Åse Randi Bråthen, and Marit Sætervadet for their assistance.